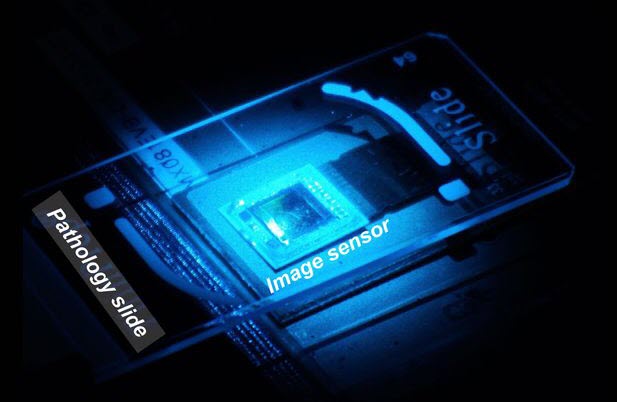
Healthcare analytics, AI solutions for biological big data, providing an AI platform for the biotech, life sciences, medical and pharmaceutical industries, as well as for related technological approaches, i.e., curation and text analysis with machine learning and other activities related to AI applications to these industries.
The first priority cited by the vice president was data sharing. Biden defended the concept as essential to advancing the process of cancer research and countered a January 21 New England Journal of Medicine editorial in which editor-in-chief Jeffrey Drazen, M.D., contended that data sharing could breed data “parasites.”
Four days later, Dr. Drazen clarified NEJM’s position by adding that with “appropriate systems” in place, “we will require a commitment from authors to make available the data that underlie the reported results of their work within 6 months after we publish them.”
Other priorities Biden said should serve as the basis of new incentives:
Involve patients in clinical trial design—Raising awareness of trials, and allowing patients to participate in how they are designed and conducted, could help address the difficulty of recruiting patients for studies. Only 4% of cancer patients are involved in a trial, he said.
“Let scientists do science”—Biden contrasted unfavorably NIH’s roughly 1-year process for decisions on grants to that of the Prostate Cancer Foundation, which limits grant applications to 10 pages and decides on those funding requests within 30 days: “Why is it that it takes multiple submissions and more than a year to get an answer from us?” Biden said.
Encourage grants from younger researchers—Biden decried the current professional system under which younger researchers are sidetracked for years doing administrative work in labs before they can pursue their own research grants: “It’s like asking Derek Jeter to take several years off to sell bonds to build Yankee Stadium,” the VP quipped.
Measure progress by outcomes—Rather than the quantity of research papers generated by grants, Biden said, “what you propose and how it affects patients, it seems to me, should be the basis of whether you continue to get the grant.”
Promote open-access publication of results—Biden criticized academic publishing’s reliance on paid-subscription journals that block content behind paywalls and which own data for up to a year. He contrasted that system with the Bill and Melinda Gates Foundation’s stipulation that the research it funds be published in an open-access journal and be freely available once published.
Reward verification—Research that verifies results through replication should be encouraged, Biden said, which acknowledging that few people now get such funding.
Biden recalled how following Beau’s diagnosis with cancer, he and his wife Jill Biden, Ed.D., who introduced the VP at the AACR event, “had access to the best doctors in the world.”
“The more we talked to them, the more we understood that we are on the cusp of a real inflection point in the fight against cancer.”
Updated 4/12/2019
Pediatric Cancer Initiatives
Data Sharing for Pediatric Cancers: President Trump Announces Pledge to Fight Childhood Cancer Will Involve Genomic Data Sharing Effort
In the journal Science, Drs. Olena Morozova Vaske ( and David Haussler University of California, Santa Cruz) recently wrote an editorial entitled “Data Sharing for Pediatric Cancers“, in which they discuss the implications of President Trump’s intentions to increase funding for pediatric cancers with a corresponding effort for genomic data sharing. Also discussed is the current efforts on pediatric genomic data sharing as well as some opinions on coordinating these efforts on a world-wide scale to benefit the patients, researchers, and clinicians.
The article is found below as it is a very good read on the state of data sharing in the pediatric cancer field and offers some very good insights in designing such a worldwide system to handle this data sharing, including allowing patients governance over their own data.
Last month, in a conference call held by the U.S. Department of Health and Human Services and National Institutes of Health (NIH), it was revealed that a large focus of President Trump’s pledge to fund childhood cancer research will be genomic data sharing. Although the United States has only 5% of the world’s pediatric cancer cases, it has disproportionately more resources and access to genomic information compared to low-income countries. We hope that the spotlight on genomic data sharing in the United States will galvanize the world’s pediatric cancer community to elevate genomic data sharing to a level where its full potential can finally be realized.
Pediatric cancers are rare, affecting 50 to 200 children per million a year worldwide. Thus, with 16 different major types and many subtypes, no cancer center encounters large cohorts of patients with the same diagnosis. To advance their understanding of particular cancer subtypes, pediatric oncologists must have access to data from similar cases at other centers. Because subtypes of pediatric cancer are rare, assembling large cohorts is a limiting factor in clinical trials as well. Here, too, data sharing is the first critical step.
Typically, pediatric cancers don’t have the number of mutations that make immunotherapies effective, and only a few subtypes have recurrent mutations that can be used to develop gene-targeted therapies. However, the abnormal expression level of genes gives a vivid picture of genetic misregulation, and just sharing this information would be a huge step forward. Using gene expression and mutation data, analysis of genetic misregulation in different pediatric cancer subtypes could point the way to new treatments.
A major challenge in genomic data sharing is the patient’s young age, which frequently precludes an opportunity for informed consent. Compounding this, the rarity of subtypes requires the aggregation of patients from multiple jurisdictions, raising barriers to assembling large representative data sets. A greater percentage of children than adults with cancer participate in research studies, and children often participate in multiple studies. However, this means that data collected on individual children may be found at multiple institutions, creating difficulties if there are no standards for data sharing.
To enable effective sharing of genomic and clinical data, the Global Alliance for Genomics and Health has developed the Key Implications for Data Sharing (KIDS) framework for pediatric genomics. The recommendations include involving children in the data-sharing decision-making process and imposing an ethical obligation on data generators to provide children and parents with the opportunity to share genomic and clinical information with researchers. Although KIDS guidelines are not legally binding, they could inform policy development worldwide.
To advance the sharing culture, along with the NIH, pediatric cancer foundations such as the St. Baldrick’s Foundation and Alex’s Lemonade Stand Foundation have incorporated genomic data-sharing requirements into their grants processes. Researchers and clinicians around the world have created dozens of pediatric cancer genomic databases and portals, but pulling these together into a larger network is problematic, especially for patients with data at more than one institution, as patient identifiers are stripped from shared data. However, initiatives like the Children’s Oncology Group’s Project Every Child and the European Network for Cancer Research in Children and Adolescents’ Unified Patient Identity may resolve this issue.
We urge the creators of pediatric cancer genomic resources to collaborate and build a real-time federated data-sharing system, and hope that the new U.S. initiative will inspire other countries to link databases rather than just create new siloed regional resources. The great advances in information technology and life sciences in the last decades have given us a new opportunity to save our children from the scourge of cancer. We must resolve to use them.
Imaging of Cancer Cells, Volume 2 (Volume Two: Latest in Genomics Methodologies for Therapeutics: Gene Editing, NGS and BioInformatics, Simulations and the Genome Ontology), Part 1: Next Generation Sequencing (NGS)
Imaging of Cancer Cells
Larry H. Bernstein, MD, FCAP, Curator
LPBI
Microscope uses nanosecond-speed laser and deep learning to detect cancer cells more efficiently
April 13, 2016
Scientists at the California NanoSystems Institute at UCLA have developed a new technique for identifying cancer cells in blood samples faster and more accurately than the current standard methods.
In one common approach to testing for cancer, doctors add biochemicals to blood samples. Those biochemicals attach biological “labels” to the cancer cells, and those labels enable instruments to detect and identify them. However, the biochemicals can damage the cells and render the samples unusable for future analyses. There are other current techniques that don’t use labeling but can be inaccurate because they identify cancer cells based only on one physical characteristic.
Time-stretch quantitative phase imaging (TS-QPI) and analytics system
The new technique images cells without destroying them and can identify 16 physical characteristics — including size, granularity and biomass — instead of just one.
The new technique combines two components that were invented at UCLA:
A “photonic time stretch” microscope, which is capable of quickly imaging cells in blood samples. Invented by Barham Jalali, professor and Northrop-Grumman Optoelectronics Chair in electrical engineering, it works by taking pictures of flowing blood cells using laser bursts (similar to how a camera uses a flash). Each flash only lasts nanoseconds (billionths of a second) to avoid damage to cells, but that normally means the images are both too weak to be detected and too fast to be digitized by normal instrumentation. The new microscope overcomes those challenges by using specially designed optics that amplify and boost the clarity of the images, and simultaneously slow them down enough to be detected and digitized at a rate of 36 million images per second.
A deep learning computer program, which identifies cancer cells with more than 95 percent accuracy. Deep learning is a form of artificial intelligence that uses complex algorithms to extract patterns and knowledge from rich multidimenstional datasets, with the goal of achieving accurate decision making.
The study was published in the open-access journal Nature Scientific Reports. The researchers write in the paper that the system could lead to data-driven diagnoses by cells’ physical characteristics, which could allow quicker and earlier diagnoses of cancer, for example, and better understanding of the tumor-specific gene expression in cells, which could facilitate new treatments for disease.
The research was supported by NantWorks, LLC.
Abstract of Deep Learning in Label-free Cell Classification
Label-free cell analysis is essential to personalized genomics, cancer diagnostics, and drug development as it avoids adverse effects of staining reagents on cellular viability and cell signaling. However, currently available label-free cell assays mostly rely only on a single feature and lack sufficient differentiation. Also, the sample size analyzed by these assays is limited due to their low throughput. Here, we integrate feature extraction and deep learning with high-throughput quantitative imaging enabled by photonic time stretch, achieving record high accuracy in label-free cell classification. Our system captures quantitative optical phase and intensity images and extracts multiple biophysical features of individual cells. These biophysical measurements form a hyperdimensional feature space in which supervised learning is performed for cell classification. We compare various learning algorithms including artificial neural network, support vector machine, logistic regression, and a novel deep learning pipeline, which adopts global optimization of receiver operating characteristics. As a validation of the enhanced sensitivity and specificity of our system, we show classification of white blood T-cells against colon cancer cells, as well as lipid accumulating algal strains for biofuel production. This system opens up a new path to data-driven phenotypic diagnosis and better understanding of the heterogeneous gene expressions in cells.
references:
Claire Lifan Chen, Ata Mahjoubfar, Li-Chia Tai, Ian K. Blaby, Allen Huang, Kayvan Reza Niazi & Bahram Jalali. Deep Learning in Label-free Cell Classification. Scientific Reports 6, Article number: 21471 (2016); doi:10.1038/srep21471 (open access)
Supplementary Information
Deep Learning in Label-free Cell Classification
Claire Lifan Chen, Ata Mahjoubfar, Li-Chia Tai, Ian K. Blaby, Allen Huang,Kayvan Reza Niazi & Bahram Jalali
Deep learning extracts patterns and knowledge from rich multidimenstional datasets. While it is extensively used for image recognition and speech processing, its application to label-free classification of cells has not been exploited. Flow cytometry is a powerful tool for large-scale cell analysis due to its ability to measure anisotropic elastic light scattering of millions of individual cells as well as emission of fluorescent labels conjugated to cells1,2. However, each cell is represented with single values per detection channels (forward scatter, side scatter, and emission bands) and often requires labeling with specific biomarkers for acceptable classification accuracy1,3. Imaging flow cytometry4,5 on the other hand captures images of cells, revealing significantly more information about the cells. For example, it can distinguish clusters and debris that would otherwise result in false positive identification in a conventional flow cytometer based on light scattering6.
In addition to classification accuracy, the throughput is another critical specification of a flow cytometer. Indeed high throughput, typically 100,000 cells per second, is needed to screen a large enough cell population to find rare abnormal cells that are indicative of early stage diseases. However there is a fundamental trade-off between throughput and accuracy in any measurement system7,8. For example, imaging flow cytometers face a throughput limit imposed by the speed of the CCD or the CMOS cameras, a number that is approximately 2000 cells/s for present systems9. Higher flow rates lead to blurred cell images due to the finite camera shutter speed. Many applications of flow analyzers such as cancer diagnostics, drug discovery, biofuel development, and emulsion characterization require classification of large sample sizes with a high-degree of statistical accuracy10. This has fueled research into alternative optical diagnostic techniques for characterization of cells and particles in flow.
Recently, our group has developed a label-free imaging flow-cytometry technique based on coherent optical implementation of the photonic time stretch concept11. This instrument overcomes the trade-off between sensitivity and speed by using Amplified Time-stretch Dispersive Fourier Transform12,13,14,15. In time stretched imaging16, the object’s spatial information is encoded in the spectrum of laser pulses within a pulse duration of sub-nanoseconds (Fig. 1). Each pulse representing one frame of the camera is then stretched in time so that it can be digitized in real-time by an electronic analog-to-digital converter (ADC). The ultra-fast pulse illumination freezes the motion of high-speed cells or particles in flow to achieve blur-free imaging. Detection sensitivity is challenged by the low number of photons collected during the ultra-short shutter time (optical pulse width) and the drop in the peak optical power resulting from the time stretch. These issues are solved in time stretch imaging by implementing a low noise-figure Raman amplifier within the dispersive device that performs time stretching8,11,16. Moreover, warped stretch transform17,18can be used in time stretch imaging to achieve optical image compression and nonuniform spatial resolution over the field-of-view19. In the coherent version of the instrument, the time stretch imaging is combined with spectral interferometry to measure quantitative phase and intensity images in real-time and at high throughput20. Integrated with a microfluidic channel, coherent time stretch imaging system in this work measures both quantitative optical phase shift and loss of individual cells as a high-speed imaging flow cytometer, capturing 36 million images per second in flow rates as high as 10 meters per second, reaching up to 100,000 cells per second throughput.
Box 1: The pulse train is spatially dispersed into a train of rainbow flashes illuminating the target as line scans. The spatial features of the target are encoded into the spectrum of the broadband optical pulses, each representing a one-dimensional frame. The ultra-short optical pulse illumination freezes the motion of cells during high speed flow to achieve blur-free imaging with a throughput of 100,000 cells/s. The phase shift and intensity loss at each location within the field of view are embedded into the spectral interference patterns using a Michelson interferometer. Box 2: The interferogram pulses were then stretched in time so that spatial information could be mapped into time through time-stretch dispersive Fourier transform (TS-DFT), and then captured by a single pixel photodetector and an analog-to-digital converter (ADC). The loss of sensitivity at high shutter speed is compensated by stimulated Raman amplification during time stretch. Box 3: (a) Pulse synchronization; the time-domain signal carrying serially captured rainbow pulses is transformed into a series of one-dimensional spatial maps, which are used for forming line images. (b) The biomass density of a cell leads to a spatially varying optical phase shift. When a rainbow flash passes through the cells, the changes in refractive index at different locations will cause phase walk-off at interrogation wavelengths. Hilbert transformation and phase unwrapping are used to extract the spatial phase shift. (c) Decoding the phase shift in each pulse at each wavelength and remapping it into a pixel reveals the protein concentration distribution within cells. The optical loss induced by the cells, embedded in the pulse intensity variations, is obtained from the amplitude of the slowly varying envelope of the spectral interferograms. Thus, quantitative optical phase shift and intensity loss images are captured simultaneously. Both images are calibrated based on the regions where the cells are absent. Cell features describing morphology, granularity, biomass, etc are extracted from the images. (d) These biophysical features are used in a machine learning algorithm for high-accuracy label-free classification of the cells.
On another note, surface markers used to label cells, such as EpCAM21, are unavailable in some applications; for example, melanoma or pancreatic circulating tumor cells (CTCs) as well as some cancer stem cells are EpCAM-negative and will escape EpCAM-based detection platforms22. Furthermore, large-population cell sorting opens the doors to downstream operations, where the negative impacts of labels on cellular behavior and viability are often unacceptable23. Cell labels may cause activating/inhibitory signal transduction, altering the behavior of the desired cellular subtypes, potentially leading to errors in downstream analysis, such as DNA sequencing and subpopulation regrowth. In this way, quantitative phase imaging (QPI) methods24,25,26,27 that categorize unlabeled living cells with high accuracy are needed. Coherent time stretch imaging is a method that enables quantitative phase imaging at ultrahigh throughput for non-invasive label-free screening of large number of cells.
In this work, the information of quantitative optical loss and phase images are fused into expert designed features, leading to a record label-free classification accuracy when combined with deep learning. Image mining techniques are applied, for the first time, to time stretch quantitative phase imaging to measure biophysical attributes including protein concentration, optical loss, and morphological features of single cells at an ultrahigh flow rate and in a label-free fashion. These attributes differ widely28,29,30,31 among cells and their variations reflect important information of genotypes and physiological stimuli32. The multiplexed biophysical features thus lead to information-rich hyper-dimensional representation of the cells for label-free classification with high statistical precision.
We further improved the accuracy, repeatability, and the balance between sensitivity and specificity of our label-free cell classification by a novel machine learning pipeline, which harnesses the advantages of multivariate supervised learning, as well as unique training by evolutionary global optimization of receiver operating characteristics (ROC). To demonstrate sensitivity, specificity, and accuracy of multi-feature label-free flow cytometry using our technique, we classified (1) OT-IIhybridoma T-lymphocytes and SW-480 colon cancer epithelial cells, and (2) Chlamydomonas reinhardtii algal cells (herein referred to as Chlamydomonas) based on their lipid content, which is related to the yield in biofuel production. Our preliminary results show that compared to classification by individual biophysical parameters, our label-free hyperdimensional technique improves the detection accuracy from 77.8% to 95.5%, or in other words, reduces the classification inaccuracy by about five times. ……..
Feature Extraction
The decomposed components of sequential line scans form pairs of spatial maps, namely, optical phase and loss images as shown in Fig. 2 (see Section Methods: Image Reconstruction). These images are used to obtain biophysical fingerprints of the cells8,36. With domain expertise, raw images are fused and transformed into a suitable set of biophysical features, listed in Table 1, which the deep learning model further converts into learned features for improved classification.
The new technique combines two components that were invented at UCLA:
A “photonic time stretch” microscope, which is capable of quickly imaging cells in blood samples. Invented by Barham Jalali, professor and Northrop-Grumman Optoelectronics Chair in electrical engineering, it works by taking pictures of flowing blood cells using laser bursts (similar to how a camera uses a flash). Each flash only lasts nanoseconds (billionths of a second) to avoid damage to cells, but that normally means the images are both too weak to be detected and too fast to be digitized by normal instrumentation. The new microscope overcomes those challenges by using specially designed optics that amplify and boost the clarity of the images, and simultaneously slow them down enough to be detected and digitized at a rate of 36 million images per second.
A deep learning computer program, which identifies cancer cells with more than 95 percent accuracy. Deep learning is a form of artificial intelligence that uses complex algorithms to extract patterns and knowledge from rich multidimenstional datasets, with the goal of achieving accurate decision making.
The study was published in the open-access journal Nature Scientific Reports. The researchers write in the paper that the system could lead to data-driven diagnoses by cells’ physical characteristics, which could allow quicker and earlier diagnoses of cancer, for example, and better understanding of the tumor-specific gene expression in cells, which could facilitate new treatments for disease.
The optical loss images of the cells are affected by the attenuation of multiplexed wavelength components passing through the cells. The attenuation itself is governed by the absorption of the light in cells as well as the scattering from the surface of the cells and from the internal cell organelles. The optical loss image is derived from the low frequency component of the pulse interferograms. The optical phase image is extracted from the analytic form of the high frequency component of the pulse interferograms using Hilbert Transformation, followed by a phase unwrapping algorithm. Details of these derivations can be found in Section Methods. Also, supplementary Videos 1 and 2 show measurements of cell-induced optical path length difference by TS-QPI at four different points along the rainbow for OT-II and SW-480, respectively.
Table 1: List of extracted features.
Feature Name Description Category
Figure 3: Biophysical features formed by image fusion.
(a) Pairwise correlation matrix visualized as a heat map. The map depicts the correlation between all major 16 features extracted from the quantitative images. Diagonal elements of the matrix represent correlation of each parameter with itself, i.e. the autocorrelation. The subsets in box 1, box 2, and box 3 show high correlation because they are mainly related to morphological, optical phase, and optical loss feature categories, respectively. (b) Ranking of biophysical features based on their AUCs in single-feature classification. Blue bars show performance of the morphological parameters, which includes diameter along the interrogation rainbow, diameter along the flow direction, tight cell area, loose cell area, perimeter, circularity, major axis length, orientation, and median radius. As expected, morphology contains most information, but other biophysical features can contribute to improved performance of label-free cell classification. Orange bars show optical phase shift features i.e. optical path length differences and refractive index difference. Green bars show optical loss features representing scattering and absorption by the cell. The best performed feature in these three categories are marked in red.
Figure 4: Machine learning pipeline. Information of quantitative optical phase and loss images are fused to extract multivariate biophysical features of each cell, which are fed into a fully-connected neural network.
The neural network maps input features by a chain of weighted sum and nonlinear activation functions into learned feature space, convenient for classification. This deep neural network is globally trained via area under the curve (AUC) of the receiver operating characteristics (ROC). Each ROC curve corresponds to a set of weights for connections to an output node, generated by scanning the weight of the bias node. The training process maximizes AUC, pushing the ROC curve toward the upper left corner, which means improved sensitivity and specificity in classification.
…. How to cite this article: Chen, C. L. et al. Deep Learning in Label-free Cell Classification.
To better characterize the functional context of genomic variations in cancer, researchers developed a new computer algorithm called REVEALER. [UC San Diego Health]
Scientists at the University of California San Diego School of Medicine and the Broad Institute say they have developed a new computer algorithm—REVEALER—to better characterize the functional context of genomic variations in cancer. The tool, described in a paper (“Characterizing Genomic Alterations in Cancer by Complementary Functional Associations”) published in Nature Biotechnology, is designed to help researchers identify groups of genetic variations that together associate with a particular way cancer cells get activated, or how they respond to certain treatments.
REVEALER is available for free to the global scientific community via the bioinformatics software portal GenePattern.org.
“This computational analysis method effectively uncovers the functional context of genomic alterations, such as gene mutations, amplifications, or deletions, that drive tumor formation,” said senior author Pablo Tamayo, Ph.D., professor and co-director of the UC San Diego Moores Cancer Center Genomics and Computational Biology Shared Resource.
Dr. Tamayo and team tested REVEALER using The Cancer Genome Atlas (TCGA), the NIH’s database of genomic information from more than 500 human tumors representing many cancer types. REVEALER revealed gene alterations associated with the activation of several cellular processes known to play a role in tumor development and response to certain drugs. Some of these gene mutations were already known, but others were new.
For example, the researchers discovered new activating genomic abnormalities for beta-catenin, a cancer-promoting protein, and for the oxidative stress response that some cancers hijack to increase their viability.
REVEALER requires as input high-quality genomic data and a significant number of cancer samples, which can be a challenge, according to Dr. Tamayo. But REVEALER is more sensitive at detecting similarities between different types of genomic features and less dependent on simplifying statistical assumptions, compared to other methods, he adds.
“This study demonstrates the potential of combining functional profiling of cells with the characterizations of cancer genomes via next-generation sequencing,” said co-senior author Jill P. Mesirov, Ph.D., professor and associate vice chancellor for computational health sciences at UC San Diego School of Medicine.
Characterizing genomic alterations in cancer by complementary functional associations
Jong Wook Kim, Olga B Botvinnik, Omar Abudayyeh, Chet Birger, et al.
Systematic efforts to sequence the cancer genome have identified large numbers of mutations and copy number alterations in human cancers. However, elucidating the functional consequences of these variants, and their interactions to drive or maintain oncogenic states, remains a challenge in cancer research. We developed REVEALER, a computational method that identifies combinations of mutually exclusive genomic alterations correlated with functional phenotypes, such as the activation or gene dependency of oncogenic pathways or sensitivity to a drug treatment. We used REVEALER to uncover complementary genomic alterations associated with the transcriptional activation of β-catenin and NRF2, MEK-inhibitor sensitivity, and KRAS dependency. REVEALER successfully identified both known and new associations, demonstrating the power of combining functional profiles with extensive characterization of genomic alterations in cancer genomes
Figure 2: REVEALER results for transcriptional activation of β-catenin in cancer.close
(a) This heatmap illustrates the use of the REVEALER approach to find complementary genomic alterations that match the transcriptional activation of β-catenin in cancer. The target profile is a TCF4 reporter that provides an estimate of…
An imaging-based platform for high-content, quantitative evaluation of therapeutic response in 3D tumour models
Jonathan P. Celli, Imran Rizvi, Adam R. Blanden, Iqbal Massodi, Michael D. Glidden, Brian W. Pogue & Tayyaba Hasan
While it is increasingly recognized that three-dimensional (3D) cell culture models recapitulate drug responses of human cancers with more fidelity than monolayer cultures, a lack of quantitative analysis methods limit their implementation for reliable and routine assessment of emerging therapies. Here, we introduce an approach based on computational analysis of fluorescence image data to provide high-content readouts of dose-dependent cytotoxicity, growth inhibition, treatment-induced architectural changes and size-dependent response in 3D tumour models. We demonstrate this approach in adherent 3D ovarian and pancreatic multiwell extracellular matrix tumour overlays subjected to a panel of clinically relevant cytotoxic modalities and appropriately designed controls for reliable quantification of fluorescence signal. This streamlined methodology reads out the high density of information embedded in 3D culture systems, while maintaining a level of speed and efficiency traditionally achieved with global colorimetric reporters in order to facilitate broader implementation of 3D tumour models in therapeutic screening.
The attrition rates for preclinical development of oncology therapeutics are particularly dismal due to a complex set of factors which includes 1) the failure of pre-clinical models to recapitulate determinants of in vivo treatment response, and 2) the limited ability of available assays to extract treatment-specific data integral to the complexities of therapeutic responses1,2,3. Three-dimensional (3D) tumour models have been shown to restore crucial stromal interactions which are missing in the more commonly used 2D cell culture and that influence tumour organization and architecture4,5,6,7,8, as well as therapeutic response9,10, multicellular resistance (MCR)11,12, drug penetration13,14, hypoxia15,16, and anti-apoptotic signaling17. However, such sophisticated models can only have an impact on therapeutic guidance if they are accompanied by robust quantitative assays, not only for cell viability but also for providing mechanistic insights related to the outcomes. While numerous assays for drug discovery exist18, they are generally not developed for use in 3D systems and are often inherently unsuitable. For example, colorimetric conversion products have been noted to bind to extracellular matrix (ECM)19 and traditional colorimetric cytotoxicity assays reduce treatment response to a single number reflecting a biochemical event that has been equated to cell viability (e.g. tetrazolium salt conversion20). Such approaches fail to provide insight into the spatial patterns of response within colonies, morphological or structural effects of drug response, or how overall culture viability may be obscuring the status of sub-populations that are resistant or partially responsive. Hence, the full benefit of implementing 3D tumour models in therapeutic development has yet to be realized for lack of analytical methods that describe the very aspects of treatment outcome that these systems restore.
Motivated by these factors, we introduce a new platform for quantitative in situ treatment assessment (qVISTA) in 3D tumour models based on computational analysis of information-dense biological image datasets (bioimage-informatics)21,22. This methodology provides software end-users with multiple levels of complexity in output content, from rapidly-interpreted dose response relationships to higher content quantitative insights into treatment-dependent architectural changes, spatial patterns of cytotoxicity within fields of multicellular structures, and statistical analysis of nodule-by-nodule size-dependent viability. The approach introduced here is cognizant of tradeoffs between optical resolution, data sampling (statistics), depth of field, and widespread usability (instrumentation requirement). Specifically, it is optimized for interpretation of fluorescent signals for disease-specific 3D tumour micronodules that are sufficiently small that thousands can be imaged simultaneously with little or no optical bias from widefield integration of signal along the optical axis of each object. At the core of our methodology is the premise that the copious numerical readouts gleaned from segmentation and interpretation of fluorescence signals in these image datasets can be converted into usable information to classify treatment effects comprehensively, without sacrificing the throughput of traditional screening approaches. It is hoped that this comprehensive treatment-assessment methodology will have significant impact in facilitating more sophisticated implementation of 3D cell culture models in preclinical screening by providing a level of content and biological relevance impossible with existing assays in monolayer cell culture in order to focus therapeutic targets and strategies before costly and tedious testing in animal models.
Using two different cell lines and as depicted in Figure 1, we adopt an ECM overlay method pioneered originally for 3D breast cancer models23, and developed in previous studies by us to model micrometastatic ovarian cancer19,24. This system leads to the formation of adherent multicellular 3D acini in approximately the same focal plane atop a laminin-rich ECM bed, implemented here in glass-bottom multiwell imaging plates for automated microscopy. The 3D nodules resultant from restoration of ECM signaling5,8, are heterogeneous in size24, in contrast to other 3D spheroid methods, such as rotary or hanging drop cultures10, in which cells are driven to aggregate into uniformly sized spheroids due to lack of an appropriate substrate to adhere to. Although the latter processes are also biologically relevant, it is the adherent tumour populations characteristic of advanced metastatic disease that are more likely to be managed with medical oncology, which are the focus of therapeutic evaluation herein. The heterogeneity in 3D structures formed via ECM overlay is validated here by endoscopic imaging ofin vivo tumours in orthotopic xenografts derived from the same cells (OVCAR-5).
Figure 1: A simplified schematic flow chart of imaging-based quantitative in situ treatment assessment (qVISTA) in 3D cell culture.
(This figure was prepared in Adobe Illustrator® software by MD Glidden, JP Celli and I Rizvi). A detailed breakdown of the image processing (Step 4) is provided in Supplemental Figure 1.
A critical component of the imaging-based strategy introduced here is the rational tradeoff of image-acquisition parameters for field of view, depth of field and optical resolution, and the development of image processing routines for appropriate removal of background, scaling of fluorescence signals from more than one channel and reliable segmentation of nodules. In order to obtain depth-resolved 3D structures for each nodule at sub-micron lateral resolution using a laser-scanning confocal system, it would require ~ 40 hours (at approximately 100 fields for each well with a 20× objective, times 1 minute/field for a coarse z-stack, times 24 wells) to image a single plate with the same coverage achieved in this study. Even if the resources were available to devote to such time-intensive image acquisition, not to mention the processing, the optical properties of the fluorophores would change during the required time frame for image acquisition, even with environmental controls to maintain culture viability during such extended imaging. The approach developed here, with a mind toward adaptation into high throughput screening, provides a rational balance of speed, requiring less than 30 minutes/plate, and statistical rigour, providing images of thousands of nodules in this time, as required for the high-content analysis developed in this study. These parameters can be further optimized for specific scenarios. For example, we obtain the same number of images in a 96 well plate as for a 24 well plate by acquiring only a single field from each well, rather than 4 stitched fields. This quadruples the number conditions assayed in a single run, at the expense of the number of nodules per condition, and therefore the ability to obtain statistical data sets for size-dependent response, Dfrac and other segmentation-dependent numerical readouts.
We envision that the system for high-content interrogation of therapeutic response in 3D cell culture could have widespread impact in multiple arenas from basic research to large scale drug development campaigns. As such, the treatment assessment methodology presented here does not require extraordinary optical instrumentation or computational resources, making it widely accessible to any research laboratory with an inverted fluorescence microscope and modestly equipped personal computer. And although we have focused here on cancer models, the methodology is broadly applicable to quantitative evaluation of other tissue models in regenerative medicine and tissue engineering. While this analysis toolbox could have impact in facilitating the implementation of in vitro 3D models in preclinical treatment evaluation in smaller academic laboratories, it could also be adopted as part of the screening pipeline in large pharma settings. With the implementation of appropriate temperature controls to handle basement membranes in current robotic liquid handling systems, our analyses could be used in ultra high-throughput screening. In addition to removing non-efficacious potential candidate drugs earlier in the pipeline, this approach could also yield the additional economic advantage of minimizing the use of costly time-intensive animal models through better estimates of dose range, sequence and schedule for combination regimens.
Microscope Uses AI to Find Cancer Cells More Efficiently
Scientists at the California NanoSystems Institute at UCLA have developed a new technique for identifying cancer cells in blood samples faster and more accurately than the current standard methods.
In one common approach to testing for cancer, doctors add biochemicals to blood samples. Those biochemicals attach biological “labels” to the cancer cells, and those labels enable instruments to detect and identify them. However, the biochemicals can damage the cells and render the samples unusable for future analyses.
There are other current techniques that don’t use labeling but can be inaccurate because they identify cancer cells based only on one physical characteristic.
The new technique images cells without destroying them and can identify 16 physical characteristics — including size, granularity and biomass — instead of just one. It combines two components that were invented at UCLA: a photonic time stretch microscope, which is capable of quickly imaging cells in blood samples, and a deep learning computer program that identifies cancer cells with over 95 percent accuracy.
Deep learning is a form of artificial intelligence that uses complex algorithms to extract meaning from data with the goal of achieving accurate decision making.
The study, which was published in the journal Nature Scientific Reports, was led by Barham Jalali, professor and Northrop-Grumman Optoelectronics Chair in electrical engineering; Claire Lifan Chen, a UCLA doctoral student; and Ata Mahjoubfar, a UCLA postdoctoral fellow.
Photonic time stretch was invented by Jalali, and he holds a patent for the technology. The new microscope is just one of many possible applications; it works by taking pictures of flowing blood cells using laser bursts in the way that a camera uses a flash. This process happens so quickly — in nanoseconds, or billionths of a second — that the images would be too weak to be detected and too fast to be digitized by normal instrumentation.
The new microscope overcomes those challenges using specially designed optics that boost the clarity of the images and simultaneously slow them enough to be detected and digitized at a rate of 36 million images per second. It then uses deep learning to distinguish cancer cells from healthy white blood cells.
“Each frame is slowed down in time and optically amplified so it can be digitized,” Mahjoubfar said. “This lets us perform fast cell imaging that the artificial intelligence component can distinguish.”
Normally, taking pictures in such minuscule periods of time would require intense illumination, which could destroy live cells. The UCLA approach also eliminates that problem.
“The photonic time stretch technique allows us to identify rogue cells in a short time with low-level illumination,” Chen said.
The researchers write in the paper that the system could lead to data-driven diagnoses by cells’ physical characteristics, which could allow quicker and earlier diagnoses of cancer, for example, and better understanding of the tumor-specific gene expression in cells, which could facilitate new treatments for disease. ….. see also http://www.nature.com/article-assets/npg/srep/2016/160315/srep21471/images_hires/m685/srep21471-f1.jpg
For the more than 680,000 Americans living with a brain tumor, there is a revolutionary research effort under way at the Cedars-Sinai Precision Medicine Initiative in Brain Cancer in Los Angeles to look at ways of using precision science to tailor personalized treatments for individuals with malignant brain tumors.
Brain Cancer Meets Precision Science
Brain cancer continues to be among the hardest of diseases to treat. Until now, most medical treatments for the most common, aggressive and lethal form of brain cancer, glioblastoma multiforme, which affects more than 138,000 Americans yearly, have been designed for the average patient. Given that every cancer is genetically unique, this “one-size-fits-all” drug treatment has not worked for brain cancer and for most solid cancers. Unfortunately, today’s standard-of-care, which includes surgical removal, radiation therapy, and chemotherapy, has only modest benefits with patients living on average 15 months after diagnosis.
“Precision Medicine, an innovative approach that takes into account individual differences in people’s genes, environments and lifestyles, only works when we apply ‘Precision Science’ to the effort,” notes Dr. Chirag Patil, M.D., Neurosurgeon & Program Director at Cedars-Sinai Medical Center. “If we want to treat cancer more effectively, we need a novel approach to cancer care. In our program, we use tumor genomics and precision science to build a holistic mathematical model of cancer that then can be used to develop new, personalized cancer treatments. Right now, we’re focused on the most common type of brain cancer, but are developing a unique scientific process that could tackle ANY type of cancer.”
This past year, the White House launched the Precision Medicine Initiative to dramatically improve health and treatment through a $215 million investment in the President’s 2016 budget. The Initiative will provide additional impetus to Precision Medicine’s approach to disease prevention and treatment that has already led to powerful new discoveries and several new treatment methods for critical diseases.
Caption: The Cedars-Sinai program uses precision science to build a mathematical virtual brain tumor for testing.
Delivering Personalized Cancer Care Through Big Data And Virtual Simulations
Harnessing the power of big data, Dr. Patil’s program puts a patient’s brain tumor through next-generation genomic sequencing to establish a comprehensive profile of that specific brain cancer. Researchers, in collaboration with Cellworks Inc., a therapeutics design company, use this profile to build a mathematical “virtual“ tumor cell. The simulations are then compared to the real patient tumor cells that have been growing in Dr. Patil’s laboratory. The “real data” from experiments in the lab are used to confirm the virtual tumor model – again, this is customized for each individual patient.
The next step is to run a virtual experiment where all FDA-approved targeted drug combinations are tried on the virtual tumor cell to identify the best drug combination that eradicates the cells for the specific brain tumor. In the final step, researchers expose the patient’s real cancer cells to this unique and personalized drug combination to ensure that it effectively kills the patient’s cancer cells in the laboratory.
Spreading the Word
This effort is not someday in the future but is happening now, and has demonstrated remarkable progress in the last six months. Researchers expect to have data on 30 brain cancer patients from this precision medicine strategy by mid-2016. From this, they will develop an innovative randomized clinical trial, not simply to compare one drug to another, but rather compare this innovative Precision Medicine treatment algorithm to a current standard treatment regimen.
Learn More
For more information on this revolutionary approach, visit www.BrainTumorExpert.com, to learn more about Dr. Patil and his precision science approach to treating brain tumors.
Other related articles published in this Open Access Online Scientific Journal include the following:
2015
The 11th Annual Personalized Medicine Conference, November 18-19, 2015, Joseph B. Martin Conference Center of the Harvard New Research Building at Harvard Medical School
Genome Analysis Toolkit (GATK) the Industry Standard will govern the New Tools in Biomedical Research by the Collaboration of Broad Institute and Intel, Volume 2 (Volume Two: Latest in Genomics Methodologies for Therapeutics: Gene Editing, NGS and BioInformatics, Simulations and the Genome Ontology), Part 1: Next Generation Sequencing (NGS)
Genome Analysis Toolkit (GATK) the Industry Standard will govern the New Tools in Biomedical Research by the Collaboration of Broad Institute and Intel
Curator: Aviva Lev-Ari, PhD, RN
In 2015 we published the following Genomics-related e-Books on Amazon.com
Metabolic Genomics and Pharmaceutics, on Amazon since 7/21/2015
Cardiovascular Diseases, Volume Four: Regenerative and Translational Medicine: The Therapeutics Promise for Cardiovascular Diseases, on Amazon since 12/26/2015
Volume 2: Cancer Therapies: Metabolic, Genomics, Interventional, Immunotherapy and Nanotechnology in Therapy Delivery
Authors, Curators and Editors:
Larry H Bernstein, MD, FCAP and Stephen J Williams, PhD
and
Series B: e-Books on Genomics & Medicine
Volume 2: Latest in Genomics Methodologies for Therapeutics: Gene Editing, NGS & BioInformatics, Simulations and the Genome Ontology
Editors: Stephen J Williams, PhD and TBA
Work-in-Progress
We plan to conduct several interviews with Intel and Broad Institute. Contents of theseinterviews will be included in this forthcoming Volume on NGS, Series B Volume 2.
In this e-Book we plan to cover BioIT efforts at the following Research Centers:
This morning, 4/6/2016, the Broad Institute and Intel announced that they’re working together to develop new tools aimed at accelerating biomedical research. The tools are integrated with GATK (industry standard Genome Analysis Toolkit) to simplify and speed up genomic research, and are already being used across collective data sets from Oregon Health Sciences University (OHSU), Dana-Farber Cancer Institute (DFCI) and the Ontario Institute for Cancer Research (OICR), as part of Intel and OHSU’s precision medicine network called the Collaborative Cancer Cloud. See full press release below.
The tools include:
Cromwell – designed to launch genomic pipelines on private or public clouds in a portable and reproducible manner. Broad is working with Intel to extend Cromwell’s capabilities to support multiple input languages and execute on multiple back ends simultaneously, enabling researchers to run jobs anywhere.
GenomicsDB – is a novel way to store vast amounts of patient variant data and to perform fast processing with unprecedented scalability. Built and optimized for the management of genomic variant data, GenomicsDB runs on top of an array database system optimized for sparse data called ‘TileDB,’ developed by MIT and Intel researchers.
Also announced at BioIT World, the Broad Institute has teamed up with
Intel,
AWS,
Cloudera,
Google,
IBM,
Intel, and
Microsoft
to enable cloud-based access to the GATK. The GATK Best Practices pipeline will be available to users of cloud service providers through a software-as-a-service (SaaS) mechanism, expanding access beyond traditional desktop solutions in hopes of fueling new insights into disease and treatment. The pipeline is optimized to work with both Cromwell and GenomicsDB, with a primary focus on
variant discovery, and
genotyping
Cloudera, Broad Institute Collaborate on the Next Generation of the Genome Analysis Toolkit
Built on Cloudera Enterprise with Apache Spark as the Bioinformatics Standard, GATK4 Designed to SpeedGenomic Research
PALO ALTO, Calif., April 06, 2016 — Cloudera, the global provider of the fastest, easiest, and most secure data management and analytics platform built on Apache Hadoop and the latest open source technologies, today announced a collaboration with the Broad Institute of MIT and Harvard, the world’s leading biomedical and genomic research center. The two organizations are working together this year to advance the development of Broad’s next generation Genome Analysis Toolkit, GATK4.
Cloudera Enterprise accelerates life sciences research and drug discovery by putting real-time data into the hands of the clinicians, researchers, and providers focused on personalizing the patient experience. Building the fourth generation of GATK (GATK4) on Cloudera Enterprise and utilizing the Spark distributed computing framework to speed research, the Broad Institute is facilitating better understanding of genomic sequencing, resulting in faster data exploration and ultimately empowering better clinical decisions.
Since the Human Genome Project produced the first draft sequence of the human genome in 2000, the cost of sequencing has dropped exponentially, from around $100 million USD per genome to around $1,000 USD today. Over the same period, we have seen massive growth in the storage and processing capabilities of big data technologies like Hadoop.
“This lower cost of genome sequencing and advancement in big data technologies means that we can afford to sequence the genome of patients very broadly and produce datasets that have never been available before,” said Shawn Dolley, industry leader of life sciences at Cloudera. “Building the next generation toolkit on Spark greatly accelerates in-memory computations and facilitates parallelism. Cloudera Enterprise expedites round-trips to access and compute data for data discovery, translating into significant reductions in R&D time. This will have a very meaningful scientific upside.”
Presently there are more than 31,000 registered users of the GATK. Broad Institute is working with collaborators to develop cloud-hosted options to expand access and facilitate usage of genome analysis tools for even more powerful insights and decision-making. Users could also more easily create best-practice pipelines and avoid duplicating infrastructures.
“Utilizing the Spark computing framework on Cloudera Enterprise gives us the ability to implement tools that were not possible in GATK3 due to their computational complexity,” said Dr. Eric Banks, senior director of Data Sciences and Data Engineering at Broad and a creator of the GATK software package. “On Cloudera Enterprise, we can now run analysis of genomic data two orders of magnitude faster than in previous versions of GATK, enabling faster iterative analysis for propelling genomic innovation.“
About Cloudera
Cloudera delivers the modern data management and analytics platform built on Apache Hadoop and the latest open source technologies. The world’s leading organizations trust Cloudera to help solve their most challenging business problems with Cloudera Enterprise, the fastest, easiest and most secure data platform available for the modern world. Our customers efficiently capture, store, process and analyze vast amounts of data, empowering them to use advanced analytics to drive business decisions quickly, flexibly and at lower cost than has been possible before. To ensure our customers are successful, we offer comprehensive support, training and professional services. Learn more at cloudera.com.
Broad Institute, Intel work together to develop tools to accelerate biomedical research
CAMBRIDGE, Mass. April 6, 2016 – Intel Corporation and the Broad Institute of MIT and Harvard will announce today at the Bio-IT World Conference & Expo that they are co-developing new tools, and advancing fundamental capabilities, so large genomic workflows can run at cloud scale.
Today Broad Institute is also announcing collaborations with cloud providers to enable cloud-based access to its Genome Analysis Toolkit (GATK) software package. This is expected to expand access to the GATK Best Practices pipeline. The new tools Broad is developing with Intel aim to simplify the execution of large genomic workflows such as GATK, and to improve the storage, scalability, and processing of genomic data. This has the potential to not only speed variant detection and biomarker discovery, but enable discoveries that would not have been detected with smaller cohorts.
Broad’s workflow execution engine, called “Cromwell”, is designed to launch genomic pipelines on private or public clouds in a portable and reproducible manner. Broad is working with Intel to extend Cromwell’s capabilities to support multiple input languages and execute on multiple back ends simultaneously, enabling researchers to run jobs anywhere.
This integrated workflow engine has built-in intelligence capable of finding the optimal way to execute tasks, the most appropriate hardware resources to run those tasks on, and methods to avoid redundant steps. “Orchestrating genomic workflows at cloud scale is complex,” said Dr. Eric Banks, Senior Director of Data Sciences and Data Engineering at Broad and a creator of the GATK software package. “We wanted to simplify the execution of common genomic data types like reads and variants and to create an environment that allows any researcher to do this at scale in an easy-to-use way.”
Another area of joint innovation is in the processing and storing of genomic variant datasets, which often consist of large, sparse data matrices. Gene sequence variation data is commonly stored as text files for bioinformatics. The declining cost of DNA sequencing has driven an increase in the volume of genomic data sets that researchers want to incorporate, making it increasingly difficult to jointly analyze large volumes of data from text files. Large scale reads and writes of variant call data, joint genotyping, or variant recalibration require next-generation databases that are built and optimized for genomic data.
Broad and Intel are collaborating on a faster, more flexible, and scalable solution. ‘GenomicsDB’ is a novel way to store vast amounts of patient variant data and to perform fast processing with unprecedented scalability. Built and optimized for the management of genomic variant data, GenomicsDB runs on top of an array database system optimized for sparse data called ‘TileDB.’
TileDB was developed by MIT and Intel researchers working at the Intel Science and Technology Center for Big Data, which is based at MIT’s Computer Science and Artificial Intelligence Lab. GenomicsDB is now used in the Broad’s production pipeline running on an Intel® Xeon® processor based cloud environment to perform joint genotyping.
“The time it now takes to perform the variant discovery process went from eight days to 18 hours,” Banks said. “However, that’s with 100 whole genomes. We routinely process projects with thousands of samples, so that speedup itself is truly transformative. We recently needed to abandon our attempt to run variant discovery on an eight thousand sample project because we estimated it would take 90 days without GenomicsDB. With GenomicsDB, however, it should take under a week. This means we can say ‘yes’ to our researchers far more often, on far more ambitious projects.”
“With the integration of these two tools into the genomic pipeline that we are running on a cloud environment, the orchestration and execution of the workflow is not only simplified but significantly accelerated,” said Ben Neale, an institute member at the Broad Institute’s Stanley Center for Psychiatric Research and the Broad’s Program in Medical and Population Genetics. “We are excited that the research community will be able to start testing GenomicsDB and Cromwell.” Intel is releasing TileDB and GenomicsDB as open source tools today.
Engineers building the ‘Collaborative Cancer Cloud’, a precision medicine network including Oregon Health Sciences University (OHSU), Dana-Farber Cancer Institute (DFCI), and Ontario Institute for Cancer Research (OICR) are already using these tools across their collective data sets. Long-term goals are to expand upon these tools to enable joint genotyping with other large genomic research centers in a federated and secure model, regardless of the location of data.
Broad will continue to work with Intel on next-generation computing technologies that address the size, speed, security and scalability challenges associated with large scale genomic sequencing data and analytics. “The progress that we’re seeing in our development work with Broad represents another step in the moonshot goal of taming cancer and other maladies,” said Eric Dishman, Intel Vice President, Health and Life Sciences. “Harnessing and analyzing massive amounts of genomic data may eventually be a key factor in enabling people around the world to live longer, healthier lives.”
Intel’s Cancer Cloud uses Big Data to fight disease
Intel is helping medical researchers to share important patient data
ABOUT OHSU
Dana-Farber Cancer Institute and Ontario Institute for Cancer Research join Collaborative Cancer Cloud
03/31/16 Portland, Ore.
Two leading cancer centers join effort to securely share genomic, imaging and clinical data to better understand the root causes of cancer and accelerate potentially lifesaving discoveries
The Knight Cancer Institute at Oregon Health & Science University and Intel Corporation are expanding participation in the Collaborative Cancer Cloud, a distributed precision medicine analytics platform, to include Dana-Farber Cancer Institute and Ontario Institute for Cancer Research. The institutions will join the OHSU Knight Cancer Institute in leveraging Intel’s technology to securely share and analyze their collectively large amounts of data, while preserving the privacy and security of patient data at each site.
The Collaborative Cancer Cloud combines Intel technologies and bioscience advancements to enable solutions that make it easier, faster and more affordable for developers, researchers and clinicians to determine how hundreds, even thousands of genes interact to drive disease in individual patients. The cancer cloud is designed to scale to unprecedented volumes of data and allows for secure, aggregated computation across distributed sites without loss of local control of the data, ensuring an institution’s ability to maintain proper custody of its datasets and protecting patient privacy and any institutional intellectual property that may result.
Engineers and scientists have come together to form a dynamic, new type of team that is developing novel hardware and software technologies optimized for current precision medicine analytics but engineered for longevity – with inherent flexibility to work with future computer platforms, data standards and analytics solutions.
The Collaborative Cancer Cloud’s unique technical capabilities are what attracted the two research institutions to join the collaboration.
“Through Dana-Farber’s ‘Profile’ project, we have created one of the world’s largest databases of genetic abnormalities that drive cancer, with over 15,000 genetic profiles of patients’ tumors, adding about 400 each month to the database,” said Barrett Rollins, M.D., chief scientific officer, Dana-Farber Cancer Institute. “We are excited to be part of the Collaborative Cancer Cloud and are convinced that the innovative data sharing structure developed by Intel and our academic partners will accelerate the delivery of better treatments to our patients.”
How do we address medical diagnostic errors? Volume 2 (Volume Two: Latest in Genomics Methodologies for Therapeutics: Gene Editing, NGS and BioInformatics, Simulations and the Genome Ontology), Part 1: Next Generation Sequencing (NGS)
How do we address medical diagnostic errors?
Larry H. Bernstein, MD, FCAP, Curator
LPBI
It is my observation over the course of 50 years in medicine that there is no simple resolution to a frequently identified problem, which has grown more serious with the implementation of hospital-wide and system-wide health information technology. There has been reduction of hospital staff, nurses and physicians, with an increased patient load even while the technology has advanced significantly. Over this investment in technology and manpower the hospital staff time has become dependent on the medical record and a large portion of their time is drawn away from patient care. This is not a substantial improvement in the last decade. The problem has been a lack of focus on the correct design of these systems. They should be interactive and they should have incorporated anticipatory logic. Instead, they are not that much more than large electronic filing cabinets. There are large sources of information in laboratory, radiology and pharmacy and are siloed. When one drives a car, one does not need to look under the hood, a sentiment that has been expressed by a real expert.
March 25, 2016 DARK DAILYinfo@darkreport.comvia cmail2.com
Along with its assessment of the rate of errors in diagnosis, the IOM has a plan to improve, but will doctors accept the IOM’s advice, or continue business as usual?
Diagnostic errors in the American healthcare system is a problem that is now on the radar screen of policymakers at the Institute of Medicine (IOM). Pathologists andclinical laboratory professionals will welcome this development, because recommendations from the IOM carry weight with Congress.
Thus, should the IOM develop specific actions items intended to reduce medical errors, not only are these suggestions likely to involve more effective use of medical laboratory tests by physicians, but there is a strong probability that Congress might eventually write these recommendations into future healthcare legislation.
The Institute of Medicine is a division of the National Academies of Sciences, Engineering, and Medicine. The IOM recently convened a committee that released a list of recommendations to address the problem of diagnostic errors in medicine. Those recommendations, however, are running up against ingrained mindsets and overconfidence on the part of physicians who are reluctant to include decision-support technology in the diagnostic process.
Misdiagnoses in healthcare has led to tragic consequences. Over the years, the IOM has worked to increase the public’s awareness of the problem of misdiagnosis. It has also encouraged health information technology (HIT) developers to provide clinicians with the decision-support systems they need to prevent misdiagnosis from happening in the first place. But getting physicians to use the new tools has become a challenge.
IOM Dedicated to Improving Diagnostic Accuracy
Preventing diagnostic errors has been a primary target in medical reform for many years. A 1999 report by the U.S Institute of Medicine (IOM) titled: “To Err Is Human: Building a Safer Health System” first drew attention to the rate of preventable medical errors in the U.S.
Since then, much has been written about the problem of diagnostic inaccuracy. Although many provider organizations are working to improve it, progress has been slow.
Edward Hoffer, MD (above), FACP, FACC, FACMI, is a faculty member at the Massachusetts General Hospital Laboratory of Computer Science. He told Modern Healthcare that getting doctors to use diagnostic software is a hard sell. “The main problem we face is trying to convince physicians that they actually need to use it,” he concluded. (Image copyright: Massachusetts General Hospital, Laboratory of Computer Science.)
Solutions for Preventing Errors Face Many Challenges
From the first evaluation of the patient, to the clinical laboratory, to physician follow-up; errors can occur throughout the chain of care. And a culture that discourages reporting of medical errors can make it very difficult for healthcare organizations to resolve these issues.
For example, an investigation by the Milwaukee Journal Sentinel uncovered what they say is a “secretive system [that] hides [medical] lab errors from the public and puts patients at risk.”
To make matters worse, according to the Journal Sentinel article, federal agencies that are tasked with oversight of the more than 35,000 clinical laboratories in the U.S. (such as the Joint Commission) are overloaded and thus may be missing many violations that would lead to sanctions or outright loss of accreditation.
The Milwaukee Journal Sentinel stated that, “even when serious violations are identified, offending labs are rarely sanctioned except in the most extreme cases.” And that “in 2013, just 90 sanctions were issued—accounting for not even 1% of the 35,000 labs that do high-level lab testing in the United States.”
Additionally, there are different types of misdiagnoses, which also complicates matters. A study by three professors at the Dartmouth Center for Healthcare Deliver Science investigated the cost of what they termed “silent misdiagnoses.”
According to a Dartmouth Now article outlining the study, the disparity between “the treatments patients want and what doctors think they want” accounts for a great number of misdiagnoses. The study’s authors call these misdiagnoses “silent” because they are rarely reported or recorded.
Albert G. Mulley, Jr., MD, MPP (above), is Managing Director, Global Health Care Delivery Science, The Dartmouth Institute for Health Policy and Clinical Practice; Professor of Medicine, Geisel School of Medicine at Dartmouth; and the lead author of the Dartmouth study. Mulley says that listening to the patient is more important than ever. “Today, the rise in treatment options makes this even more critical, not only to reach a correct medical diagnosis but also to understand fully the patients’ preferences, and reduce the huge waste in time and money that comes from delivery of services that patients often neither want nor need.” (Photo copyright: Dartmouth Now.)
IOM Committee on Diagnostic Error in Healthcare Releases Recommendations
This newest report is titled, “Improving Diagnosis in HealthCare.” It comes from the IOM’s National Academies of Medicine’s Committee on Diagnostic Error in Healthcare. The study lists recommendations that the IOM says will help improve the rate of diagnostic errors. Included are:
• Facilitate more effective teamwork in the diagnostic process;
• Enhance education in the healthcare community on the topic of improving diagnostics;
• Incorporate diagnostic support into electronic health records (EHRs), and make EHRs fully interoperable;
• Set up systems to identify, learn from, and reduce diagnostic errors;
• Establish a culture that encourages investigation of mistakes;
• Develop a collaborative reporting system that involves clinicians, government agencies, and liability insurers that allows everyone to learn from diagnostic errors and near misses;
• Design a payment system that supports correct diagnosis; and
• Provide funding for research into how to improve the diagnostic process.
One area of development that offers real hope for lowering the rate of misdiagnosis is medical decision-support software—specifically in clinical informatics, where the integration of health data with health information technology (HIT) supports physician decision making at the point of care.
Whether that software is part of an organization’s EHR system, or is a standalone program dedicated to reducing diagnostic errors, can make a difference. For example, a research study published in theJournal of Clinical Bioinformatics) suggests that health information technology has an important role to play in improving diagnostic accuracy.
The challenge is that, although the technology currently exists, diagnostic error rates remain high. A research study published in the Journal of the American Medical Association Internal Medicine (JAMA) in 2013 may explain why. It states that overconfidence could prevent some physicians from re-evaluating questionable diagnoses.
In a Modern Healthcare article, Edward Hoffer, MD, FACP, FACC, FACMI, a faculty member at the Massachusetts General Hospital Laboratory of Computer Science, said that getting doctors to use diagnostic software is a hard sell. “The main problem we face is trying to convince physicians that they actually need to use it,” he concluded.
All of the building blocks for improving the diagnostic process are either in place, or as in the case of EHR interoperability, in the works. Clinical laboratory personnel are uniquely positioned to assist physicians in improving through communication and the careful use of technology.
All of the building blocks for improving the diagnostic process are either in place, or as in the case of EHR interoperability, in the works. Nothing could be further from reality than what has been stated. There is no minimization of keystrokes. There is no anticipatory logic. There is no automated comparison of medication and diagnoses electronically. There is no check to determine the consistency of the laboratory results with a probability of diagnosis, or automated identification of tests that would clarify the situation.
Broadening the productivity spectrum with middleware
Anne Paxton
March 2016—As James Beck, MT(ASCP), remembers it, middleware was introduced at his institution about the same time that the nursing department decided connectivity should be the province of the laboratory.
When the concept of docking and interfacing glucose testing devices came on the scene around the turn of the millennium, that was a turning point, says Beck, who is point-of-care testing coordinator for the University of Pittsburgh Medical Center–St. Margaret, which uses the Telcor middleware solution QML. “What had previously been a nursing-run program turned into a lab-run program just because of their unfamiliarity with the electronics and connectivity issues. Our nursing department, at least, felt, okay, this is the end of line for us—you take it on.”
At that point, middleware was considered revolutionary in its ability just to handle getting point-of-care data to the laboratory information system, never mind to the hospital information system. But between its beginnings a couple of decades ago and today, middleware has charted a more multidimensional role. It is increasingly being called upon as an agile and resourceful productivity manager, software vendors and users say.
It was about 2006–2007 that middleware’s role started to evolve from connectivity to more “productivity opportunities,” Maureen Marentette recalls. Middleware vendor Data Innovations (DI), where Marentette is director of North American sales, started in 1989 with the interfacing of instruments to the LIS as its focus. Now, products like DI’s Instrument Manager take the information that instruments provide plus what the LIS provides, and “they combine those two pieces to provide powerful management of results at a completely different level.”
With drivers available from more than 1,000 different instruments in anatomic pathology, molecular, microbiology, immunoassay, and more, DI has vastly multiplied the number of parameters it can manage, Marentette says. “We’ve got over 473 data fields that we can use to create very specific rules that are patient- and physician-specific as well as specimen-specific.”
For example, if an instrument is giving a bilirubin result, depending on the hospital, it might be a result on a newborn, a 10-year-old child, or an adult. “Whereas most LISs only handle reference ranges in years, using a middleware product you’re able to drill down to a reference range based on number of hours old, because that parameter can be significant for a newborn from a diagnostic perspective.”
Some LIS companies still use DI for their interface engine for point-to-point interfaces from each new instrument a hospital purchases into their LIS. But when a laboratory purchases Instrument Manager, Marentette notes, “if you switch from, say, a Beckman to a Sysmex hematology instrument, you can simply repurpose the connection you had for the first instrument and move it over to the new one, then just do the editing needed to recognize the codes that are unique to each instrument. It’s really just a tweaking rather than having to recreate the entire interface. So we’ve evolved from connectivity to being able to help labs with productivity and optimizing their workflow.”
These capabilities become particularly important for laboratories dealing with staffing constraints. Some Instrument Manager clients, for example, have 95 percent autoverification of their core chemistry lab results, she says, so those tests go straight into the LIS once released, and then into the HIS for interpretation by the physician.
Many labs are still using LIS autoverification protocols only about 40 percent of the time but could be doing much more, Marentette believes. “People kind of look at it over the short term. There is change management that goes into moving into a middleware product initially. It’s a cost thing, and there’s a knowledge piece, and it takes time to implement and get people to understand how much better off they would be with middleware.”
Focused specialization is what Sysmex’s middleware product WAM (Work Area Management) offers for hematology labs, says Anne Tate, MT(ASCP), IT/automation group manager at Sysmex America. “We concentrate on managing everything around the lavender top.” As a best-of-breed solution, WAM provides hematology-specific rules honed over the past 10 years and now used by more than 300 hematology labs serving 1,100 hospital sites, Tate says.
Sixty percent of Sysmex WAM clients are large integrated health networks, many of which use Sysmex instruments such as the DI-60 and its slidemaker/stainers and sorters, as well as Bio-Rad and Cellavision instruments. “We have instrument lines with one or two instruments on them, up to large systems with two automation lines. So we support both complex and the high-end markets.”
Multisite capability is one of WAM’s key features. “It’s a server-based system, so whatever results you have on site A, you’ll be able to see them on site B. So you can get delta checking and previous results and be able to correlate data from one site to another, but also apply the same standard rules. Doctors and other professionals are assured predictability in how the results are looked at and managed between sites,” Tate says.
She considers middleware as the “production floor” of the lab. “We manage all the results coming out of the instruments, applying rules and logic to either autovalidate to the LIS, or hold up results to do something further such as rerun, reflex, review, or maybe move to another Work Area Manager.”
More and more customers are demanding middleware when they purchase automation, Tate points out, and middleware is increasingly becoming an essential part of the lab. “We’ve always been important. But the LIS really depends on us to manage these combinations and multiple sites because that’s where our expertise is.”
Tate believes LISs have to concentrate on other issues. “LIS vendors really can’t know everything about vendors’ automation and all the changes and parts that go with it. LISs are concentrating their dollars on interfacing more with the EMR and medical necessity and other modules, but they depend on us for decision logic to process results for small to large automation.”
Keeping track of operator competency is another WAM capability. “With our management reports, you can search by user and track almost everything users are doing on the system, with competency based on whatever your criteria are.”
What Sysmex customers most like about the WAM middleware is “they don’t have to look at every result. It automates the process so they are assured that all the logic they would have done manually is being done consistently without a verification.”
At Dartmouth-Hitchcock Medical Center in Lebanon, NH, which includes a main hospital, several clinics, and a network of regional lab partners, Sysmex’s WAM is what allowed the laboratory to bring on the clinics and increase its volume in 2009, says Dorothy Martin, MT(ASCP), hematology supervisor.
The facility started with the Sysmex WAM 3.0, which communicates to Dartmouth-Hitchcock’s Cerner LIS and its Epic HIS. After upgrading to WAM 5.0 in November 2015, “we’ve increased our autovalidation to 87.5 percent, so that’s another 2.5 percent that we can autovalidate. Not only that, but we decreased our manual differential rate. Before, it was a little over four percent, then we brought it down to two percent. Because those manual diffs take longer, that’s less tech time we’re spending at the scope.”“Originally we were sending many tests out to a reference lab because we could not handle the volume, but Sysmex allowed us to expand and then bring on the regional partners. This is helping us to drive cost out of the system for our patients.” Her lab also has middleware for urinalysis and is exploring use of middleware in coagulation testing as a 2017 goal.
The 5.0 version also offers manager reports. “Before, in order to know my autoverification rate, I had to use my Cerner system and pull a number of different reports and export that data into Excel spreadsheets. Now, with a click of a button or two, I can mine all of that data out of my WAM system. We can create reports based on rules, based on our turnaround time, based on technologist. So it’s great. It’s quite amazing.”
Martin works with database coordinator Kari Agan who does the “rules building” and integration work with Cerner. “We actually work with Sysmex to create our rules so they do exactly what we want. We want them customized to be based on critical values in our facility.” For example, “I have different platforms in the main lab than we have in the smaller facilities. I have rules for our hematology-oncology population that are different than rules we would have for a patient who comes in for their primary care visit. WAM allows us that flexibility.”
The WAM has been a key contributor to Dartmouth-Hitchcock’s reputation as an innovator, Martin believes. “We’ve been on this Lean Six Sigma journey for a number of years, and I think that middleware and automation have helped us get to those Lean processes.” The distance among the Lebanon, Nashua, and Manchester laboratories has been a non-issue. “All the labs, even though they are as much as 70 miles apart, are tied into the same middleware on the same server and perform the same way. There’s no issue with networking at long distances and it’s done through the Dartmouth-Hitchcock secure network, so all the patient data is protected.”
With the standardization the middleware has allowed among the technologists, and the growth of the network and technical staff that it has facilitated, “we are really proud of how much Sysmex has helped us improve the processes in our lab,” Martin says.
Kerstin Halverson, point-of-care coordinator for Children’s Hospitals and Clinics of Minnesota, uses Telcor’s QML Data Management and Connectivity Solution to interface five instruments and seven manual device types for the roughly 120,000 POC tests per year, encompassing glucose, hemoglobin, rapid strep, pregnancy, blood gases, and urine dipsticks. “We have Sunquest as our LIS and Cerner as our HIS, and everything point of care flows through Telcor from either a device or via Telcor’s offshoot product called WebMRE for manual result entry.”
She handles most every issue involving the connection between point of care, middleware, and the LIS. “I’m the point person when we have to upgrade servers or add devices. I work pretty specifically with the vendors to make sure everything gets established and connected properly.” Over the years, her lab has gone from having only glucoses and blood gases interfaced to having five device types interfaced, and manual testing is electronically entered now too.
Halverson
Children’s Hospitals and Clinics, with its 2,200 credentialed operators, was the first of Telcor’s customers to go live with an e-learning interface between Telcor and the hospital’s e-learning software, PeopleSoft. “As a piece of this interface, tracking attendance at the annual competency fair that all staff must attend is now done electronically. This allows us to monitor point-of-care testing competency efficiently in one spot,” Halverson says.
This project required considerable lead time. “It was not something we switched on one day. It was probably a three-and-a-half-year project with Telcor to get all my POC courses in a table and then on a daily basis, using PeopleSoft, have that information be updated with all the additions, deletions, department changes, course passing and failing, and so on.” The whole process is now automatic, Halverson says, which is useful for dealing with so many operators over 11 different device types.
In her previous job, more than 13 years ago, “we did not have any middleware,” she notes. “At that time, we had glucometers connected through fax machines, not on the hospital’s network. But results weren’t electronically transferred to charts yet; the nurses would just see results on the device and chart them. There was still a lot of discussion about whether to bill for point of care back then, so some institutions probably did not worry about interfacing and getting things electronically recorded the way things have evolved now.” These days, “IT is one of my major focuses. I can’t do point of care without it.”
In her work as POC coordinator, competency takes a huge chunk of her time—for example, keeping records of diplomas for anyone who is doing moderately complex testing. She says Telcor is working on a way to store those records centrally in its database. “After competency, I would say I spend the most time making sure we’re meeting all the regulations on a daily basis, and by that I mean monitoring QC, making sure the instrumentation is up and functioning properly, and troubleshooting issues.”
A change she has greatly appreciated was moving the Telcor software from a single PC at her desk to a server. “I had two different campuses to travel between, and as much as I try to clone myself, I can’t. So having it moved to a server and having access to the server if I’m somewhere else has been a huge jump forward. I can do troubleshooting pretty much anywhere I need to go now.”
Halverson likens POC to a spiderweb with middleware at the center. “For me, the Telcor middleware ends up being the center of the web to help pull everything into one place where I can manage it. It passes everything along to the LIS, then eventually to the HIS, but it helps cut down on a lot of potential problems by locking people out who aren’t trained and keeping the interfaces up. It’s a one-stop shop.”
Today, some POC devices have their own data-management systems and others don’t, but Telcor is able to interface with them either way, says UPMC’s James Beck. “I can’t say that Telcor makes those systems obsolete. But from my perspective, the fewer systems I need to get into, the easier it is to do what I need to do. Which is basically oversee what’s going on in the system, make sure quality checks are being done, and make sure data is moving through the system and getting to the end users. The fewer systems there are for that data, the more likely the data is going to end up on the chart so that clinical decisions can be made on it.”
Most devices, he has found, are interfaceable through Telcor, which is installed in about 1,900 U.S. and Canadian hospitals. UPMC uses Abbott’s Precision Xceed Pro for glucose, and has seen unprecedented growth in the number of tests it conducts using Abbott i-Stat in the past nine months. The connectivity issues have been for the most part already resolved—“we have just been adding a lot more tests to the menu.”
The ABL blood gas analyzers, Beck says, are considered by many to be laboratory instruments, not point-of-care devices, because they are tabletops. But “this is another example of Telcor flexibility, because before, many of the instruments were being run by respiratory therapists and they had a hard time internalizing how to use that lab interface. They didn’t get enough repeat experience with it, the way a lab person would, and the standard lab interface was really failing them. They could not seem to get the hang of it as far as the flow of data.”Siemens’ Clinitek automatically uploads standard urinalysis dipstick and urine hCG testing results to Telcor and in turn to the EMR, Beck says. “So a person who is multitasking does not have to stay there. They can load up a device and walk away and know that the result is going to automatically upload.” Similarly, Accriva’s Hemochron Signature Elite is used for activated clotting time, and Avoximeter 1000E, another Accriva device, is used for co-oximetry testing and cardiac catheterization labs. Both also connect to Telcor.
Beck approached Telcor about taking over the interface, and the company appointed a dedicated analyst to work it out. “Then our next hurdle was actually to convince the LIS folks to allow us to do it. I said, ‘I can make life so much easier for these respiratory therapists if we can send the information through a middleware system like Telcor as opposed to a standard lab interface, which is full of rules and things to remember. I can cut 20-plus steps and mouse clicks and verifications out of their process.’ So it took a lot of convincing but finally they said, okay, go ahead and try it. And that actually got us a patient safety award for our facility improvement process. It was copied at other hospitals within our health system because they had the same dilemmas and we had a proven model that worked.”
There has been downtime, he says, but not due to the middleware. “Recently, our centralized information support actually disconnected our Telcor server so it stopped transmission unexpectedly. It ended up getting reported by our ED where a nurse was doing a urine dip and knew it should have crossed by a certain amount of time.” So temporarily, no data were moving.
But, he says, “The beauty of the computer age is that everything is basically held in a buffer so there’s no data loss. Everything performed during a downtime does get captured ultimately.” However, with one system processing information from 19 hospitals, catching up can take quite a while. “In fact, one of the things we requested was that they expand memory so the catch-up is quicker when there is some backlog of processing that needs to be done.”
Some operators are actually physicians—typically anesthesiologists—and Beck has found there is better appreciation among physicians generally about middleware. “Definitely five or 10 years ago, they could afford to be more distant from middleware awareness, but now they are aware in making sure the data gets to the chart.”
It’s a good thing, too, because point of care is growing. In fact, “we’re seeing explosions in point of care that are often exceeding the ability of one person to oversee.” For this reason, Beck is pleased that his middleware vendor is able to keep pace with the state of technology and even stay one step ahead. Middleware capability like that has become necessary, he says.
The potential customer base for middleware is wide-ranging, says Data Innovations’ Marentette. DI has diverse customers that include the Department of Defense and Department of Veterans Affairs, large academic health science centers, and reference labs. But the company is finding a market as well in smaller and midrange hospitals, which are increasingly looking at DI’s productivity and quality suite modules and its “management through metrics” data mining.
On the quality assurance side, Marentette points to Instrument Manager’s “moving averages” program which helps monitor how instruments are performing between quality control challenges. “If there is a problem when the moving averages go out, you can first of all stop testing and prevent those results from being released to the LIS. Therefore you have fewer edited reports. That really helps on the quality side. And using our specimen management workspace for autoverification, you can put in instructions on what to do when a particular value comes up.”The data mining involves pulling data out of the specimen management database to conduct population or research studies. “We’ve now added our laboratory intelligence, which enables real-time metrics monitoring, so you can look at what’s going on in your lab five minutes ago, identify issues, and drill down to what the challenge is.”
Middleware’s return on investment is twofold, Marentette believes. “It’s not just within the lab itself, but also what it means to the rest of the hospital organization and the ability to enhance the patient experience. For example, quicker turnaround time on tests for the emergency department lets physicians make faster patient diagnostic decisions, bringing better patient experience and contributing to the overall revenue of the organization. Then, within the lab itself, if you are using the autoverification, you can redeploy your staff and take on more work by bringing on new tests or doing some of the centralized testing you maybe sent to another lab before.”
Through its JResultNet software, which DI purchased from Dawning Technologies more than two years ago, the same middleware benefits are available to physician office labs, and Laboratory Production Manager is DI’s parallel product in the European marketplace. DI itself was acquired in 2015 by Roper Technologies, which also owns LIS giant Sunquest Information Systems. But DI is still a standalone company, Marentette emphasizes, noting that a range of LISs (including Epic’s Beaker) as well as IVD manufacturers use Instrument Manager as their connectivity and middleware solution.
Instrument Manager’s usefulness also becomes apparent when hospitals or integrated delivery networks do acquisitions. “We have the ability to interface multiple LISs into the same IM database, so if a hospital acquires another hospital and wants to put things together on the same system, you can do that seamlessly through one of our interfaces. The middleware is able to keep orders and results reporting management straight between systems. So it does make consolidation much simpler and streamlined.”
With the changing configuration of IT in health care, Sysmex’s Anne Tate sees a changing role for middleware ahead. “WAM provides everything the LIS needs to report immediately to the EMR. In some instances, we’re seeing where the WAM can go into clinics or small labs that don’t have an LIS, so eventually we may have to connect the WAM directly to the EMR. We’ve never done it yet, but we’re seeing movement in that respect.” She doesn’t expect it in the hospital environment. “But in standalone clinics, in nontraditional or non-hospital–supported environments, I do see it happening. We’ve already had requests for that.”
Middleware does come with a cost, but customers understand middleware’s value, Tate says. “We don’t get much pushback anymore on the cost of middleware because they see the value and return on investment: They’ll get vastly improved turnaround time, they can reallocate FTEs, and they get standardized results and less error.”
The image sensor of the wavelength scanning super-resolution apparatus collects a “stack” of images of the sample (credit: Ozcan Lab)
Researchers from the California NanoSystems Institute at UCLA have created a new technique using lens-free holograms that greatly enhances digital microscopy images, which are sometimes blurry and pixelated.
The new technique, called “wavelength scanning pixel super-resolution,” uses a device that captures a stack of digital images of the same specimen, each with a slightly different wavelength of light. Then, researchers apply a newly devised algorithm that divides the pixels in each captured image into a number of smaller pixels, resulting in a much higher-resolution digital image of the specimen.
The research team was led by Aydogan Ozcan, Chancellor’s Professor of Electrical Engineering and Bioengineering at the UCLA Henry Samueli School of Engineering and Applied Science. The study appears in an open-access paperin the journal Light: Science and Applications, published by the Nature Publishing Group.
“These results mean we can see and inspect large samples with finer details at the sub-micron [nanoscale] level,” Ozcan said. “We have applied this method to lens-based conventional microscopes, as well as our lensless on-chip microscopy systems that create microscopic images using holograms, and it works across all these platforms.”
The benefits of this new method are wide-ranging, but especially significant in pathology, where rapid microscopic imaging of large numbers of tissue or blood cells is key to diagnosing diseases such as cancer. The specimens used in the study were blood samples, used to screen for various diseases, and Papanicolaou tests, which are used to screen for cervical cancer.
Ozcan said that wavelength scanning super-resolution works on both colorless and dye-stained samples. The entire apparatus fits on a desktop, so its size and convenience could be of great benefit to doctors and scientists using microscopes in resource-limited settings such as clinics in developing countries.
The research was supported by the Presidential Early Career Award for Scientists and Engineers, the Army Research Office, the National Science Foundation, the Office of Naval Research and the Howard Hughes Medical Institute.
Abstract of Pixel super-resolution using wavelength scanning
Undersampling and pixelation affect a number of imaging systems, limiting the resolution of the acquired images, which becomes particularly significant for wide-field microscopy applications. Various super-resolution techniques have been implemented to mitigate this resolution loss by utilizing sub-pixel displacements in the imaging system, achieved, for example, by shifting the illumination source, the sensor-array and/or the sample, followed by digital synthesis of a smaller effective pixel by merging these subpixel-shifted low-resolution images. Herein, we introduce a new pixel super-resolution method that is based on wavelength scanning and demonstrate that as an alternative to physical shifting/displacements, wavelength diversity can be used to boost the resolution of a wide-field imaging system and significantly increase its space-bandwidth product. We confirmed the effectiveness of this new technique by improving the resolution of lens-free as well as lens-based microscopy systems and developed an iterative algorithm to generate high-resolution reconstructions of a specimen using undersampled diffraction patterns recorded at a few wavelengths covering a narrow spectrum (10-30 nm). When combined with a synthetic-aperture-based diffraction imaging technique, this wavelength-scanning super-resolution approach can achieve a half-pitch resolution of 250 nm, corresponding to a numerical aperture of approximately 1.0, across a large field of view (>20 mm2 ). We also demonstrated the effectiveness of this approach by imaging various biological samples, including blood and Papanicolaou smears. Compared with displacement-based super-resolution techniques, wavelength scanning brings uniform resolution improvement in all directions across a sensor array and requires significantly fewer measurements. This technique would broadly benefit wide-field imaging applications that demand larger space-bandwidth products.
3.3.11 Unlocking the Microbiome, Volume 2 (Volume Two: Latest in Genomics Methodologies for Therapeutics: Gene Editing, NGS and BioInformatics, Simulations and the Genome Ontology), Part 2: CRISPR for Gene Editing and DNA Repair
Machine-learning technique uncovers unknown features of multi-drug-resistant pathogen
Relatively simple “unsupervised” learning system reveals important new information to microbiologists
According to the CDC, Pseudomonas aeruginosa is a common cause of healthcare-associated infections, including pneumonia, bloodstream infections, urinary tract infections, and surgical site infections. Some strains of P. aeruginosa have been found to be resistant to nearly all or all antibiotics. (illustration credit: CDC)
A new machine-learning technique can uncover previously unknown features of organisms and their genes in large datasets, according to researchers from the Perelman School of Medicine at the University of Pennsylvania and the Geisel School of Medicine at Dartmouth University.
For example, the technique learned to identify the characteristic gene-expression patterns that appear when a bacterium is exposed in different conditions, such as low oxygen and the presence of antibiotics.
The technique, called “ADAGE” (Analysis using Denoising Autoencoders of Gene Expression), uses a “denoising autoencoder” algorithm, which learns to identify recurring features or patterns in large datasets — without being told what specific features to look for (that is, “unsupervised.”)*
Last year, Casey Greene, PhD, an assistant professor of Systems Pharmacology and Translational Therapeutics at Penn, and his team published, in an open-access paper in the American Society for Microbiology’s mSystems, the first demonstration of ADAGE in a biological context: an analysis of two gene-expression datasets of breast cancers.
Tracking down gene patterns of a multi-drug-resistant bacterium
The new study, published Jan. 19 in an open-access paper in mSystems, was more ambitious. It applied ADAGE to a dataset of 950 gene-expression arrays publicly available at the time for the multi-drug-resistant bacteriumPseudomonas aeruginosa. This bacterium is a notorious pathogen in the hospital and in individuals with cystic fibrosis and other chronic lung conditions; it’s often difficult to treat due to its high resistance to standard antibiotic therapies.
The data included only the identities of the roughly 5,000 P. aeruginosa genes and their measured expression levels in each published experiment. The goal was to see if this “unsupervised” learning system could uncover important patterns in P. aeruginosa gene expression and clarify how those patterns change when the bacterium’s environment changes — for example, when in the presence of an antibiotic.
Even though the model built with ADAGE was relatively simple — roughly equivalent to a brain with only a few dozen neurons — it had no trouble learning which sets of P. aeruginosa genes tend to work together or in opposition. To the researchers’ surprise, the ADAGE system also detected differences between the main laboratory strain of P. aeruginosa and strains isolated from infected patients. “That turned out to be one of the strongest features of the data,” Greene said.
“We expect that this approach will be particularly useful to microbiologists researching bacterial species that lack a decades-long history of study in the lab,” said Greene. “Microbiologists can use these models to identify where the data agree with their own knowledge and where the data seem to be pointing in a different direction … and to find completely new things in biology that we didn’t even know to look for.”
Support for the research came from the Gordon and Betty Moore Foundation, the William H. Neukom Institute for Computational Science, the National Institutes of Health, and the Cystic Fibrosis Foundation.
* In 2012, Google-sponsored researchers applied a similar method to randomly selected YouTube images; their system learned to recognize major recurring features of those images — including cats of course.
Abstract of ADAGE-Based Integration of Publicly Available Pseudomonas aeruginosa Gene Expression Data with Denoising Autoencoders Illuminates Microbe-Host Interactions
The increasing number of genome-wide assays of gene expression available from public databases presents opportunities for computational methods that facilitate hypothesis generation and biological interpretation of these data. We present an unsupervised machine learning approach, ADAGE (analysis using denoising autoencoders of gene expression), and apply it to the publicly available gene expression data compendium for Pseudomonas aeruginosa. In this approach, the machine-learned ADAGE model contained 50 nodes which we predicted would correspond to gene expression patterns across the gene expression compendium. While no biological knowledge was used during model construction, cooperonic genes had similar weights across nodes, and genes with similar weights across nodes were significantly more likely to share KEGG pathways. By analyzing newly generated and previously published microarray and transcriptome sequencing data, the ADAGE model identified differences between strains, modeled the cellular response to low oxygen, and predicted the involvement of biological processes based on low-level gene expression differences. ADAGE compared favorably with traditional principal component analysis and independent component analysis approaches in its ability to extract validated patterns, and based on our analyses, we propose that these approaches differ in the types of patterns they preferentially identify. We provide the ADAGE model with analysis of all publicly available P. aeruginosa GeneChip experiments and open source code for use with other species and settings. Extraction of consistent patterns across large-scale collections of genomic data using methods like ADAGE provides the opportunity to identify general principles and biologically important patterns in microbial biology. This approach will be particularly useful in less-well-studied microbial species.
Abstract of Unsupervised feature construction and knowledge extraction from genome-wide assays of breast cancer with denoising autoencoders
Big data bring new opportunities for methods that efficiently summarize and automatically extract knowledge from such compendia. While both supervised learning algorithms and unsupervised clustering algorithms have been successfully applied to biological data, they are either dependent on known biology or limited to discerning the most significant signals in the data. Here we present denoising autoencoders (DAs), which employ a data-defined learning objective independent of known biology, as a method to identify and extract complex patterns from genomic data. We evaluate the performance of DAs by applying them to a large collection of breast cancer gene expression data. Results show that DAs successfully construct features that contain both clinical and molecular information. There are features that represent tumor or normal samples, estrogen receptor (ER) status, and molecular subtypes. Features constructed by the autoencoder generalize to an independent dataset collected using a distinct experimental platform. By integrating data from ENCODE for feature interpretation, we discover a feature representing ER status through association with key transcription factors in breast cancer. We also identify a feature highly predictive of patient survival and it is enriched by FOXM1 signaling pathway. The features constructed by DAs are often bimodally distributed with one peak near zero and another near one, which facilitates discretization. In summary, we demonstrate that DAs effectively extract key biological principles from gene expression data and summarize them into constructed features with convenient properties.
Agilent was created as a spin off from Hewlett-Packard Company in 1999.
Agilent Technologies Inc. is engaged in the life sciences, diagnostics and applied chemical markets. The Company provides application focused solutions that include instruments, software, services and consumables for the entire laboratory workflow. The Company has three business segments:
the life sciences and applied markets business,
the diagnostics and genomics business, and
the Agilent Cross Lab business
The Company’s life sciences and applied markets business segment brings together the Company’s analytical laboratory instrumentation and informatics.
The Company’s diagnostics and genomics business segment consists of three businesses: the Dako business, the genomics business and the nucleic acid solutions business.
The Company’s Agilent Cross Lab business segment combines its analytical laboratory services and consumables business
CARPINTERIA, Calif.–(BUSINESS WIRE)–Dako, an Agilent Technologies company and a worldwide provider of cancer diagnostics, today announced the U.S. Food and Drug Administration has approved a new test that can identify PD-L1 expression levels on the surface of non-small cell lung cancer tumor cells and provide information on the survival benefit with OPDIVO® (nivolumab) for patients with non-squamous NSCLC.
Argentina | Australia | Austria | Brazil | Canada |Chile | China | Colombia | Czech Republic | Denmark | Ecuador | Finland | Germany |Hong Kong | Israel | Italy | Japan | Korea | Malaysia | Mexico | New Zealand | Norway | Paraguay | Peru| Philippines | Poland | Romania | Singapore | South Africa | Spain | Sweden |Switzerland | Taiwan ROC | Thailand | Turkey | United Kingdom | Uruguay | Vietnam
Gen9 is building on advances in synthetic biology to power a scalable fabrication capability that will significantly increase the world’s capacity to produce DNA content. The privately held company’s next-generation gene synthesis technology allows for the high-throughput, automated production of DNA constructs at lower cost and higher accuracy than previous methods on the market. Founded by world leaders in synthetic biology, Gen9 aims to ensure the constructive application of synthetic biology in industries ranging from enzyme and chemical production to pharmaceuticals and biofuels.
SERVICES
Synthetic Biology
Gene Synthesis Services
Variant Libraries
Gene Sequence Design Services
INVESTORS
Agilent Technologies : Private Equity
CAMBRIDGE, Mass. and SANTA CLARA, Calif. — April 24, 2013 —Gen9 Receives $21 Million Strategic Investment from Agilent Technologies
GenScript is the largest gene synthesis provider in the USA
GenScript Corporation, a biology contract research organization, provides biological research and drug discovery services to pharmaceutical companies, biotech firms, and research institutions in the United States, Europe, and Japan. It offers bio-reagent, custom molecular biology, custom peptide, protein production, custom antibody production, drug candidates testing, assay development and screening, lead optimization, antibody drug development, gene synthesis, and assay-ready cell line production services.
The company also offers molecular biology, peptide, protein, immunoassay, chemicals, and cell biology products. It offers its products through distributors in Tokyo, Japan; and Seoul, Korea. GenScript Corporation has a strategic partnership with Immunologix, Inc. The company was founded in 2002 and is based in Piscataway, New Jersey. It has subsidiaries in France, Japan, and China.
Note: As of October 24, 2011, Immunologix, Inc. was acquired by Intrexon Corporation. Immunologix, Inc. develops and produces antibody-based therapeutics for various biological targets. It produces human monoclonal antibodies against viral, bacterial, and tumor antigens, as well as human auto antigens.
Intrexon Corporation, founded in 1998, is a leader in synthetic biology focused on collaborating with companies in Health, Food, Energy, Environment and Consumer sectors to create biologically based products that improve quality of life and the health of the planet.
PRODUCTS AND SERVICES
Gene synthesis
Antibody services
Protein Services
Peptide services
INVESTORS
Note: The Balloch Group (‘TBG’) was established in 2001 by Howard Balloch (Canada‘s ambassador to China from 1996 to 2001). TBG has since grown from a market-entry consultancy working with North American clients in China to a leading advisory and merchant banking firm serving both domestic Chinese companies and multinational corporations. TBG was ranked as the number one boutique investment bank in China by ChinaVenture in 2008.
Monica Heger : SAN FRANCISCO (GenomeWeb) – Illumina today announced two new next-generation sequencing platforms, a targeted sequencing system called MiniSeq and a semiconductor sequencer that is still under development.
Illumina disclosed the initiatives during a presentation at the JP Morgan Healthcare conference held here today. During the presentation, Illumina CEO Jay Flatley also announced a new genotyping array called Infinium XT; a partnership with Bio-Rad to develop a single-cell sequencing workflow; preliminary estimates of its fourth-quarter 2015 revenues; and an update on existing products. The presentation followed the company’s announcement on Sunday that it has launched a new company called Grail to develop a next-generation sequencing test for early cancer detection from patient blood samples.
The MiniSeq system, which is based on Illumina’s current sequencing technology, will begin shipping early this quarter and has a list price of $49,500. It can perform a variety of targeted DNA and RNA applications, from single-gene to pathway sequencing, and promises “all-in” prices, including library prep and sequencing, of $200 to $300 per sample, Flatley said during the JP Morgan presentation.
Integrated DNA Technologies, Inc. (IDT), the global leader in nucleic acid synthesis, serving all areas of life sciences research and development, offers products for a broad range of genomics applications. IDT’s primary business is the production of custom, synthetic nucleic acids for molecular biology applications, including qPCR, sequencing, synthetic biology, and functional genomics. The company manufactures and ships an average of 44,000 custom nucleic acids per day to more than 82,000 customers worldwide. For more information, visit idtdna.com.
Dyes GMP for Molecular Diagnostics Large Scale Oligo Synthesis
Note : Skokie, IL – December 1, 2015. Integrated DNA Technologies Inc. (“IDT”), the global leader in custom nucleic acid synthesis, has entered into a definitive agreement to acquire the oligonucleotide synthesis business of AITbiotech Pte. Ltd. in Singapore (“AITbiotech”). With this acquisition, IDT expands its customer base across Southeast Asia making it possible for these additional customers to now have access to its broad range of products for genomic applications. AITbiotech will continue operations in its other core business areas.
With over 20 years of experience in oligonucleotide development and production, and over 1000 sequences manufactured, Avecia has played an integral role in the advancing oligo therapeutic market. Our mission is to continue to build value for our customers, as they progress through drug development into commercialization. And as a member of the Nitto Denko Corporation (nitto.com), Avecia is committed to the future of the oligonucleotide market. We are driven by innovative ideas and flexible solutions, designed to provide our customers with the best in service, quality, and technology.
OriGene Technologies, Inc. develops, manufactures, and sells genome wide research and diagnostic products for pharmaceutical, biotechnology, and academic research applications. The company offers cDNA clones, including TrueORF cDNA, viral ORF, destination vectors, TrueClones (human), TrueClones (mouse), organelle marker plasmids, MicroRNA tools, mutant and variant clones, plasmid purification kits, transfection reagents, and gene synthesis service; and HuSH shRNA, siRNA, miRNA, qPCR reagents, plasmid purification products, transfection reagents, PolyA+ and total RNA products, first-strand cDNA synthesis, and CRISPR/Cas9 genome products. It also provides proteins and lysates, such as purified human proteins, over-expression cell lysates, mass spectrometry standard proteins, and protein purification reagents; UltraMAB IHC antibodies, TrueMAB primary antibodies, anti-tag and fluorescent proteins, ELISA antibodies, luminex antibodies, secondary antibodies, and controls and others; and anatomic pathology products, including IHC antibodies, detection systems, and IHC accessories
The company offers luminex and ELISA antibody pairs, autoantibody profiling arrays, ELISA kits, cell assay kits, assay reagents, custom development, and fluorogenic cell assays; TissueFocus search tools; tissue sections; tissue microarrays, cancer protein lysate arrays, TissueScan cDNA arrays, tissue blocks, and quality control products, as well as tissue RNA, DNA, and protein lysates; and lab essentials. Its research areas include cancer biomarker research, RNAi, pathology IHC, stem cell research, ion channels, and protein kinase products. The company provides gene synthesis and molecular biology services, genome editing, custom cloning, custom shRNA, purified protein, monoclonal antibody development, and assay development. It sells its products through distributors worldwide, as well as online. OriGene Technologies, Inc. was incorporated in 1995 and is based in Rockville, Maryland.
Louis, MO – November 18, 2015 Merck KGaA, Darmstadt, Germany, Completes Sigma-Aldrich Acquisition
Merck KGaA today announced the completion of its $17 billion acquisition of Sigma-Aldrich, creating one of the leaders in the $130 billion global industry to help solve the toughest problems in life science.
Press Release: 18-Nov-2015
Letter to our Life Science Customers from Dr. Udit Batra
The life science business of Merck KGaA, Darmstadt, Germany brings together the world-class products and services, innovative capabilities and exceptional talent of EMD Millipore and Sigma-Aldrich to create a global leader in the life science industry.
“Everything we do starts with our shared purpose – to solve the toughest problems in life science by collaborating with the global scientific community.
This combination is built on complementary strengths, which will enable us to serve you even better as one organization than either company could alone.
This means providing a broader portfolio with a catalog of more than 300,000 products, including many of the most respected brands in the industry, greater geographic reach, and an unmatched combination of industry-leading capabilities.”
Thermo Fisher Scientific Inc. is a provider of analytical instruments, equipment, reagents and consumables, software and services for research, manufacturing, analysis, discovery and diagnostics. The company operates through four segments: Life Sciences Solutions, provides reagents, instruments and consumables used in biological and medical research, discovery and production of new drugs and vaccines as well as diagnosis of disease; Analytical Instruments, provides instruments, consumables, software and services that are used in the laboratory; Specialty Diagnostics, offers diagnostic test kits, reagents, culture media, instruments and associated products, and Laboratory Products and Services, offers self-manufactured and sourced products for the laboratory.
WALTHAM, Mass. & SANTA CLARA, Calif.–(BUSINESS WIRE)–Jan. 8, 2016– Thermo Fisher Scientific Inc. (NYSE:TMO), the world leader in serving science, and Affymetrix Inc. (NASDAQ:AFFX), a leading provider of cellular and genetic analysis products, today announced that their boards of directors have unanimously approved Thermo Fisher’s acquisition of Affymetrix for $14.00 per share in cash. The transaction represents a purchase price of approximately $1.3 billion.





 2012pharmaceutical
 sjwilliamspa