Feeds:
Posts
Comments

Archive for the ‘Uncategorized’ Category

Reported by Dror Nir, PhD

3.3.22

3.3.22   Deep Learning–Assisted Diagnosis of Cerebral Aneurysms, Volume 2 (Volume Two: Latest in Genomics Methodologies for Therapeutics: Gene Editing, NGS and BioInformatics, Simulations and the Genome Ontology), Part 2: CRISPR for Gene Editing and DNA Repair

Deep Learning–Assisted Diagnosis of Cerebral Aneurysms Using the HeadXNet Model

Allison Park, BA1Chris Chute, BS1Pranav Rajpurkar, MS1;  et al, Original Investigation, Health Informatics, June 7, 2019, JAMA Netw Open. 2019;2(6):e195600. doi:10.1001/jamanetworkopen.2019.5600

Key Points

Question  How does augmentation with a deep learning segmentation model influence the performance of clinicians in identifying intracranial aneurysms from computed tomographic angiography examinations?

Findings  In this diagnostic study of intracranial aneurysms, a test set of 115 examinations was reviewed once with model augmentation and once without in a randomized order by 8 clinicians. The clinicians showed significant increases in sensitivity, accuracy, and interrater agreement when augmented with neural network model–generated segmentations.

Meaning  This study suggests that the performance of clinicians in the detection of intracranial aneurysms can be improved by augmentation using deep learning segmentation models.

Abstract

Importance  Deep learning has the potential to augment clinician performance in medical imaging interpretation and reduce time to diagnosis through automated segmentation. Few studies to date have explored this topic.

Objective  To develop and apply a neural network segmentation model (the HeadXNet model) capable of generating precise voxel-by-voxel predictions of intracranial aneurysms on head computed tomographic angiography (CTA) imaging to augment clinicians’ intracranial aneurysm diagnostic performance.

Design, Setting, and Participants  In this diagnostic study, a 3-dimensional convolutional neural network architecture was developed using a training set of 611 head CTA examinations to generate aneurysm segmentations. Segmentation outputs from this support model on a test set of 115 examinations were provided to clinicians. Between August 13, 2018, and October 4, 2018, 8 clinicians diagnosed the presence of aneurysm on the test set, both with and without model augmentation, in a crossover design using randomized order and a 14-day washout period. Head and neck examinations performed between January 3, 2003, and May 31, 2017, at a single academic medical center were used to train, validate, and test the model. Examinations positive for aneurysm had at least 1 clinically significant, nonruptured intracranial aneurysm. Examinations with hemorrhage, ruptured aneurysm, posttraumatic or infectious pseudoaneurysm, arteriovenous malformation, surgical clips, coils, catheters, or other surgical hardware were excluded. All other CTA examinations were considered controls.

Main Outcomes and Measures  Sensitivity, specificity, accuracy, time, and interrater agreement were measured. Metrics for clinician performance with and without model augmentation were compared.

Results  The data set contained 818 examinations from 662 unique patients with 328 CTA examinations (40.1%) containing at least 1 intracranial aneurysm and 490 examinations (59.9%) without intracranial aneurysms. The 8 clinicians reading the test set ranged in experience from 2 to 12 years. Augmenting clinicians with artificial intelligence–produced segmentation predictions resulted in clinicians achieving statistically significant improvements in sensitivity, accuracy, and interrater agreement when compared with no augmentation. The clinicians’ mean sensitivity increased by 0.059 (95% CI, 0.028-0.091; adjusted P = .01), mean accuracy increased by 0.038 (95% CI, 0.014-0.062; adjusted P = .02), and mean interrater agreement (Fleiss κ) increased by 0.060, from 0.799 to 0.859 (adjusted P = .05). There was no statistically significant change in mean specificity (0.016; 95% CI, −0.010 to 0.041; adjusted P = .16) and time to diagnosis (5.71 seconds; 95% CI, 7.22-18.63 seconds; adjusted P = .19).

Conclusions and Relevance  The deep learning model developed successfully detected clinically significant intracranial aneurysms on CTA. This suggests that integration of an artificial intelligence–assisted diagnostic model may augment clinician performance with dependable and accurate predictions and thereby optimize patient care.

Introduction

Diagnosis of unruptured aneurysms is a critically important clinical task: intracranial aneurysms occur in 1% to 3% of the population and account for more than 80% of nontraumatic life-threatening subarachnoid hemorrhages.1 Computed tomographic angiography (CTA) is the primary, minimally invasive imaging modality currently used for diagnosis, surveillance, and presurgical planning of intracranial aneurysms,2,3but interpretation is time consuming even for subspecialty-trained neuroradiologists. Low interrater agreement poses an additional challenge for reliable diagnosis.47

Deep learning has recently shown significant potential in accurately performing diagnostic tasks on medical imaging.8 Specifically, convolutional neural networks (CNNs) have demonstrated excellent performance on a range of visual tasks, including medical image analysis.9 Moreover, the ability of deep learning systems to augment clinician workflow remains relatively unexplored.10 The development of an accurate deep learning model to help clinicians reliably identify clinically significant aneurysms in CTA has the potential to provide radiologists, neurosurgeons, and other clinicians an easily accessible and immediately applicable diagnostic support tool.

In this study, a deep learning model to automatically detect intracranial aneurysms on CTA and produce segmentations specifying regions of interest was developed to assist clinicians in the interpretation of CTA examinations for the diagnosis of intracranial aneurysms. Sensitivity, specificity, accuracy, time to diagnosis, and interrater agreement for clinicians with and without model augmentation were compared.

Methods

The Stanford University institutional review board approved this study. Owing to the retrospective nature of the study, patient consent or assent was waived. The Standards for Reporting of Diagnostic Accuracy (STARD) reporting guideline was used for the reporting of this study.

Data

A total of 9455 consecutive CTA examination reports of the head or head and neck performed between January 3, 2003, and May 31, 2017, at Stanford University Medical Center were retrospectively reviewed. Examinations with parenchymal hemorrhage, subarachnoid hemorrhage, posttraumatic or infectious pseudoaneurysm, arteriovenous malformation, ischemic stroke, nonspecific or chronic vascular findings such as intracranial atherosclerosis or other vasculopathies, surgical clips, coils, catheters, or other surgical hardware were excluded. Examinations of injuries that resulted from trauma or contained images degraded by motion were also excluded on visual review by a board-certified neuroradiologist with 12 years of experience. Examinations with nonruptured clinically significant aneurysms (>3 mm) were included.11

Radiologist Annotations

The reference standard for all examinations in the test set was determined by a board-certified neuroradiologist at a large academic practice with 12 years of experience who determined the presence of aneurysm by review of the original radiology report, double review of the CTA examination, and further confirmation of the aneurysm by diagnostic cerebral angiograms, if available. The neuroradiologist had access to all of the Digital Imaging and Communications in Medicine (DICOM) series, original reports, and clinical histories, as well as previous and follow-up examinations during interpretation to establish the best possible reference standard for the labels. For each of the aneurysm examinations, the radiologist also identified the location of each of the aneurysms. Using the open-source annotation software ITK-SNAP,12 the identified aneurysms were manually segmented on each slice.

Model Development

In this study, we developed a 3-dimensional (3-D) CNN called HeadXNet for segmentation of intracranial aneurysms from CT scans. Neural networks are functions with parameters structured as a sequence of layers to learn different levels of abstraction. Convolutional neural networks are a type of neural network designed to process image data, and 3-D CNNs are particularly well suited to handle sequences of images, or volumes.

HeadXNet is a CNN with an encoder-decoder structure (eFigure 1 in the Supplement), where the encoder maps a volume to an abstract low-resolution encoding, and the decoder expands this encoding to a full-resolution segmentation volume. The segmentation volume is of the same size as the corresponding study and specifies the probability of aneurysm for each voxel, which is the atomic unit of a 3-D volume, analogous to a pixel in a 2-D image. The encoder is adapted from a 50-layer SE-ResNeXt network,1315and the decoder is a sequence of 3 × 3 transposed convolutions. Similar to UNet,16 skip connections are used in 3 layers of the encoder to transmit outputs directly to the decoder. The encoder was pretrained on the Kinetics-600 data set,17 a large collection of YouTube videos labeled with human actions; after pretraining the encoder, the final 3 convolutional blocks and the 600-way softmax output layer were removed. In their place, an atrous spatial pyramid pooling18 layer and the decoder were added.

Training Procedure

Subvolumes of 16 slices were randomly sampled from volumes during training. The data set was preprocessed to find contours of the skull, and each volume was cropped around the skull in the axial plane before resizing each slice to 208 × 208 pixels. The slices were then cropped to 192 × 192 pixels (using random crops during training and centered crops during testing), resulting in a final input of size 16 × 192 × 192 per example; the same transformations were applied to the segmentation label. The segmentation output was trained to optimize a weighted combination of the voxelwise binary cross-entropy and Dice losses.19

Before reaching the model, inputs were clipped to [−300, 700] Hounsfield units, normalized to [−1, 1], and zero-centered. The model was trained on 3 Titan Xp graphical processing units (GPUs) (NVIDIA) using a minibatch of 2 examples per GPU. The parameters of the model were optimized using a stochastic gradient descent optimizer with momentum of 0.9 and a peak learning rate of 0.1 for randomly initialized weights and 0.01 for pretrained weights. The learning rate was scheduled with a linear warm-up from 0 to the peak learning rate for 10 000 iterations, followed by cosine annealing20 over 300 000 iterations. Additionally, the learning rate was fixed at 0 for the first 10 000 iterations for the pretrained encoder. For regularization, L2 weight decay of 0.001 was added to the loss for all trainable parameters and stochastic depth dropout21 was used in the encoder blocks. Standard dropout was not used.

To control for class imbalance, 3 methods were used. First, an auxiliary loss was added after the encoder and focal loss was used to encourage larger parameter updates on misclassified positive examples. Second, abnormal training examples were sampled more frequently than normal examples such that abnormal examples made up 30% of training iterations. Third, parameters of the decoder were not updated on training iterations where the segmentation label consisted of purely background (normal) voxels.

To produce a segmentation prediction for the entire volume, the segmentation outputs for sequential 16-slice subvolumes were simply concatenated. If the number of slices was not divisible by 16, the last input volume was padded with 0s and the corresponding output volume was truncated back to the original size.

Study Design

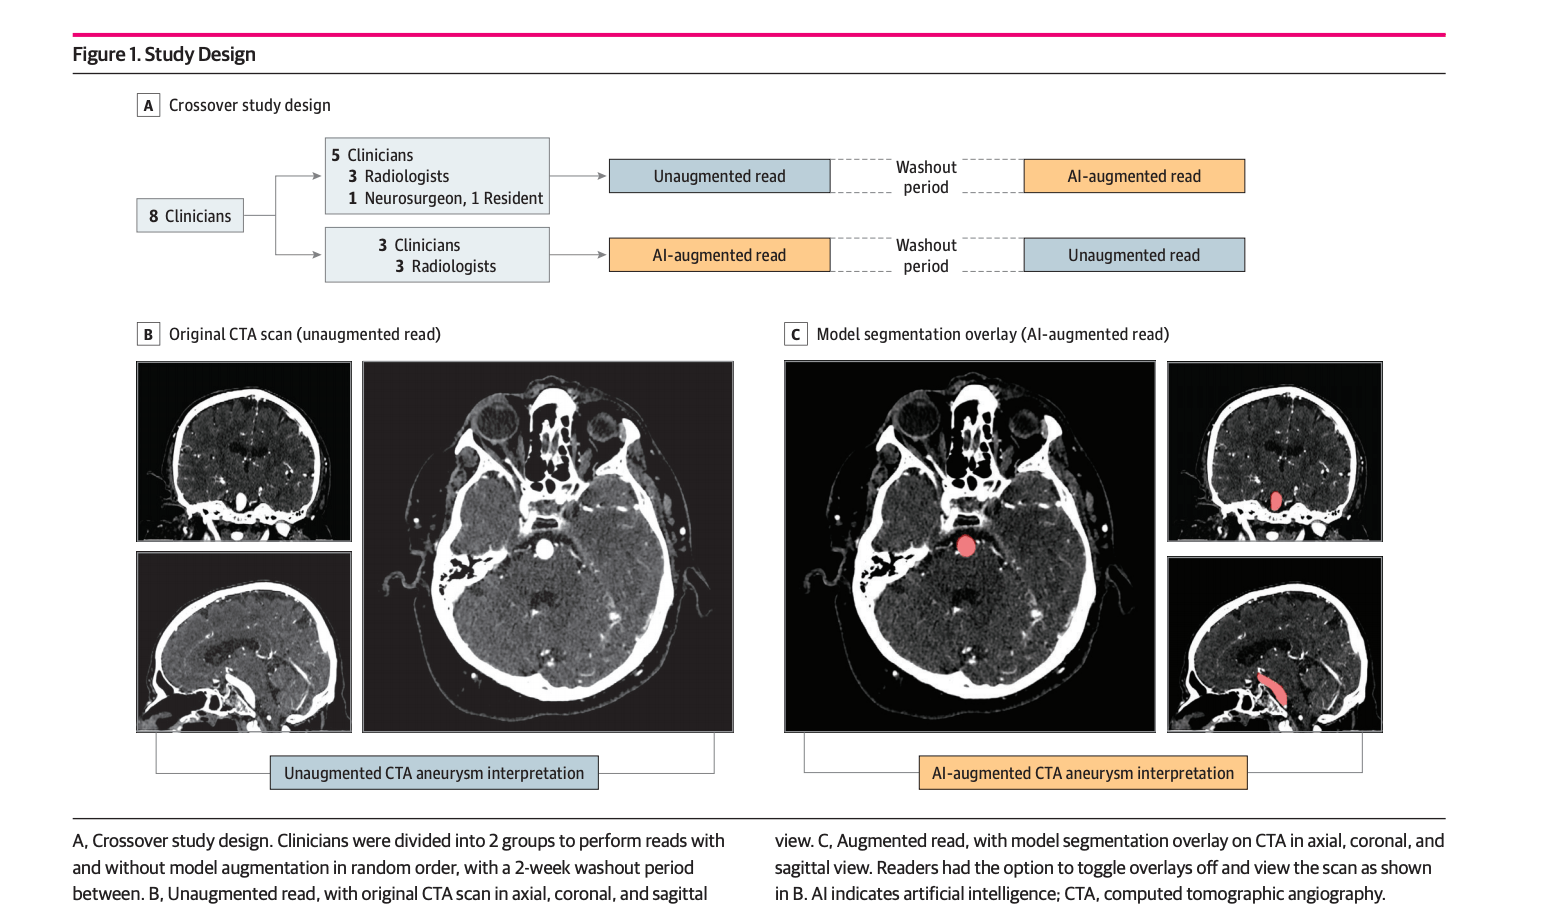
We performed a diagnostic accuracy study comparing performance metrics of clinicians with and without model augmentation. Each of the 8 clinicians participating in the study diagnosed a test set of 115 examinations, once with and once without assistance of the model. The clinicians were blinded to the original reports, clinical histories, and follow-up imaging examinations. Using a crossover design, the clinicians were randomly and equally divided into 2 groups. Within each group, examinations were sorted in a fixed random order for half of the group and sorted in reverse order for the other half. Group 1 first read the examinations without model augmentation, and group 2 first read the examinations with model augmentation. After a washout period of 14 days, the augmentation arrangement was reversed such that group 1 performed reads with model augmentation and group 2 read the examinations without model augmentation (Figure 1A).

Clinicians were instructed to assign a binary label for the presence or absence of at least 1 clinically significant aneurysm, defined as having a diameter greater than 3 mm. Clinicians read alone in a diagnostic reading room, all using the same high-definition monitor (3840 × 2160 pixels) displaying CTA examinations on a standard open-source DICOM viewer (Horos).22 Clinicians entered their labels into a data entry software application that automatically logged the time difference between labeling of the previous examination and the current examination.

When reading with model augmentation, clinicians were provided the model’s predictions in the form of region of interest (ROI) segmentations directly overlaid on top of CTA examinations. To ensure an image display interface that was familiar to all clinicians, the model’s predictions were presented as ROIs in a standard DICOM viewing software. At every voxel where the model predicted a probability greater than 0.5, readers saw a semiopaque red overlay on the axial, sagittal, and coronal series (Figure 1C). Readers had access to the ROIs immediately on loading the examinations, and the ROIs could be toggled off to reveal the unaltered CTA images (Figure 1B). The red overlays were the only indication that was given whether a particular CTA examination had been predicted by the model to contain an aneurysm. Given these model results, readers had the option to take it into consideration or disregard it based on clinical judgment. When readers performed diagnoses without augmentation, no ROIs were present on any of the examinations. Otherwise, the diagnostic tools were identical for augmented and nonaugmented reads.

Statistical Analysis

On the binary task of determining whether an examination contained an aneurysm, sensitivity, specificity, and accuracy were used to assess the performance of clinicians with and without model augmentation. Sensitivity denotes the number of true-positive results over total aneurysm-positive cases, specificity denotes the number of true-negative results over total aneurysm-negative cases, and accuracy denotes the number of true-positive and true-negative results over all test cases. The microaverage of these statistics across all clinicians was also computed by measuring each statistic pertaining to the total number of true-positive, false-negative, and false-positive results. In addition, to convert the models’ segmentation output of the model into a binary prediction, a prediction was considered positive if the model predicted at least 1 voxel as belonging to an aneurysm and negative otherwise. The 95% Wilson score confidence intervals were used to assess the variability in the estimates for sensitivity, specificity, and accuracy.23

To assess whether the clinicians achieved significant increases in performance with model augmentation, a 1-tailed t test was performed on the differences in sensitivity, specificity, and accuracy across all 8 clinicians. To determine the robustness of the findings and whether results were due to inclusion of the resident radiologist and neurosurgeon, we performed a sensitivity analysis: we computed the t test on the differences in sensitivity, specificity, and accuracy across board-certified radiologists only.

The average time to diagnosis for the clinicians with and without augmentation was computed as the difference between the mean entry times into the spreadsheet of consecutive diagnoses; 95% t score confidence intervals were used to assess the variability in the estimates. To account for interruptions in the clinical read or time logging errors, the 5 longest and 5 shortest time to diagnosis for each clinician in each reading were excluded. To assess whether model augmentation significantly decreased the time to diagnosis, a 1-tailed t test was performed on the difference in average time with and without augmentation across all 8 clinicians.

The interrater agreement of clinicians and for the radiologist subset was computed using the exact Fleiss κ.24 To assess whether model augmentation increased interrater agreement, a 1-tailed permutation test was performed on the difference between the interrater agreement of clinicians on the test set with and without augmentation. The permutation procedure consisted of randomly swapping clinician annotations with and without augmentation so that a random subset of the test set that had previously been labeled as read with augmentation was now labeled as being read without augmentation, and vice versa; the exact Fleiss κ values (and the difference) were computed on the test set with permuted labels. This permutation procedure was repeated 10 000 times to generate the null distribution of the Fleiss κ difference (the interrater agreement of clinician annotations with augmentation is not higher than without augmentation) and the unadjusted value calculated as the proportion of Fleiss κ differences that were higher than the observed Fleiss κ difference.

To control the familywise error rate, the Benjamini-Hochberg correction was applied to account for multiple hypothesis testing; a Benjamini-Hochberg–adjusted P ≤ .05 indicated statistical significance. All tests were 1-tailed.25

Results

The data set contained 818 examinations from 662 unique patients with 328 CTA examinations (40.1%) containing at least 1 intracranial aneurysm and 490 examinations (59.9%) without intracranial aneurysms (Figure 2). Of the 328 aneurysm cases, 20 cases from 15 unique patients contained 2 or more aneurysms. One hundred forty-eight aneurysm cases contained aneurysms between 3 mm and 7 mm, 108 cases had aneurysms between 7 mm and 12 mm, 61 cases had aneurysms between 12 mm and 24 mm, and 11 cases had aneurysms 24 mm or greater. The location of the aneurysms varied according to the following distribution: 99 were located in the internal carotid artery, 78 were in the middle cerebral artery, 50 were cavernous internal carotid artery aneurysms, 44 were basilar tip aneurysms, 41 were in the anterior communicating artery, 18 were in the posterior communicating artery, 16 were in the vertebrobasilar system, and 12 were in the anterior cerebral artery. All examinations were performed either on a GE Discovery, GE LightSpeed, GE Revolution, Siemens Definition, Siemens Sensation, or a Siemens Force scanner, with slice thicknesses of 1.0 mm or 1.25 mm, using standard clinical protocols for head angiogram or head/neck angiogram. There was no difference between the protocols or slice thicknesses between the aneurysm and nonaneurysm examinations. For this study, axial series were extracted from each examination and a segmentation label was produced on every axial slice containing an aneurysm. The number of images per examination ranged from 113 to 802 (mean [SD], 373 [157]).

The examinations were split into a training set of 611 examinations (494 patients; mean [SD] age, 55.8 [18.1] years; 372 [60.9%] female) used to train the model, a development set of 92 examinations (86 patients; mean [SD] age, 61.6 [16.7] years; 59 [64.1%] female) used for model selection, and a test set of 115 examinations (82 patients; mean [SD] age, 57.8 [18.3] years; 74 [64.4%] female) to evaluate the performance of the clinicians when augmented with the model (Figure 2).

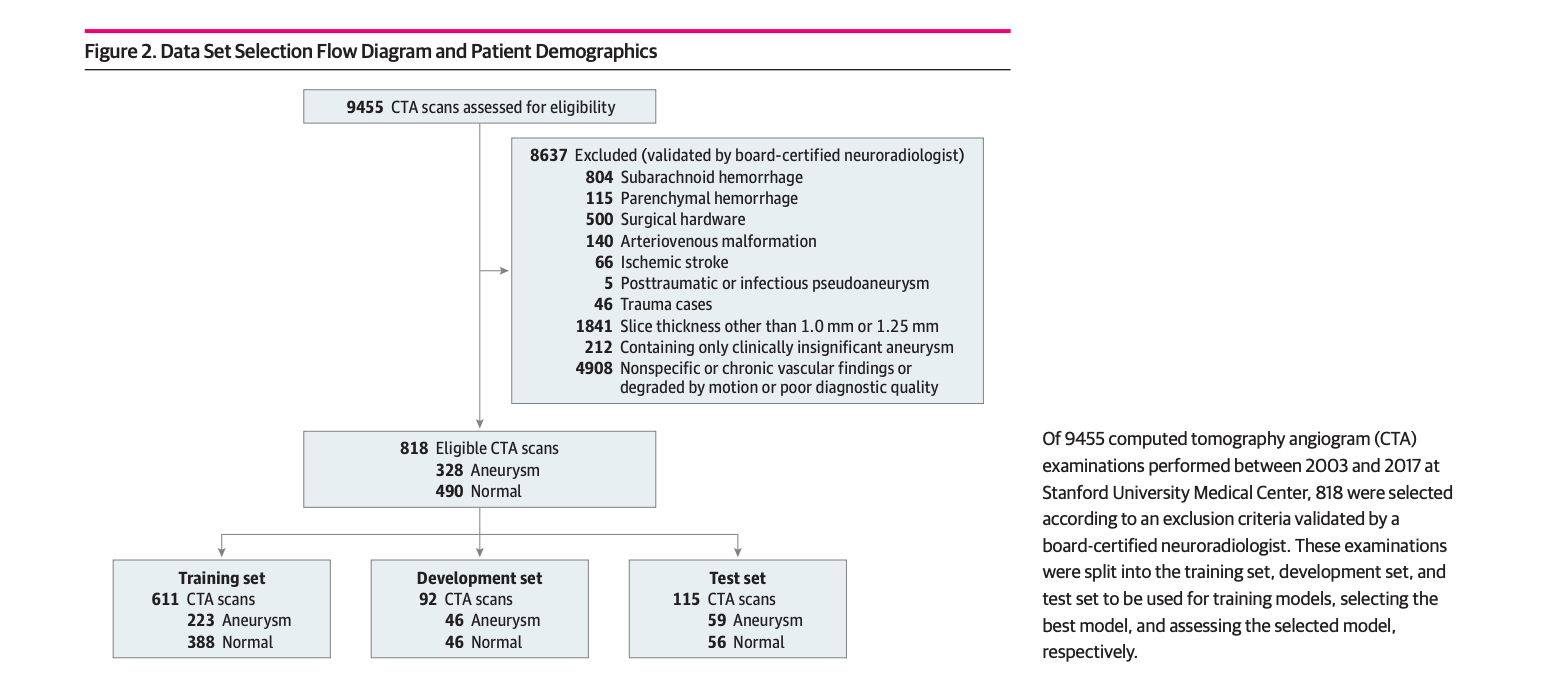
Using stratified random sampling, the development and test sets were formed to include 50% aneurysm examinations and 50% normal examinations; the remaining examinations composed the training set, of which 36.5% were aneurysm examinations. Forty-three patients had multiple examinations in the data set due to examinations performed for follow-up of the aneurysm. To account for these repeat patients, examinations were split so that there was no patient overlap between the different sets. Figure 2 contains pathology and patient demographic characteristics for each set.

A total of 8 clinicians, including 6 board-certified practicing radiologists, 1 practicing neurosurgeon, and 1 radiology resident, participated as readers in the study. The radiologists’ years of experience ranged from 3 to 12 years, the neurosurgeon had 2 years of experience as attending, and the resident was in the second year of training at Stanford University Medical Center. Groups 1 and 2 consisted of 3 radiologists each; the resident and neurosurgeon were both in group 1. None of the clinicians were involved in establishing the reference standard for the examinations.

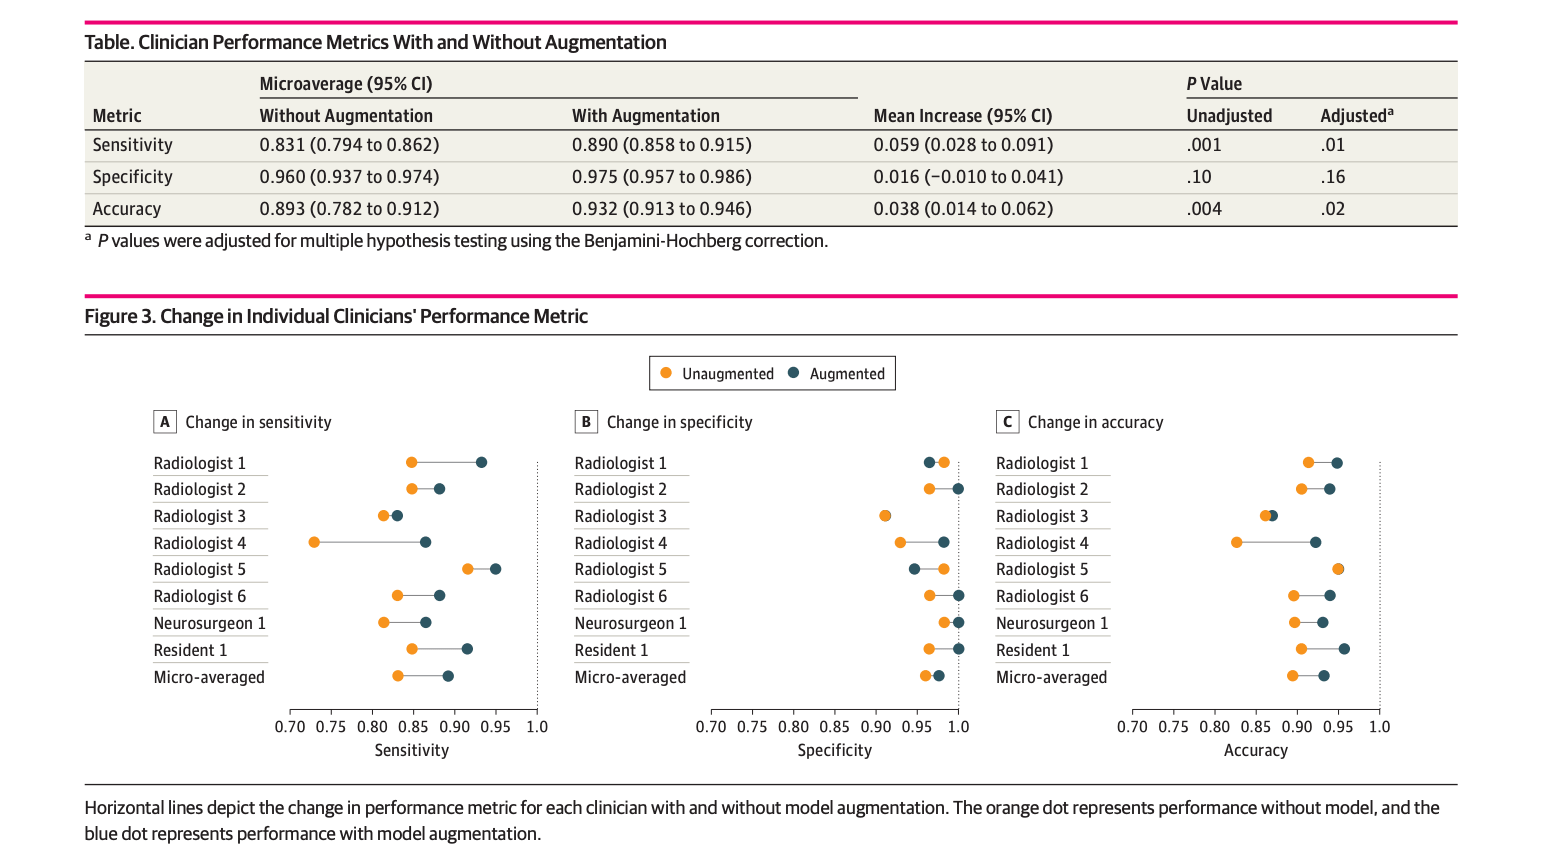
Without augmentation, clinicians achieved a microaveraged sensitivity of 0.831 (95% CI, 0.794-0.862), specificity of 0.960 (95% CI, 0.937-0.974), and an accuracy of 0.893 (95% CI, 0.872-0.912). With augmentation, the clinicians achieved a microaveraged sensitivity of 0.890 (95% CI, 0.858-0.915), specificity of 0.975 (95% CI, 0.957-0.986), and an accuracy of 0.932 (95% CI, 0.913-0.946). The underlying model had a sensitivity of 0.949 (95% CI, 0.861-0.983), specificity of 0.661 (95% CI, 0.530-0.771), and accuracy of 0.809 (95% CI, 0.727-0.870). The performances of the model, individual clinicians, and their microaverages are reported in eTable 1 in the Supplement.

With augmentation, there was a statistically significant increase in the mean sensitivity (0.059; 95% CI, 0.028-0.091; adjusted P = .01) and mean accuracy (0.038; 95% CI, 0.014-0.062; adjusted P = .02) of the clinicians as a group. There was no statistically significant change in mean specificity (0.016; 95% CI, −0.010 to 0.041; adjusted P = .16). Performance improvements across clinicians are detailed in the Table, and individual clinician improvement in Figure 3.

Individual performances with and without model augmentation are shown in eTable 1 in the Supplement. The sensitivity analysis confirmed that even among board-certified radiologists, there was a statistically significant increase in mean sensitivity (0.059; 95% CI, 0.013-0.105; adjusted P = .04) and accuracy (0.036; 95% CI, 0.001-0.072; adjusted P = .05). Performance improvements of board-certified radiologists as a group are shown in eTable 2 in the Supplement.

The mean diagnosis time per examination without augmentation microaveraged across clinicians was 57.04 seconds (95% CI, 54.58-59.50 seconds). The times for individual clinicians are detailed in eTable 3 in the Supplement, and individual time changes are shown in eFigure 2 in the Supplement.

With augmentation, there was no statistically significant decrease in mean diagnosis time (5.71 seconds; 95% CI, −7.22 to 18.63 seconds; adjusted P = .19). The model took a mean of 7.58 seconds (95% CI, 6.92-8.25 seconds) to process an examination and output its segmentation map.Confusion matrices, which are tables reporting true- and false-positive results and true- and false-negative results of each clinician with and without model augmentation, are shown in eTable 4 in the Supplement.

There was a statistically significant increase of 0.060 (adjusted P = .05) in the interrater agreement among the clinicians, with an exact Fleiss κ of 0.799 without augmentation and 0.859 with augmentation. For the board-certified radiologists, there was an increase of 0.063 in their interrater agreement, with an exact Fleiss κ of 0.783 without augmentation and 0.847 with augmentation.

Discussion

In this study, the ability of a deep learning model to augment clinician performance in detecting cerebral aneurysms using CTA was investigated with a crossover study design. With model augmentation, clinicians’ sensitivity, accuracy, and interrater agreement significantly increased. There was no statistical change in specificity and time to diagnosis.Given the potential catastrophic outcome of a missed aneurysm at risk of rupture, an automated detection tool that reliably detects and enhances clinicians’ performance is highly desirable. Aneurysm rupture is fatal in 40% of patients and leads to irreversible neurological disability in two-thirds of those who survive; therefore, an accurate and timely detection is of paramount importance. In addition to significantly improving accuracy across clinicians while interpreting CTA examinations, an automated aneurysm detection tool, such as the one presented in this study, could also be used to prioritize workflow so that those examinations more likely to be positive could receive timely expert review, potentially leading to a shorter time to treatment and more favorable outcomes.The significant variability among clinicians in the diagnosis of aneurysms has been well documented and is typically attributed to lack of experience or subspecialty neuroradiology training, complex neurovascular anatomy, or the labor-intensive nature of identifying aneurysms. Studies have shown that interrater agreement of CTA-based aneurysm detection is highly variable, with interrater reliability metrics ranging from 0.37 to 0.85,6,7,2628 and performance levels that vary depending on aneurysm size and individual radiologist experience.4,6 In addition to significantly increasing sensitivity and accuracy, augmenting clinicians with the model also significantly improved interrater reliability from 0.799 to 0.859. This implies that augmenting clinicians with varying levels of experience and specialties with models could lead to more accurate and more consistent radiological interpretations. Currently, tools to improve clinician aneurysm detection on CTA include bone subtraction,29 as well as 3-D rendering of intracranial vasculature,3032 which rely on application of contrast threshold settings to better delineate cerebral vasculature and create a 3-D–rendered reconstruction to assist aneurysm detection. However, using these tools is labor- and time-intensive for clinicians; in some institutions, this process is outsourced to a 3-D lab at additional costs. The tool developed in this study, integrated directly in a standard DICOM viewer, produces a segmentation map on a new examination in only a few seconds. If integrated into the standard workflow, this diagnostic tool could substantially decrease both cost and time to diagnosis, potentially leading to more efficient treatment and more favorable patient outcomes.Deep learning has recently shown success in various clinical image-based recognition tasks. In particular, studies have shown strong performance of 2-D CNNs in detecting intracranial hemorrhage and other acute brain findings, such as mass effect or skull fractures, on CT head examinations.3336 Recently, one study10 examined the potential role for deep learning in magnetic resonance angiogram–based detection of cerebral aneurysms, and another study37 showed that providing deep learning model predictions to clinicians when interpreting knee magnetic resonance studies increased specificity in detecting anterior cruciate ligament tears. To our knowledge, prior to this study, deep learning had not been applied to CTA, which is the first-line imaging modality for detecting cerebral aneurysms. Our results demonstrate that deep learning segmentation models may produce dependable and interpretable predictions that augment clinicians and improve their diagnostic performance. The model implemented and tested in this study significantly increased sensitivity, accuracy, and interrater reliability of clinicians with varied experience and specialties in detecting cerebral aneurysms using CTA.

Limitations

This study has limitations. First, because the study focused only on nonruptured aneurysms, model performance on aneurysm detection after aneurysm rupture, lesion recurrence after coil or surgical clipping, or aneurysms associated with arteriovenous malformations has not been investigated. Second, since examinations containing surgical hardware or devices were excluded, model performance in their presence is unknown. In a clinical environment, CTA is typically used to evaluate for many types of vascular diseases, not just for aneurysm detection. Therefore, the high prevalence of aneurysm in the test set and the clinician’s binary task could have introduced bias in interpretation. Also, this study was performed on data from a single tertiary care academic institution and may not reflect performance when applied to data from other institutions with different scanners and imaging protocols, such as different slice thicknesses.

Conclusions

A deep learning model was developed to automatically detect clinically significant intracranial aneurysms on CTA. We found that the augmentation significantly improved clinicians’ sensitivity, accuracy, and interrater reliability. Future work should investigate the performance of this model prospectively and in application of data from other institutions and hospitals.

Article Information:

Accepted for Publication: April 23, 2019.

Published: June 7, 2019. doi:10.1001/jamanetworkopen.2019.5600

Open Access: This is an open access article distributed under the terms of the CC-BY License. © 2019 Park A et al. JAMA Network Open.

Corresponding Author: Kristen W. Yeom, MD, School of Medicine, Department of Radiology, Stanford University, 725 Welch Rd, Ste G516, Palo Alto, CA 94304 (kyeom@stanford.edu).

Author Contributions: Ms Park and Dr Yeom had full access to all of the data in the study and take responsibility for the integrity of the data and the accuracy of the data analysis. Ms Park and Messrs Chute and Rajpurkar are co–first authors. Drs Ng and Yeom are co–senior authors.

Concept and design: Park, Chute, Rajpurkar, Lou, Shpanskaya, Ni, Basu, Lungren, Ng, Yeom.

Acquisition, analysis, or interpretation of data: Park, Chute, Rajpurkar, Lou, Ball, Shpanskaya, Jabarkheel, Kim, McKenna, Tseng, Ni, Wishah, Wittber, Hong, Wilson, Halabi, Patel, Lungren, Yeom.

Drafting of the manuscript: Park, Chute, Rajpurkar, Lou, Ball, Jabarkheel, Kim, McKenna, Hong, Halabi, Lungren, Yeom.

Critical revision of the manuscript for important intellectual content: Park, Chute, Rajpurkar, Ball, Shpanskaya, Jabarkheel, Kim, Tseng, Ni, Wishah, Wittber, Wilson, Basu, Patel, Lungren, Ng, Yeom.

Statistical analysis: Park, Chute, Rajpurkar, Lou, Ball, Lungren.

Administrative, technical, or material support: Park, Chute, Shpanskaya, Jabarkheel, Kim, McKenna, Tseng, Wittber, Hong, Wilson, Lungren, Ng, Yeom.

Supervision: Park, Ball, Tseng, Halabi, Basu, Lungren, Ng, Yeom.

Conflict of Interest Disclosures: Drs Wishah and Patel reported grants from GE and Siemens outside the submitted work. Dr Patel reported participation in the speakers bureau for GE. Dr Lungren reported personal fees from Nines Inc outside the submitted work. Dr Yeom reported grants from Philips outside the submitted work. No other disclosures were reported.

Funding/Support: This work was supported by National Institutes of Health National Center for Advancing Translational Science Clinical and Translational Science Award UL1TR001085.

Role of the Funder/Sponsor: The National Institutes of Health had no role in the design and conduct of the study; collection, management, analysis, and interpretation of the data; preparation, review, or approval of the manuscript; and decision to submit the manuscript for publication.

Disclaimer: The content is solely the responsibility of the authors and does not necessarily represent the official views of the National Institutes of Health.

References

1.Jaja  BN, Cusimano  MD, Etminan  N,  et al.  Clinical prediction models for aneurysmal subarachnoid hemorrhage: a systematic review.  Neurocrit Care. 2013;18(1):143-153. doi:10.1007/s12028-012-9792-zPubMedGoogle ScholarCrossref
2.Turan  N, Heider  RA, Roy  AK,  et al.  Current perspectives in imaging modalities for the assessment of unruptured intracranial aneurysms: a comparative analysis and review.  World Neurosurg. 2018;113:280-292. doi:10.1016/j.wneu.2018.01.054PubMedGoogle ScholarCrossref
3.Yoon  NK, McNally  S, Taussky  P, Park  MS.  Imaging of cerebral aneurysms: a clinical perspective.  Neurovasc Imaging. 2016;2(1):6. doi:10.1186/s40809-016-0016-3Google ScholarCrossref
4.Jayaraman  MV, Mayo-Smith  WW, Tung  GA,  et al.  Detection of intracranial aneurysms: multi-detector row CT angiography compared with DSA.  Radiology. 2004;230(2):510-518. doi:10.1148/radiol.2302021465PubMedGoogle ScholarCrossref
5.Bharatha  A, Yeung  R, Durant  D,  et al.  Comparison of computed tomography angiography with digital subtraction angiography in the assessment of clipped intracranial aneurysms.  J Comput Assist Tomogr. 2010;34(3):440-445. doi:10.1097/RCT.0b013e3181d27393PubMedGoogle ScholarCrossref
6.Lubicz  B, Levivier  M, François  O,  et al.  Sixty-four-row multisection CT angiography for detection and evaluation of ruptured intracranial aneurysms: interobserver and intertechnique reproducibility.  AJNR Am J Neuroradiol. 2007;28(10):1949-1955. doi:10.3174/ajnr.A0699PubMedGoogle ScholarCrossref
7.White  PM, Teasdale  EM, Wardlaw  JM, Easton  V.  Intracranial aneurysms: CT angiography and MR angiography for detection prospective blinded comparison in a large patient cohort.  Radiology. 2001;219(3):739-749. doi:10.1148/radiology.219.3.r01ma16739PubMedGoogle ScholarCrossref
8.Suzuki  K.  Overview of deep learning in medical imaging.  Radiol Phys Technol. 2017;10(3):257-273. doi:10.1007/s12194-017-0406-5PubMedGoogle ScholarCrossref
9.Rajpurkar  P, Irvin  J, Ball  RL,  et al.  Deep learning for chest radiograph diagnosis: a retrospective comparison of the CheXNeXt algorithm to practicing radiologists.  PLoS Med. 2018;15(11):e1002686. doi:10.1371/journal.pmed.1002686PubMedGoogle ScholarCrossref
10.Bien  N, Rajpurkar  P, Ball  RL,  et al.  Deep-learning-assisted diagnosis for knee magnetic resonance imaging: development and retrospective validation of MRNet.  PLoS Med. 2018;15(11):e1002699. doi:10.1371/journal.pmed.1002699PubMedGoogle ScholarCrossref
11.Morita  A, Kirino  T, Hashi  K,  et al; UCAS Japan Investigators.  The natural course of unruptured cerebral aneurysms in a Japanese cohort.  N Engl J Med. 2012;366(26):2474-2482. doi:10.1056/NEJMoa1113260PubMedGoogle ScholarCrossref
12.Yushkevich  PA, Piven  J, Hazlett  HC,  et al.  User-guided 3D active contour segmentation of anatomical structures: significantly improved efficiency and reliability.  Neuroimage. 2006;31(3):1116-1128. doi:10.1016/j.neuroimage.2006.01.015PubMedGoogle ScholarCrossref
13.He  K, Zhang  X, Ren  S, Sun  J. Deep residual learning for image recognition. Paper presented at: Proceedings of the IEEE Conference on Computer Vision and Pattern Recognition; June 27, 2016; Las Vegas, NV.
14.Xie  S, Girshick  R, Dollár  P, Tu  Z, He  K. Aggregated residual transformations for deep neural networks. Paper presented at: 2017 IEEE Conference on Computer Vision and Pattern Recognition (CVPR); July 25, 2017; Honolulu, HI.
15.Hu  J, Shen  L, Sun  G. Squeeze-and-excitation networks. Paper presented at: 2018 IEEE Conference on Computer Vision and Pattern Recognition (CVPR); June 21, 2018; Salt Lake City, Utah.
16.Ronneberger  O, Fischer  P, Brox  T. U-net: Convolutional networks for biomedical image segmentation. International Conference on Medical Image Computing and Computer-Assisted Intervention. Basel, Switzerland: Springer International; 2015:234–241.
17.Carreira  J, Zisserman  A. Quo vadis, action recognition? a new model and the kinetics dataset. Paper presented at: 2017 IEEE Conference on Computer Vision and Pattern Recognition (CVPR); July 25, 2017; Honolulu, HI.
18.Chen  L-C, Papandreou  G, Schroff  F, Adam  H. Rethinking atrous convolution for semantic image segmentation. https://arxiv.org/abs/1706.05587. Published June 17, 2017. Accessed May 7, 2019.
19.Milletari  F, Navab  N, Ahmadi  S-A. V-net: Fully convolutional neural networks for volumetric medical image segmentation. Paper presented at: 2016 IEEE Fourth International Conference on 3D Vision (3DV); October 26-28, 2016; Stanford, CA.
20.Loshchilov  I, Hutter  F. Sgdr: Stochastic gradient descent with warm restarts. Paper presented at: 2017 Fifth International Conference on Learning Representations; April 24-26, 2017; Toulon, France.
21.Huang  G, Sun  Y, Liu  Z, Sedra  D, Weinberger  KQ. Deep networks with stochastic depth. European Conference on Computer Vision. Basel, Switzerland: Springer International; 2016:646–661.
22.Horos. https://horosproject.org. Accessed May 1, 2019.
23.Wilson  EB.  Probable inference, the law of succession, and statistical inference.  J Am Stat Assoc. 1927;22(158):209-212. doi:10.1080/01621459.1927.10502953Google ScholarCrossref
24.Fleiss  JL, Cohen  J.  The equivalence of weighted kappa and the intraclass correlation coefficient as measures of reliability.  Educ Psychol Meas. 1973;33(3):613-619. doi:10.1177/001316447303300309Google ScholarCrossref
25.Benjamini  Y, Hochberg  Y.  Controlling the false discovery rate: a practical and powerful approach to multiple testing.  J R Stat Soc Series B Stat Methodol. 1995;57(1):289-300.Google Scholar
26.Maldaner  N, Stienen  MN, Bijlenga  P,  et al.  Interrater agreement in the radiologic characterization of ruptured intracranial aneurysms based on computed tomography angiography.  World Neurosurg. 2017;103:876-882.e1. doi:10.1016/j.wneu.2017.04.131PubMedGoogle ScholarCrossref
27.Wang  Y, Gao  X, Lu  A,  et al.  Residual aneurysm after metal coils treatment detected by spectral CT.  Quant Imaging Med Surg. 2012;2(2):137-138.PubMedGoogle Scholar
28.Yoon  YW, Park  S, Lee  SH,  et al.  Post-traumatic myocardial infarction complicated with left ventricular aneurysm and pericardial effusion.  J Trauma. 2007;63(3):E73-E75. doi:10.1097/01.ta.0000246896.89156.70PubMedGoogle ScholarCrossref
29.Tomandl  BF, Hammen  T, Klotz  E, Ditt  H, Stemper  B, Lell  M.  Bone-subtraction CT angiography for the evaluation of intracranial aneurysms.  AJNR Am J Neuroradiol. 2006;27(1):55-59.PubMedGoogle Scholar
30.Shi  W-Y, Li  Y-D, Li  M-H,  et al.  3D rotational angiography with volume rendering: the utility in the detection of intracranial aneurysms.  Neurol India. 2010;58(6):908-913. doi:10.4103/0028-3886.73743PubMedGoogle ScholarCrossref
31.Lin  N, Ho  A, Gross  BA,  et al.  Differences in simple morphological variables in ruptured and unruptured middle cerebral artery aneurysms.  J Neurosurg. 2012;117(5):913-919. doi:10.3171/2012.7.JNS111766PubMedGoogle ScholarCrossref
32.Villablanca  JP, Jahan  R, Hooshi  P,  et al.  Detection and characterization of very small cerebral aneurysms by using 2D and 3D helical CT angiography.  AJNR Am J Neuroradiol. 2002;23(7):1187-1198.PubMedGoogle Scholar
33.Chang  PD, Kuoy  E, Grinband  J,  et al.  Hybrid 3D/2D convolutional neural network for hemorrhage evaluation on head CT.  AJNR Am J Neuroradiol. 2018;39(9):1609-1616. doi:10.3174/ajnr.A5742PubMedGoogle ScholarCrossref
34.Chilamkurthy  S, Ghosh  R, Tanamala  S,  et al.  Deep learning algorithms for detection of critical findings in head CT scans: a retrospective study.  Lancet. 2018;392(10162):2388-2396. doi:10.1016/S0140-6736(18)31645-3PubMedGoogle ScholarCrossref
35.Jnawali  K, Arbabshirani  MR, Rao  N, Patel  AA. Deep 3D convolution neural network for CT brain hemorrhage classification. Paper presented at: Medical Imaging 2018: Computer-Aided Diagnosis. February 27, 2018; Houston, TX. doi:10.1117/12.2293725
36.Titano  JJ, Badgeley  M, Schefflein  J,  et al.  Automated deep-neural-network surveillance of cranial images for acute neurologic events.  Nat Med. 2018;24(9):1337-1341. doi:10.1038/s41591-018-0147-yPubMedGoogle ScholarCrossref
37.Ueda  D, Yamamoto  A, Nishimori  M,  et al.  Deep learning for MR angiography: automated detection of cerebral aneurysms.  Radiology. 2019;290(1):187-194.PubMedGoogle ScholarCrossref

Read Full Post »

Real Time Coverage @BIOConvention #BIO2019: Machine Learning and Artificial Intelligence: Realizing Precision Medicine One Patient at a Time

Reporter: Stephen J Williams, PhD @StephenJWillia2

The impact of Machine Learning (ML) and Artificial Intelligence (AI) during the last decade has been tremendous. With the rise of infobesity, ML/AI is evolving to an essential capability to help mine the sheer volume of patient genomics, omics, sensor/wearables and real-world data, and unravel the knot of healthcare’s most complex questions.

Despite the advancements in technology, organizations struggle to prioritize and implement ML/AI to achieve the anticipated value, whilst managing the disruption that comes with it. In this session, panelists will discuss ML/AI implementation and adoption strategies that work. Panelists will draw upon their experiences as they share their success stories, discuss how to implement digital diagnostics, track disease progression and treatment, and increase commercial value and ROI compared against traditional approaches.

  • most of trials which are done are still in training AI/ML algorithms with training data sets.  The best results however have been about 80% accuracy in training sets.  Needs to improve
  • All data sets can be biased.  For example a professor was looking at heartrate using a IR detector on a wearable but it wound up that different types of skin would generate a different signal to the detector so training sets maybe population biases (you are getting data from one group)
  • clinical grade equipment actually haven’t been trained on a large set like commercial versions of wearables, Commercial grade is tested on a larger study population.  This can affect the AI/ML algorithms.
  • Regulations:  The regulatory bodies responsible is up to debate.  Whether FDA or FTC is responsible for AI/ML in healtcare and healthcare tech and IT is not fully decided yet.  We don’t have the guidances for these new technologies
  • some rules: never use your own encryption always use industry standards especially when getting personal data from wearables.  One hospital corrupted their system because their computer system was not up to date and could not protect against a virus transmitted by a wearable.
  • pharma companies understand they need to increase value of their products so very interested in how AI/ML can be used.

Please follow LIVE on TWITTER using the following @ handles and # hashtags:

@Handles

@pharma_BI

@AVIVA1950

@BIOConvention

# Hashtags

#BIO2019 (official meeting hashtag)

Read Full Post »

Real Time Coverage @BIOConvention #BIO2019: Chat with @FDA Commissioner, & Challenges in Biotech & Gene Therapy June 4 Philadelphia

Reporter: Stephen J. Williams, PhD @StephenJWillia2


  • taking patient concerns and voices from anecdotal to data driven system
  • talked about patient accrual hearing patient voice not only in ease of access but reporting toxicities
  • at FDA he wants to remove barriers to trial access and accrual; also talk earlier to co’s on how they should conduct a trial

Digital tech

  • software as medical device
  • regulatory path is mixed like next gen sequencing
  • wearables are concern for FDA (they need to recruit scientists who know this tech

Opioids

  • must address the crisis but in a way that does not harm cancer pain patients
  • smaller pain packs “blister packs” would be good idea

Clinical trial modernization

  • for Alzheimers disease problem is science
  • for diabetes problem is regulatory
  • different diseases calls for different trial design
  • have regulatory problems with rare diseases as can’t form control or placebo group, inhumane. for example ras tumors trials for MEK inhibitors were narrowly focused on certain ras mutants
Realizing the Promise of Gene Therapies for Patients Around the World

103ABC, Level 100

Speakers
Lots of promise, timeline is progressing faster but we need more education on use of the gene therapy
Regulatory issues: Cell and directly delivered gene based therapies have been now approved. Some challenges will be the ultrarare disease trials and how we address manufacturing issues.  Manufacturing is a big issue at CBER and scalability.  If we want to have global impact of these products we need to address the manufacturing issues
 of scalability.
Pfizer – clinical grade and scale is important.
Aventis – he knew manufacturing of biologics however gene therapy manufacturing has its separate issues and is more complicated especially for regulatory purposes for clinical grade as well as scalability.  Strategic decision: focusing on the QC on manufacturing was so important.  Had a major issue in manufacturing had to shut down and redesign the system.
Albert:  Manufacturing is the most important topic even to the investors.  Investors were really conservative especially seeing early problems but when academic centers figured out good efficacy then they investors felt better and market has exploded.  Now you can see investment into preclinical and startups but still want mature companies to focus on manufacturing.  About $10 billion investment in last 4 years.

How Early is Too Early? Valuing and De-Risking Preclinical Opportunities

109AB, Level 100

Speakers
Valuing early-stage opportunities is challenging. Modeling will often provide a false sense of accuracy but relying on comparable transactions is more art than science. With a long lead time to launch, even the most robust estimates can ultimately prove inaccurate. This interactive panel will feature venture capital investors and senior pharma and biotech executives who lead early-stage transactions as they discuss their approaches to valuing opportunities, and offer key learnings from both successful and not-so-successful experiences.
Dr. Schoenbeck, Pfizer:
  • global network of liaisons who are a dedicated team to research potential global startup partners or investments.  Pfizer has a separate team to evaluate academic laboratories.  In Most cases Pfizer does not initiate contact.  It is important to initiate the first discussion with them in order to get noticed.  Could be just a short chat or discussion on what their needs are for their portfolio.

Question: How early is too early?

Luc Marengere, TVM:  His company has early stage focus, on 1st in class molecules.  The sweet spot for their investment is a candidate selected compound, which should be 12-18 months from IND.  They will want to bring to phase II in less than 4 years for $15-17 million.  Their development model is bad for academic labs.  During this process free to talk to other partners.

Dr. Chaudhary, Biogen:  Never too early to initiate a conversation and sometimes that conversation has lasted 3+ years before a decision.  They like build to buy models, will do convertible note deals, candidate compound selection should be entering in GLP/Tox phase (sweet spot)

Merck: have MRL Venture Fund for pre series A funding.  Also reiterated it is never too early to have that initial discussion.  It will not put you in a throw away bin.  They will have suggestions and never like to throw out good ideas.

Michael Hostetler: Set expectations carefully ; data should be validated by a CRO.  If have a platform, they will look at the team first to see if strong then will look at the platform to see how robust it is.

All noted that you should be completely honest at this phase.  Do not overstate your results or data or overhype your compound(s).  Show them everything and don’t have a bias toward compounds you think are the best in your portfolio.  Sometimes the least developed are the ones they are interested in.  Also one firm may reject you however you may fit in others portfolios better so have a broad range of conversations with multiple players.


Read Full Post »

A Nonlinear Methodology to Explain Complexity of the Genome and Bioinformatic Information, Volume 2 (Volume Two: Latest in Genomics Methodologies for Therapeutics: Gene Editing, NGS and BioInformatics, Simulations and the Genome Ontology), Part 1: Next Generation Sequencing (NGS)

A Nonlinear Methodology to Explain Complexity of the Genome and Bioinformatic Information

Reporter: Stephen J. Williams, Ph.D.

Multifractal bioinformatics: A proposal to the nonlinear interpretation of genome

The following is an open access article by Pedro Moreno on a methodology to analyze genetic information across species and in particular, the evolutionary trends of complex genomes, by a nonlinear analytic approach utilizing fractal geometry, coined “Nonlinear Bioinformatics”.  This fractal approach stems from the complex nature of higher eukaryotic genomes including mosaicism, multiple interdispersed  genomic elements such as intronic regions, noncoding regions, and also mobile elements such as transposable elements.  Although seemingly random, there exists a repetitive nature of these elements. Such complexity of DNA regulation, structure and genomic variation is felt best understood by developing algorithms based on fractal analysis, which can best model the regionalized and repetitive variability and structure within complex genomes by elucidating the individual components which contributes to an overall complex structure rather than using a “linear” or “reductionist” approach looking at individual coding regions, which does not take into consideration the aforementioned factors leading to genetic complexity and diversity.

Indeed, many other attempts to describe the complexities of DNA as a fractal geometric pattern have been described.  In a paper by Carlo Cattani “Fractals and Hidden Symmetries in DNA“, Carlo uses fractal analysis to construct a simple geometric pattern of the influenza A virus by modeling the primary sequence of this viral DNA, namely the bases A,G,C, and T. The main conclusions that

fractal shapes and symmetries in DNA sequences and DNA walks have been shown and compared with random and deterministic complex series. DNA sequences are structured in such a way that there exists some fractal behavior which can be observed both on the correlation matrix and on the DNA walks. Wavelet analysis confirms by a symmetrical clustering of wavelet coefficients the existence of scale symmetries.

suggested that, at least, the viral influenza genome structure could be analyzed into its basic components by fractal geometry.
This approach has been used to model the complex nature of cancer as discussed in a 2011 Seminars in Oncology paper
Abstract: Cancer is a highly complex disease due to the disruption of tissue architecture. Thus, tissues, and not individual cells, are the proper level of observation for the study of carcinogenesis. This paradigm shift from a reductionist approach to a systems biology approach is long overdue. Indeed, cell phenotypes are emergent modes arising through collective non-linear interactions among different cellular and microenvironmental components, generally described by “phase space diagrams”, where stable states (attractors) are embedded into a landscape model. Within this framework, cell states and cell transitions are generally conceived as mainly specified by gene-regulatory networks. However, the system s dynamics is not reducible to the integrated functioning of the genome-proteome network alone; the epithelia-stroma interacting system must be taken into consideration in order to give a more comprehensive picture. Given that cell shape represents the spatial geometric configuration acquired as a result of the integrated set of cellular and environmental cues, we posit that fractal-shape parameters represent “omics descriptors of the epithelium-stroma system. Within this framework, function appears to follow form, and not the other way around.

As authors conclude

” Transitions from one phenotype to another are reminiscent of phase transitions observed in physical systems. The description of such transitions could be obtained by a set of morphological, quantitative parameters, like fractal measures. These parameters provide reliable information about system complexity. “

Gene expression also displays a fractal nature. In a Frontiers in Physiology paper by Mahboobeh Ghorbani, Edmond A. Jonckheere and Paul Bogdan* “Gene Expression Is Not Random: Scaling, Long-Range Cross-Dependence, and Fractal Characteristics of Gene Regulatory Networks“,

the authors describe that gene expression networks display time series display fractal and long-range dependence characteristics.

Abstract: Gene expression is a vital process through which cells react to the environment and express functional behavior. Understanding the dynamics of gene expression could prove crucial in unraveling the physical complexities involved in this process. Specifically, understanding the coherent complex structure of transcriptional dynamics is the goal of numerous computational studies aiming to study and finally control cellular processes. Here, we report the scaling properties of gene expression time series in Escherichia coliand Saccharomyces cerevisiae. Unlike previous studies, which report the fractal and long-range dependency of DNA structure, we investigate the individual gene expression dynamics as well as the cross-dependency between them in the context of gene regulatory network. Our results demonstrate that the gene expression time series display fractal and long-range dependence characteristics. In addition, the dynamics between genes and linked transcription factors in gene regulatory networks are also fractal and long-range cross-correlated. The cross-correlation exponents in gene regulatory networks are not unique. The distribution of the cross-correlation exponents of gene regulatory networks for several types of cells can be interpreted as a measure of the complexity of their functional behavior.


Given that multitude of complex biomolecular networks and biomolecules can be described by fractal patterns, the development of bioinformatic algorithms  would enhance our understanding of the interdependence and cross funcitonality of these mutiple biological networks, particularly in disease and drug resistance.  The article below by Pedro Moreno describes the development of such bioinformatic algorithms.

Pedro A. Moreno
Escuela de Ingeniería de Sistemas y Computación, Facultad de Ingeniería, Universidad del Valle, Cali, Colombia
E-mail: pedro.moreno@correounivalle.edu.co

Eje temático: Ingeniería de sistemas / System engineering
Recibido: 19 de septiembre de 2012
Aceptado: 16 de diciembre de 2013


Abstract

The first draft of the human genome (HG) sequence was published in 2001 by two competing consortia. Since then, several structural and functional characteristics for the HG organization have been revealed. Today, more than 2.000 HG have been sequenced and these findings are impacting strongly on the academy and public health. Despite all this, a major bottleneck, called the genome interpretation persists. That is, the lack of a theory that explains the complex puzzles of coding and non-coding features that compose the HG as a whole. Ten years after the HG sequenced, two recent studies, discussed in the multifractal formalism allow proposing a nonlinear theory that helps interpret the structural and functional variation of the genetic information of the genomes. The present review article discusses this new approach, called: “Multifractal bioinformatics”.

Keywords: Omics sciences, bioinformatics, human genome, multifractal analysis.


1. Introduction

Omic Sciences and Bioinformatics

In order to study the genomes, their life properties and the pathological consequences of impairment, the Human Genome Project (HGP) was created in 1990. Since then, about 500 Gpb (EMBL) represented in thousands of prokaryotic genomes and tens of different eukaryotic genomes have been sequenced (NCBI, 1000 Genomes, ENCODE). Today, Genomics is defined as the set of sciences and technologies dedicated to the comprehensive study of the structure, function and origin of genomes. Several types of genomic have arisen as a result of the expansion and implementation of genomics to the study of the Central Dogma of Molecular Biology (CDMB), Figure 1 (above). The catalog of different types of genomics uses the Latin suffix “-omic” meaning “set of” to mean the new massive approaches of the new omics sciences (Moreno et al, 2009). Given the large amount of genomic information available in the databases and the urgency of its actual interpretation, the balance has begun to lean heavily toward the requirements of bioinformatics infrastructure research laboratories Figure 1 (below).

The bioinformatics or Computational Biology is defined as the application of computer and information technology to the analysis of biological data (Mount, 2004). An interdisciplinary science that requires the use of computing, applied mathematics, statistics, computer science, artificial intelligence, biophysical information, biochemistry, genetics, and molecular biology. Bioinformatics was born from the need to understand the sequences of nucleotide or amino acid symbols that make up DNA and proteins, respectively. These analyzes are made possible by the development of powerful algorithms that predict and reveal an infinity of structural and functional features in genomic sequences, as gene location, discovery of homologies between macromolecules databases (Blast), algorithms for phylogenetic analysis, for the regulatory analysis or the prediction of protein folding, among others. This great development has created a multiplicity of approaches giving rise to new types of Bioinformatics, such as Multifractal Bioinformatics (MFB) that is proposed here.

1.1 Multifractal Bioinformatics and Theoretical Background

MFB is a proposal to analyze information content in genomes and their life properties in a non-linear way. This is part of a specialized sub-discipline called “nonlinear Bioinformatics”, which uses a number of related techniques for the study of nonlinearity (fractal geometry, Hurts exponents, power laws, wavelets, among others.) and applied to the study of biological problems (http://pharmaceuticalintelligence.com/tag/fractal-geometry/). For its application, we must take into account a detailed knowledge of the structure of the genome to be analyzed and an appropriate knowledge of the multifractal analysis.

1.2 From the Worm Genome toward Human Genome

To explore a complex genome such as the HG it is relevant to implement multifractal analysis (MFA) in a simpler genome in order to show its practical utility. For example, the genome of the small nematode Caenorhabditis elegans is an excellent model to learn many extrapolated lessons of complex organisms. Thus, if the MFA explains some of the structural properties in that genome it is expected that this same analysis reveals some similar properties in the HG.

The C. elegans nuclear genome is composed of about 100 Mbp, with six chromosomes distributed into five autosomes and one sex chromosome. The molecular structure of the genome is particularly homogeneous along with the chromosome sequences, due to the presence of several regular features, including large contents of genes and introns of similar sizes. The C. elegans genome has also a regional organization of the chromosomes, mainly because the majority of the repeated sequences are located in the chromosome arms, Figure 2 (left) (C. elegans Sequencing Consortium, 1998). Given these regular and irregular features, the MFA could be an appropriate approach to analyze such distributions.

Meanwhile, the HG sequencing revealed a surprising mosaicism in coding (genes) and noncoding (repetitive DNA) sequences, Figure 2 (right) (Venter et al., 2001). This structure of 6 Gbp is divided into 23 pairs of chromosomes (diploid cells) and these highly regionalized sequences introduce complex patterns of regularity and irregularity to understand the gene structure, the composition of sequences of repetitive DNA and its role in the study and application of life sciences. The coding regions of the genome are estimated at ~25,000 genes which constitute 1.4% of GH. These genes are involved in a giant sea of various types of non-coding sequences which compose 98.6% of HG (misnamed popularly as “junk DNA”). The non-coding regions are characterized by many types of repeated DNA sequences, where 10.6% consists of Alu sequences, a type of SINE (short and dispersed repeated elements) sequence and preferentially located towards the genes. LINES, MIR, MER, LTR, DNA transposons and introns are another type of non-coding sequences which form about 86% of the genome. Some of these sequences overlap with each other; as with CpG islands, which complicates the analysis of genomic landscape. This standard genomic landscape was recently clarified, the last studies show that 80.4% of HG is functional due to the discovery of more than five million “switches” that operate and regulate gene activity, re-evaluating the concept of “junk DNA”. (The ENCODE Project Consortium, 2012).

Given that all these genomic variations both in worm and human produce regionalized genomic landscapes it is proposed that Fractal Geometry (FG) would allow measuring how the genetic information content is fragmented. In this paper the methodology and the nonlinear descriptive models for each of these genomes will be reviewed.

1.3 The MFA and its Application to Genome Studies

Most problems in physics are implicitly non-linear in nature, generating phenomena such as chaos theory, a science that deals with certain types of (non-linear) but very sensitive dynamic systems to initial conditions, nonetheless of deterministic rigor, that is that their behavior can be completely determined by knowing initial conditions (Peitgen et al, 1992). In turn, the FG is an appropriate tool to study the chaotic dynamic systems (CDS). In other words, the FG and chaos are closely related because the space region toward which a chaotic orbit tends asymptotically has a fractal structure (strange attractors). Therefore, the FG allows studying the framework on which CDS are defined (Moon, 1992). And this is how it is expected for the genome structure and function to be organized.

The MFA is an extension of the FG and it is related to (Shannon) information theory, disciplines that have been very useful to study the information content over a sequence of symbols. Initially, Mandelbrot established the FG in the 80’s, as a geometry capable of measuring the irregularity of nature by calculating the fractal dimension (D), an exponent derived from a power law (Mandelbrot, 1982). The value of the D gives us a measure of the level of fragmentation or the information content for a complex phenomenon. That is because the D measures the scaling degree that the fragmented self-similarity of the system has. Thus, the FG looks for self-similar properties in structures and processes at different scales of resolution and these self-similarities are organized following scaling or power laws.

Sometimes, an exponent is not sufficient to characterize a complex phenomenon; so more exponents are required. The multifractal formalism allows this, and applies when many subgroups of fractals with different scalar properties with a large number of exponents or fractal dimensions coexist simultaneously. As a result, when a spectrum of multifractal singularity measurement is generated, the scaling behavior of the frequency of symbols of a sequence can be quantified (Vélez et al, 2010).

The MFA has been implemented to study the spatial heterogeneity of theoretical and experimental fractal patterns in different disciplines. In post-genomics times, the MFA was used to study multiple biological problems (Vélez et al, 2010). Nonetheless, very little attention has been given to the use of MFA to characterize the content of the structural genetic information of the genomes obtained from the images of the Chaos Representation Game (CRG). First studies at this level were made recently to the analysis of the C. elegans genome (Vélez et al, 2010) and human genomes (Moreno et al, 2011). The MFA methodology applied for the study of these genomes will be developed below.

2. Methodology

The Multifractal Formalism from the CGR

2.1 Data Acquisition and Molecular Parameters

Databases for the C. elegans and the 36.2 Hs_ refseq HG version were downloaded from the NCBI FTP server. Then, several strategies were designed to fragment the genomic DNA sequences of different length ranges. For example, the C. elegans genome was divided into 18 fragments, Figure 2 (left) and the human genome in 9,379 fragments. According to their annotation systems, the contents of molecular parameters of coding sequences (genes, exons and introns), noncoding sequences (repetitive DNA, Alu, LINES, MIR, MER, LTR, promoters, etc.) and coding/ non-coding DNA (TTAGGC, AAAAT, AAATT, TTTTC, TTTTT, CpG islands, etc.) are counted for each sequence.

2.2 Construction of the CGR 2.3 Fractal Measurement by the Box Counting Method

Subsequently, the CGR, a recursive algorithm (Jeffrey, 1990; Restrepo et al, 2009) is applied to each selected DNA sequence, Figure 3 (above, left) and from which an image is obtained, which is quantified by the box-counting algorithm. For example, in Figure 3 (above, left) a CGR image for a human DNA sequence of 80,000 bp in length is shown. Here, dark regions represent sub-quadrants with a high number of points (or nucleotides). Clear regions, sections with a low number of points. The calculation for the D for the Koch curve by the box-counting method is illustrated by a progression of changes in the grid size, and its Cartesian graph, Table 1

The CGR image for a given DNA sequence is quantified by a standard fractal analysis. A fractal is a fragmented geometric figure whose parts are an approximated copy at full scale, that is, the figure has self-similarity. The D is basically a scaling rule that the figure obeys. Generally, a power law is given by the following expression:

Where N(E) is the number of parts required for covering the figure when a scaling factor E is applied. The power law permits to calculate the fractal dimension as:

The D obtained by the box-counting algorithm covers the figure with disjoint boxes ɛ = 1/E and counts the number of boxes required. Figure 4 (above, left) shows the multifractal measure at momentum q=1.

2.4 Multifractal Measurement

When generalizing the box-counting algorithm for the multifractal case and according to the method of moments q, we obtain the equation (3) (Gutiérrez et al, 1998; Yu et al, 2001):

Where the Mi number of points falling in the i-th grid is determined and related to the total number Mand ɛ to box size. Thus, the MFA is used when multiple scaling rules are applied. Figure 4 (above, right) shows the calculation of the multifractal measures at different momentum q (partition function). Here, linear regressions must have a coefficient of determination equal or close to 1. From each linear regression D are obtained, which generate an spectrum of generalized fractal dimensions Dfor all q integers, Figure 4 (below, left). So, the multifractal spectrum is obtained as the limit:

The variation of the q integer allows emphasizing different regions and discriminating their fractal a high Dq is synonymous of the structure’s richness and the properties of these regions. Negative values emphasize the scarce regions; a high Dindicates a lot of structure and properties in these regions. In real world applications, the limit Dqreadily approximated from the data using a linear fitting: the transformation of the equation (3) yields:

Which shows that ln In(Mi )= for set q is a linear function in the ln(ɛ), Dq can therefore be evaluated as q the slope of a fixed relationship between In(Mi )= and (q-1) ln(ɛ). The methodologies and approaches for the method of box-counting and MFA are detailed in Moreno et al, 2000, Yu et al, 2001; Moreno, 2005. For a rigorous mathematical development of MFA from images consult Multifractal system, wikipedia.

2.5 Measurement of Information Content

Subsequently, from the spectrum of generalized dimensions Dq, the degree of multifractality ΔDq(MD) is calculated as the difference between the maximum and minimum values of : ΔD qq Dqmax – Dqmin (Ivanov et al, 1999). When qmaxqmin ΔDis high, the multifractal spectrum is rich in information and highly aperiodic, when ΔDq is small, the resulting dimension spectrum is poor in information and highly periodic. It is expected then, that the aperiodicity in the genome would be related to highly polymorphic genomic aperiodic structures and those periodic regions with highly repetitive and not very polymorphic genomic structures. The correlation exponent t(q) = (– 1)DqFigure 4 (below, right ) can also be obtained from the multifractal dimension Dq. The generalized dimension also provides significant specific information. D(q = 0) is equal to the Capacity dimension, which in this analysis is the size of the “box count”. D(q = 1) is equal to the Information dimension and D(q = 2) to the Correlation dimension. Based on these multifractal parameters, many of the structural genomic properties can be quantified, related, and interpreted.

2.6 Multifractal Parameters and Statistical and Discrimination Analyses

Once the multifractal parameters are calculated (D= (-20, 20), ΔDq, πq, etc.), correlations with the molecular parameters are sought. These relations are established by plotting the number of genome molecular parameters versus MD by discriminant analysis with Cartesian graphs in 2-D, Figure 5 (below, left) and 3-D and combining multifractal and molecular parameters. Finally, simple linear regression analysis, multivariate analysis, and analyses by ranges and clusterings are made to establish statistical significance.

3 Results and Discussion

3.1 Non-linear Descriptive Model for the C. elegans Genome

When analyzing the C. elegans genome with the multifractal formalism it revealed what symmetry and asymmetry on the genome nucleotide composition suggested. Thus, the multifractal scaling of the C. elegans genome is of interest because it indicates that the molecular structure of the chromosome may be organized as a system operating far from equilibrium following nonlinear laws (Ivanov et al, 1999; Burgos and Moreno-Tovar, 1996). This can be discussed from two points of view:

1) When comparing C. elegans chromosomes with each other, the X chromosome showed the lowest multifractality, Figure 5 (above). This means that the X chromosome is operating close to equilibrium, which results in an increased genetic instability. Thus, the instability of the X could selectively contribute to the molecular mechanism that determines sex (XX or X0) during meiosis. Thus, the X chromosome would be operating closer to equilibrium in order to maintain their particular sexual dimorphism.

2) When comparing different chromosome regions of the C. elegans genome, changes in multifractality were found in relation to the regional organization (at the center and arms) exhibited by the chromosomes, Figure 5 (below, left). These behaviors are associated with changes in the content of repetitive DNA, Figure 5 (below, right). The results indicated that the chromosome arms are even more complex than previously anticipated. Thus, TTAGGC telomere sequences would be operating far from equilibrium to protect the genetic information encoded by the entire chromosome.

All these biological arguments may explain why C. elegans genome is organized in a nonlinear way. These findings provide insight to quantify and understand the organization of the non-linear structure of the C. elegans genome, which may be extended to other genomes, including the HG (Vélez et al, 2010).

3.2 Nonlinear Descriptive Model for the Human Genome

Once the multifractal approach was validated in C. elegans genome, HG was analyzed exhaustively. This allowed us to propose a nonlinear model for the HG structure which will be discussed under three points of view.

1) It was found that the HG high multifractality depends strongly on the contents of Alu sequences and to a lesser extent on the content of CpG islands. These contents would be located primarily in highly aperiodic regions, thus taking the chromosome far from equilibrium and giving to it greater genetic stability, protection and attraction of mutations, Figure 6 (A-C). Thus, hundreds of regions in the HG may have high genetic stability and the most important genetic information of the HG, the genes, would be safeguarded from environmental fluctuations. Other repeated elements (LINES, MIR, MER, LTRs) showed no significant relationship,

Figure 6 (D). Consequently, the human multifractal map developed in Moreno et al, 2011 constitutes a good tool to identify those regions rich in genetic information and genomic stability. 2) The multifractal context seems to be a significant requirement for the structural and functional organization of thousands of genes and gene families. Thus, a high multifractal context (aperiodic) appears to be a “genomic attractor” for many genes (KOGs, KEEGs), Figure 6 (E) and some gene families, Figure 6 (F) are involved in genetic and deterministic processes, in order to maintain a deterministic regulation control in the genome, although most of HG sequences may be subject to a complex epigenetic control.

3) The classification of human chromosomes and chromosome regions analysis may have some medical implications (Moreno et al, 2002; Moreno et al, 2009). This means that the structure of low nonlinearity exhibited by some chromosomes (or chromosome regions) involve an environmental predisposition, as potential targets to undergo structural or numerical chromosomal alterations in Figure 6 (G). Additionally, sex chromosomes should have low multifractality to maintain sexual dimorphism and probably the X chromosome inactivation.

All these fractals and biological arguments could explain why Alu elements are shaping the HG in a nonlinearly manner (Moreno et al, 2011). Finally, the multifractal modeling of the HG serves as theoretical framework to examine new discoveries made by the ENCODE project and new approaches about human epigenomes. That is, the non-linear organization of HG might help to explain why it is expected that most of the GH is functional.

4. Conclusions

All these results show that the multifractal formalism is appropriate to quantify and evaluate genetic information contents in genomes and to relate it with the known molecular anatomy of the genome and some of the expected properties. Thus, the MFB allows interpreting in a logic manner the structural nature and variation of the genome.

The MFB allows understanding why a number of chromosomal diseases are likely to occur in the genome, thus opening a new perspective toward personalized medicine to study and interpret the GH and its diseases.

The entire genome contains nonlinear information organizing it and supposedly making it function, concluding that virtually 100% of HG is functional. Bioinformatics in general, is enriched with a novel approach (MFB) making it possible to quantify the genetic information content of any DNA sequence and their practical applications to different disciplines in biology, medicine and agriculture. This novel breakthrough in computational genomic analysis and diseases contributes to define Biology as a “hard” science.

MFB opens a door to develop a research program towards the establishment of an integrative discipline that contributes to “break” the code of human life. (http://pharmaceuticalintelligence. com/page/3/).

5. Acknowledgements

Thanks to the directives of the EISC, the Universidad del Valle and the School of Engineering for offering an academic, scientific and administrative space for conducting this research. Likewise, thanks to co authors (professors and students) who participated in the implementation of excerpts from some of the works cited here. Finally, thanks to Colciencias by the biotechnology project grant # 1103-12-16765.


6. References

Blanco, S., & Moreno, P.A. (2007). Representación del juego del caos para el análisis de secuencias de ADN y proteínas mediante el análisis multifractal (método “box-counting”). In The Second International Seminar on Genomics and Proteomics, Bioinformatics and Systems Biology (pp. 17-25). Popayán, Colombia.         [ Links ]

Burgos, J.D., & Moreno-Tovar, P. (1996). Zipf scaling behavior in the immune system. BioSystem , 39, 227-232.         [ Links ]

C. elegans Sequencing Consortium. (1998). Genome sequence of the nematode C. elegans: a platform for investigating biology. Science , 282, 2012-2018.         [ Links ]

Gutiérrez, J.M., Iglesias A., Rodríguez, M.A., Burgos, J.D., & Moreno, P.A. (1998). Analyzing the multifractals structure of DNA nucleotide sequences. In, M. Barbie & S. Chillemi (Eds.) Chaos and Noise in Biology and Medicine (cap. 4). Hackensack (NJ): World Scientific Publishing Co.         [ Links ]

Ivanov, P.Ch., Nunes, L.A., Golberger, A.L., Havlin, S., Rosenblum, M.G., Struzikk, Z.R., & Stanley, H.E. (1999). Multifractality in human heartbeat dynamics. Nature , 399, 461-465.         [ Links ]

Jeffrey, H.J. (1990). Chaos game representation of gene structure. Nucleic Acids Research , 18, 2163-2175.         [ Links ]

Mandelbrot, B. (1982). La geometría fractal de la naturaleza. Barcelona. España: Tusquets editores.         [ Links ]

Moon, F.C. (1992). Chaotic and fractal dynamics. New York: John Wiley.         [ Links ]

Moreno, P.A. (2005). Large scale and small scale bioinformatics studies on the Caenorhabditis elegans enome. Doctoral thesis. Department of Biology and Biochemistry, University of Houston, Houston, USA.         [ Links ]

Moreno, P.A., Burgos, J.D., Vélez, P.E., Gutiérrez, J.M., & et al., (2000). Multifractal analysis of complete genomes. In P roceedings of the 12th International Genome Sequencing and Analysis Conference (pp. 80-81). Miami Beach (FL).         [ Links ]

Moreno, P.A., Rodríguez, J.G., Vélez, P.E., Cubillos, J.R., & Del Portillo, P. (2002). La genómica aplicada en salud humana. Colombia Ciencia y Tecnología. Colciencias , 20, 14-21.         [ Links ]

Moreno, P.A., Vélez, P.E., & Burgos, J.D. (2009). Biología molecular, genómica y post-genómica. Pioneros, principios y tecnologías. Popayán, Colombia: Editorial Universidad del Cauca.         [ Links ]

Moreno, P.A., Vélez, P.E., Martínez, E., Garreta, L., Díaz, D., Amador, S., Gutiérrez, J.M., et. al. (2011). The human genome: a multifractal analysis. BMC Genomics , 12, 506.         [ Links ]

Mount, D.W. (2004). Bioinformatics. Sequence and ge nome analysis. New York: Cold Spring Harbor Laboratory Press.         [ Links ]

Peitgen, H.O., Jürgen, H., & Saupe D. (1992). Chaos and Fractals. New Frontiers of Science. New York: Springer-Verlag.         [ Links ]

Restrepo, S., Pinzón, A., Rodríguez, L.M., Sierra, R., Grajales, A., Bernal, A., Barreto, E. et. al. (2009). Computational biology in Colombia. PLoS Computational Biology, 5 (10), e1000535.         [ Links ]

The ENCODE Project Consortium. (2012). An integrated encyclopedia of DNA elements in the human genome. Nature , 489, 57-74.         [ Links ]

Vélez, P.E., Garreta, L.E., Martínez, E., Díaz, N., Amador, S., Gutiérrez, J.M., Tischer, I., & Moreno, P.A. (2010). The Caenorhabditis elegans genome: a multifractal analysis. Genet and Mol Res , 9, 949-965.         [ Links ]

Venter, J.C., Adams, M.D., Myers, E.W., Li, P.W., & et al. (2001). The sequence of the human genome. Science , 291, 1304-1351.         [ Links ]

Yu, Z.G., Anh, V., & Lau, K.S. (2001). Measure representation and multifractal analysis of complete genomes. Physical Review E: Statistical, Nonlinear, and Soft Matter Physics , 64, 031903.         [ Links ]


Other articles on Bioinformatics on this Open Access Journal include:

Bioinformatics Tool Review: Genome Variant Analysis Tools

2017 Agenda – BioInformatics: Track 6: BioIT World Conference & Expo ’17, May 23-35, 2017, Seaport World Trade Center, Boston, MA

Better bioinformatics

Broad Institute, Google Genomics combine bioinformatics and computing expertise

Autophagy-Modulating Proteins and Small Molecules Candidate Targets for Cancer Therapy: Commentary of Bioinformatics Approaches

CRACKING THE CODE OF HUMAN LIFE: The Birth of BioInformatics & Computational Genomics

Read Full Post »

The Regulatory challenge in adopting AI

Author and Curator: Dror Nir, PhD

3.4.3

3.4.3   The Regulatory challenge in adopting AI, Volume 2 (Volume Two: Latest in Genomics Methodologies for Therapeutics: Gene Editing, NGS and BioInformatics, Simulations and the Genome Ontology), Part 2: CRISPR for Gene Editing and DNA Repair

In the last couple of years we are witnessing a surge of AI applications in healthcare. It is clear now, that AI and its wide range of health-applications are about to revolutionize diseases’ pathways and the way the variety of stakeholders in this market interact.

Not surprisingly, the developing surge has waken the regulatory watchdogs who are now debating ways to manage the introduction of such applications to healthcare. Attributing measures to known regulatory checkboxes like safety, and efficacy is proving to be a complex exercise. How to align claims made by manufacturers, use cases, users’ expectations and public expectations is unclear. A recent demonstration of that is the so called “failure” of AI in social-network applications like FaceBook and Twitter in handling harmful materials.

‘Advancing AI in the NHS’ – is a report covering the challenges and opportunities of AI in the NHS. It is a modest contribution to the debate in such a timely and fast-moving field!  I bring here the report’s preface and executive summary hoping that whoever is interested in reading the whole 50 pages of it will follow this link: f53ce9_e4e9c4de7f3c446fb1a089615492ba8c

Screenshot 2019-04-07 at 17.18.18

Acknowledgements

We and Polygeia as a whole are grateful to Dr Dror Nir, Director, RadBee, whose insights

were valuable throughout the research, conceptualisation, and writing phases of this work; and to Dr Giorgio Quer, Senior Research Scientist, Scripps Research Institute; Dr Matt Willis, Oxford Internet Institute, University of Oxford; Professor Eric T. Meyer, Oxford Internet Institute, University of Oxford; Alexander Hitchcock, Senior Researcher, Reform; Windi Hari, Vice President Clinical, Quality & Regulatory, HeartFlow; Jon Holmes, co-founder and Chief Technology Officer, Vivosight; and Claudia Hartman, School of Anthropology & Museum Ethnography, University of Oxford for their advice and support.

Author affiliations

Lev Tankelevitch, University of Oxford

Alice Ahn, University of Oxford

Rachel Paterson, University of Oxford

Matthew Reid, University of Oxford

Emily Hilbourne, University of Oxford

Bryan Adriaanse, University of Oxford

Giorgio Quer, Scripps Research Institute

Dror Nir, RadBee

Parth Patel, University of Cambridge

All affiliations are at the time of writing.

Polygeia

Polygeia is an independent, non-party, and non-profit think-tank focusing on health and its intersection with technology, politics, and economics. Our aim is to produce high-quality research on global health issues and policies. With branches in Oxford, Cambridge, London and New York, our work has led to policy reports, peer-reviewed publications, and presentations at the House of Commons and the European Parliament. http://www.polygeia.com @Polygeia © Polygeia 2018. All rights reserved.

Foreword

Almost every day, as MP for Cambridge, I am told of new innovations and developments that show that we are on the cusp of a technological revolution across the sectors. This technology is capable of revolutionising the way we work; incredible innovations which could increase our accuracy, productivity and efficiency and improve our capacity for creativity and innovation.

But huge change, particularly through adoption of new technology, can be difficult to  communicate to the public, and if we do not make sure that we explain carefully the real benefits of such technologies we easily risk a backlash. Despite good intentions, the care.data programme failed to win public trust, with widespread worries that the appropriate safeguards weren’t in place, and a failure to properly explain potential benefits to patients. It is vital that the checks and balances we put in place are robust enough to sooth public anxiety, and prevent problems which could lead to steps back, rather than forwards.

Previous attempts to introduce digital innovation into the NHS also teach us that cross-disciplinary and cross-sector collaboration is essential. Realising this technological revolution in healthcare will require industry, academia and the NHS to work together and share their expertise to ensure that technical innovations are developed and adopted in ways that prioritise patient health, rather than innovation for its own sake. Alongside this, we must make sure that the NHS workforce whose practice will be altered by AI are on side. Consultation and education are key, and this report details well the skills that will be vital to NHS adoption of AI. Technology is only as good as those who use it, and for this, we must listen to the medical and healthcare professionals who will rightly know best the concerns both of patients and their colleagues. The new Centre for Data Ethics and Innovation, the ICO and the National Data Guardian will be key in working alongside the NHS to create both a regulatory framework and the communications which win society’s trust. With this, and with real leadership from the sector and from politicians, focused on the rights and concerns of individuals, AI can be advanced in the NHS to help keep us all healthy.

Daniel Zeichner

MP for Cambridge

Chair, All-Party Parliamentary Group on Data Analytics

Executive summary

Artificial intelligence (AI) has the potential to transform how the NHS delivers care. From enabling patients to self-care and manage long-term conditions, to advancing triage, diagnostics, treatment, research, and resource management, AI can improve patient outcomes and increase efficiency. Achieving this potential, however, requires addressing a number of ethical, social, legal, and technical challenges. This report describes these challenges within the context of healthcare and offers directions forward.

Data governance

AI-assisted healthcare will demand better collection and sharing of health data between NHS, industry and academic stakeholders. This requires a data governance system that ensures ethical management of health data and enables its use for the improvement of healthcare delivery. Data sharing must be supported by patients. The recently launched NHS data opt-out programme is an important starting point, and will require monitoring to ensure that it has the transparency and clarity to avoid exploiting the public’s lack of awareness and understanding. Data sharing must also be streamlined and mutually beneficial. Current NHS data sharing practices are disjointed and difficult to negotiate from both industry and NHS perspectives. This issue is complicated by the increasing integration of ’traditional’ health data with that from commercial apps and wearables. Finding approaches to valuate data, and considering how patients, the NHS and its partners can benefit from data sharing is key to developing a data sharing framework. Finally, data sharing should be underpinned by digital infrastructure that enables cybersecurity and accountability.

Digital infrastructure

Developing and deploying AI-assisted healthcare requires high quantity and quality digital data. This demands effective digitisation of the NHS, especially within secondary care, involving not only the transformation of paper-based records into digital data, but also improvement of quality assurance practices and increased data linkage. Beyond data digitisation, broader IT infrastructure also needs upgrading, including the use of innovations such as wearable technology and interoperability between NHS sectors and institutions. This would not only increase data availability for AI development, but also provide patients with seamless healthcare delivery, putting the NHS at the vanguard of healthcare innovation.

Standards

The recent advances in AI and the surrounding hype has meant that the development of AI-assisted healthcare remains haphazard across the industry, with quality being difficult to determine or varying widely. Without adequate product validation, including in

real-world settings, there is a risk of unexpected or unintended performance, such as sociodemographic biases or errors arising from inappropriate human-AI interaction. There is a need to develop standardised ways to probe training data, to agree upon clinically-relevant performance benchmarks, and to design approaches to enable and evaluate algorithm interpretability for productive human-AI interaction. In all of these areas, standardised does not necessarily mean one-size-fits-all. These issues require addressing the specifics of AI within a healthcare context, with consideration of users’ expertise, their environment, and products’ intended use. This calls for a fundamentally interdisciplinary approach, including experts in AI, medicine, ethics, cognitive science, usability design, and ethnography.

Regulations

Despite the recognition of AI-assisted healthcare products as medical devices, current regulatory efforts by the UK Medicines and Healthcare Products Regulatory Agency and the European Commission have yet to be accompanied by detailed guidelines which address questions concerning AI product classification, validation, and monitoring. This is compounded by the uncertainty surrounding Brexit and the UK’s future relationship with the European Medicines Agency. The absence of regulatory clarity risks compromising patient safety and stalling the development of AI-assisted healthcare. Close working partnerships involving regulators, industry members, healthcare institutions, and independent AI-related bodies (for example, as part of regulatory sandboxes) will be needed to enable innovation while ensuring patient safety.

The workforce

AI will be a tool for the healthcare workforce. Harnessing its utility to improve care requires an expanded workforce with the digital skills necessary for both developing AI capability and for working productively with the technology as it becomes commonplace.

Developing capability for AI will involve finding ways to increase the number of clinician-informaticians who can lead the development, procurement and adoption of AI technology while ensuring that innovation remains tied to the human aspect of healthcare delivery. More broadly, healthcare professionals will need to complement their socio-emotional and cognitive skills with training to appropriately interpret information provided by AI products and communicate it effectively to co-workers and patients.

Although much effort has gone into predicting how many jobs will be affected by AI-driven automation, understanding the impact on the healthcare workforce will require examining how jobs will change, not simply how many will change.

Legal liability

AI-assisted healthcare has implications for the legal liability framework: who should be held responsible in the case of a medical error involving AI? Addressing the question of liability will involve understanding how healthcare professionals’ duty of care will be impacted by use of the technology. This is tied to the lack of training standards for healthcare professionals to safely and effectively work with AI, and to the challenges of algorithm interpretability, with ”black-box” systems forcing healthcare professionals to blindly trust or distrust their output. More broadly, it will be important to examine the legal liability of healthcare professionals, NHS trusts and industry partners, raising questions

Recommendations

  1. The NHS, the Centre for Data Ethics and Innovation, and industry and academic partners should conduct a review to understand the obstacles that the NHS and external organisations face around data sharing. They should also develop health data valuation protocols which consider the perspectives of patients, the NHS, commercial organisations, and academia. This work should inform the development of a data sharing framework.
  2. The National Data Guardian and the Department of Health should monitor the NHS data opt-out programme and its approach to transparency and communication, evaluating how the public understands commercial and non-commercial data use and the handling of data at different levels of anonymisation.
  3. The NHS, patient advocacy groups, and commercial organisations should expand public engagement strategies around data governance, including discussions about the value of health data for improving healthcare; public and private sector interactions in the development of AI-assisted healthcare; and the NHS’s strategies around data anonymisation, accountability, and commercial partnerships. Findings from this work should inform the development of a data sharing framework.
  4. The NHS Digital Security Operations Centre should ensure that all NHS organisations comply with cybersecurity standards, including having up-to-date technology.
  5. NHS Digital, the Centre for Data Ethics and Innovation, and the Alan Turing Institute should develop technological approaches to data privacy, auditing, and accountability that could be implemented in the NHS. This should include learning from Global Digital Exemplar trusts in the UK and from international examples such as Estonia.
  6. The NHS should continue to increase the quantity, quality, and diversity of digital health data across trusts. It should consider targeted projects, in partnership with professional medical bodies, that quality-assure and curate datasets for more deployment-ready AI technology. It should also continue to develop its broader IT infrastructure, focusing on interoperability between sectors, institutions, and technologies, and including the end users as central stakeholders.
  7. The Alan Turing Institute, the Ada Lovelace Institute, and academic and industry partners in medicine and AI should develop ethical frameworks and technological approaches for the validation of training data in the healthcare sector, including methods to minimise performance biases and validate continuously-learning algorithms.
  8. The Alan Turing Institute, the Ada Lovelace Institute, and academic and industry partners in medicine and AI should develop standardised approaches for evaluating product performance in the healthcare sector, with consideration for existing human performance standards and products’ intended use.
  9. The Alan Turing Institute, the Ada Lovelace Institute, and academic and industry partners in medicine and AI should develop methods of enabling and evaluating algorithm interpretability in the healthcare sector. This work should involve experts in AI, medicine, ethics, usability design, cognitive science, and ethnography, among others.
  10. Developers of AI products and NHS Commissioners should ensure that usability design remains a top priority in their respective development and procurement of AI-assisted healthcare products.
  11. The Medicines and Healthcare Products Regulatory Agency should establish a digital health unit with expertise in AI and digital products that will work together with manufacturers, healthcare bodies, notified bodies, AI-related organisations, and international forums to advance clear regulatory approaches and guidelines around AI product classification, validation, and monitoring. This should address issues including training data and biases, performance evaluation, algorithm interpretability, and usability.
  12. The Medicines and Healthcare Products Regulatory Agency, the Centre for Data Ethics and Innovation, and industry partners should evaluate regulatory approaches, such as regulatory sandboxing, that can foster innovation in AI-assisted healthcare, ensure patient safety, and inform on-going regulatory development.
  13. The NHS should expand innovation acceleration programmes that bridge healthcare and industry partners, with a focus on increasing validation of AI products in real-world contexts and informing the development of a regulatory framework.
  14. The Medicines and Healthcare Products Regulatory Agency and other Government bodies should arrange a post-Brexit agreement ensuring that UK regulations of medical devices, including AI-assisted healthcare, are aligned as closely as possible to the European framework and that the UK can continue to help shape Europe-wide regulations around this technology.
  15. The General Medical Council, the Medical Royal Colleges, Health Education England, and AI-related bodies should partner with industry and academia on comprehensive examinations of the healthcare sector to assess which, when, and how jobs will be impacted by AI, including analyses of the current strengths, limitations, and workflows of healthcare professionals and broader NHS staff. They should also examine how AI-driven workforce changes will impact patient outcomes.
  16. The Federation of Informatics Professionals and the Faculty of Clinical Informatics should continue to lead and expand standards for health informatics competencies, integrating the relevant aspects of AI into their training, accreditation, and professional development programmes for clinician-informaticians and related professions.
  17. Health Education England should expand training programmes to advance digital and AI-related skills among healthcare professionals. Competency standards for working with AI should be identified for each role and established in accordance with professional registration bodies such as the General Medical Council. Training programmes should ensure that ”un-automatable” socio-emotional and cognitive skills remain an important focus.
  18. The NHS Digital Academy should expand recruitment and training efforts to increase the number of Chief Clinical Information Officers across the NHS, and ensure that the latest AI ethics, standards, and innovations are embedded in their training programme.
  19. Legal experts, ethicists, AI-related bodies, professional medical bodies, and industry should review the implications of AI-assisted healthcare for legal liability. This includes understanding how healthcare professionals’ duty of care will be affected, the role of workforce training and product validation standards, and the potential role of NHS Indemnity and no-fault compensation systems.
  20. AI-related bodies such as the Ada Lovelace Institute, patient advocacy groups and other healthcare stakeholders should lead a public engagement and dialogue strategy to understand the public’s views on liability for AI-assisted healthcare.

Read Full Post »

3.5.2.6

3.5.2.6   Imaging: seeing or imagining? (Part 2), Volume 2 (Volume Two: Latest in Genomics Methodologies for Therapeutics: Gene Editing, NGS and BioInformatics, Simulations and the Genome Ontology), Part 3: AI in Medicine

That is the question…

Anyone who follows healthcare news, as I do , cannot help being impressed with the number of scientific and non-scientific items that mention the applicability of Magnetic Resonance Imaging (‘MRI’) to medical procedures.

A very important aspect that is worthwhile noting is that the promise MRI bears to improve patients’ screening – pre-clinical diagnosis, better treatment choice, treatment guidance and outcome follow-up – is based on new techniques that enables MRI-based tissue characterisation.

Magnetic resonance imaging (MRI) is an imaging device that relies on the well-known physical phenomena named “Nuclear Magnetic Resonance”. It so happens that, due to its short relaxation time, the 1H isotope (spin ½ nucleus) has a very distinctive response to changes in the surrounding magnetic field. This serves MRI imaging of the human body well as, basically, we are 90% water. The MRI device makes use of strong magnetic fields changing at radio frequency to produce cross-sectional images of organs and internal structures in the body. Because the signal detected by an MRI machine varies depending on the water content and local magnetic properties of a particular area of the body, different tissues or substances can be distinguished from one another in the scan’s resulting image.

The main advantages of MRI in comparison to X-ray-based devices such as CT scanners and mammography systems are that the energy it uses is non-ionizing and it can differentiate soft tissues very well based on differences in their water content.

In the last decade, the basic imaging capabilities of MRI have been augmented for the purpose of cancer patient management, by using magnetically active materials (called contrast agents) and adding functional measurements such as tissue temperature to show internal structures or abnormalities more clearly.


In order to increase the specificity and sensitivity of MRI imaging in cancer detection, various imaging strategies have been developed. The most discussed in MRI related literature are:

  • T2 weighted imaging: The measured response of the 1H isotope in a resolution cell of a T2-weighted image is related to the extent of random tumbling and the rotational motion of the water molecules within that resolution cell. The faster the rotation of the water molecule, the higher the measured value of the T2 weighted response in that resolution cell. For example, prostate cancer is characterized by a low T2 response relative to the values typical to normal prostatic tissue [5].

T2 MRI pelvis with Endo Rectal Coil ( DATA of Dr. Lance Mynders, MAYO Clinic)

  • Dynamic Contrast Enhanced (DCE) MRI involves a series of rapid MRI scans in the presence of a contrast agent. In the case of scanning the prostate, the most commonly used material is gadolinium [4].

Axial MRI  Lava DCE with Endo Rectal ( DATA of Dr. Lance Mynders, MAYO Clinic)

  • Diffusion weighted (DW) imaging: Provides an image intensity that is related to the microscopic motion of water molecules [5].

DW image of the left parietal glioblastoma multiforme (WHO grade IV) in a 59-year-old woman, Al-Okaili R N et al. Radiographics 2006;26:S173-S189

  • Multifunctional MRI: MRI image overlaid with combined information from T2-weighted scans, dynamic contrast-enhancement (DCE), and diffusion weighting (DW) [5].

Source AJR: http://www.ajronline.org/content/196/6/W715/F3

  • Blood oxygen level-dependent (BOLD) MRI: Assessing tissue oxygenation. Tumors are characterized by a higher density of micro blood vessels. The images that are acquired follow changes in the concentration of paramagnetic deoxyhaemoglobin [5].

In the last couple of years, medical opinion leaders are offering to use MRI to solve almost every weakness of the cancer patients’ pathway. Such proposals are not always supported by any evidence of feasibility. For example, a couple of weeks ago, the British Medical Journal published a study [1] concluding that women carrying a mutation in the BRCA1 or BRCA2 genes who have undergone a mammogram or chest x-ray before the age of 30 are more likely to develop breast cancer than those who carry the gene mutation but who have not been exposed to mammography. What is published over the internet and media to patients and lay medical practitioners is: “The results of this study support the use of non-ionising radiation imaging techniques (such as magnetic resonance imaging) as the main tool for surveillance in young women with BRCA1/2 mutations.”.

Why is ultrasound not mentioned as a potential “non-ionising radiation imaging technique”?

Another illustration is the following advert:

An MRI scan takes between 30 to 45 minutes to perform (not including the time of waiting for the interpretation by the radiologist). It requires the support of around 4 well-trained team members. It costs between $400 and $3500 (depending on the scan).

The important question, therefore, is: Are there, in the USA, enough MRI  systems to meet the demand of 40 million scans a year addressing women with radiographically dense  breasts? Toda there are approximately 10,000 MRI systems in the USA. Only a small percentage (~2%) of the examinations are related to breast cancer. A

A rough calculation reveals that around 10000 additional MRI centers would need to be financed and operated to meet that demand alone.

References

  1. Exposure to diagnostic radiation and risk of breast cancer among carriers of BRCA1/2 mutations: retrospective cohort study (GENE-RAD-RISK), BMJ 2012; 345 doi: 10.1136/bmj.e5660 (Published 6 September 2012), Cite this as: BMJ 2012;345:e5660 – http://www.bmj.com/content/345/bmj.e5660
  1. http://www.auntminnieeurope.com/index.aspx?sec=sup&sub=wom&pag=dis&itemId=607075
  1. Ahmed HU, Kirkham A, Arya M, Illing R, Freeman A, Allen C, Emberton M. Is it time to consider a role for MRI before prostate biopsy? Nat Rev Clin Oncol. 2009;6(4):197-206.
  1. Puech P, Potiron E, Lemaitre L, Leroy X, Haber GP, Crouzet S, Kamoi K, Villers A. Dynamic contrast-enhanced-magnetic resonance imaging evaluation of intraprostatic prostate cancer: correlation with radical prostatectomy specimens. Urology. 2009;74(5):1094-9.
  1. Advanced MR Imaging Techniques in the Diagnosis of Intraaxial Brain Tumors in Adults, Al-Okaili R N et al. Radiographics 2006;26:S173-S189 ,

http://radiographics.rsna.org/content/26/suppl_1/S173.full

  1. Ahmed HU. The Index Lesion and the Origin of Prostate Cancer. N Engl J Med. 2009 Oct; 361(17): 1704-6

Read Full Post »

Reporter: Gail S. Thornton

This article appeared on the website of Cardiovascular Business

‘Patient No. 1’ from a Hep C heart transplant study shares his story

By the time three transplant physicians approached Tom Giangiulio Jr. about being the first patient in a new clinical trial to accept a heart from a Hepatitis C-positive donor, Giangiulio didn’t have much of a choice.

He had already been on the heart transplant waitlist for more than two years, he was a live-in at the Hospital of the University of Pennsylvania and he had a body size (6-foot-2, 220 pounds) and blood type (O-positive) that was difficult to match to a donor.

It took Giangiulio less than 24 hours to speak to his previous cardiologist and his family and decide to enroll in the program. The doctors at Penn explained to him that because of new medications that can cure Hepatitis C, they were confident the virus could be eradicated post-transplant.

“There was no hesitation at all, not with me,” said Carin Giangiulio, Tom’s wife of 33 years. “Because I knew what the alternative was and we didn’t have too much choice except for going on a VAD (ventricular assist device) … and he didn’t want to do that. I said, ‘If they have a cure, then it’s a no-brainer. Let’s just do it.’ And I’m glad we did because I don’t think he would’ve been here today.”

Tom, 59, is set to celebrate his second anniversary with his new heart in June. He received the heart the day after Father’s Day in 2017 and subsequently contracted Hepatitis C, which was promptly wiped out with a 12-week regimen of elbasvir/grazoprevir (Zepatier).

Some of Giangiulio’s doctors at Penn published in February their experience with the first 10 patients in the clinical trial, called USHER, in the American Journal of Transplantation. All nine patients who survived were cured of Hepatitis C thanks to the antiviral therapy.

The implications of the research are massive, said Rhondalyn McLean, MD, MHS, the medical director of Penn’s heart transplant program and lead author of the recently published study. For the past two decades, the U.S. has struggled to increase the number of heart transplants above about 3,000 per year. And every year, patients die waiting for a heart transplant or become too sick to handle a transplant surgery.

McLean estimated 700 hearts from donors with Hepatitis C are discarded each year in the U.S. If even half of those are suitable for transplant, it would increase by 10 percent the number of organs that are available for implantation.

“There are so many people who have end-stage heart failure who die waiting for transplant, so anytime that we can increase our access to organs then I think we’re all going to be happy about that,” McLean said. “I think the people believe in the medicine, they believe that Hepatitis C is curable, so the risk to these folks is low. With the results of the study, I think we’ve proven that we can do this safely and the medications have great efficacy.”

Transplanting Hepatitis C-positive hearts isn’t a new idea, McLean explained.

“We used to do this all the time (with) the thinking that Hepatitis C usually doesn’t cause a problem for many, many years, so if hearts are only going to last 13 years or so and Hepatitis C doesn’t usually cause a problem for 30 years in someone, it should be an OK thing to do,” she said.

But then a study published in the 1990s found Hepatitis C-negative patients who accepted a heart from a donor with Hepatitis C actually had an increased risk of death compared to those who received normal hearts, and the practice of using these organs ceased.

However, with the new medications—the first commercially available treatment for Hepatitis C was approved by the FDA in 2014—McLean and her team are systematically studying the safety of implanting these hearts and then wiping out the virus once it’s contracted. And they’re optimistic about the program, which showed the first 10 patients had no evidence of the virus after their 12-week medication regimens.

“That met the criteria for sustained virologic response and those patients are deemed to be cured,” she said. “There’s no reason to think that this population would be any different than your normal, nontransplant population (in terms of Hepatitis C reappearing) so I think it was a pretty successful study.”

Penn researchers are also studying a similar approach in kidney and lung transplant candidates, which could help patients stuck on waitlists for those organs as well.

McLean described the increasing availability of these organs as an “unfortunate benefit” of the opioid epidemic. Through sharing needles, many opioid users are contracting Hepatitis C and dying young. Organs from young donors tend to perform better and often have no other problems, so solving the Hep C issue through medication could have a huge impact if this strategy is eventually rolled out on a broader scale.

“It’s hard when you have single-center studies,” McLean said. “They’re always promising, but in order to get a better assessment of what we’re doing and how the drug is doing I think you need to combine numbers so there has to be a registry that looks at all of the patients who have received these drugs and then using numbers to determine whether this is a successful strategy for us. And I believe that it will be.”

Those are the large-scale implications of this research. Tom Giangiulio can share the personal side.

Patient No. 1

Giangiulio said he feels “extremely gifted” to be Patient No. 1 in the USHER program. He knows he may not be alive if he wasn’t.

He recalls going into ventricular tachycardia about a week before his transplant and said it “scared the daylights” out of him.

“The amount of red tape, meetings and research, technology, and things that had to happen at a very precise moment in time for me to be the first … it’s mind-boggling to think about it,” he said. “But for all that to happen and for it to happen when it happened—and for me to get the heart when I got it—there was a lot of divine intervention along with a lot of people that were involved.”

Giangiulio has also experienced some powerful moments since receiving the transplant. After a bit of written correspondence with his donor’s family, he met the young man’s family one weekend in December of 2018.

He said riding over to the meeting was probably the most tense he’s ever been, but once he arrived the experience far exceeded his expectations.

“We were there for 2 ½ hours and nobody wanted to leave,” Giangiulio said.

The donor’s mother got Giangiulio a gift, a ceramic heart with a photograph of her son. A fellow transplant patient had told Giangiulio about a product called Enso, a kidney-shaped object you can hold in your hand which plays a recording of a user’s heartbeat.

Giangiulio decided to give it to her.

“I was very cautious at the advice of the people here at Penn,” he said. “Nobody knew how she would react to it. It might bother her, she could be thrilled to death. And she was, she was thrilled to death with it and she sleeps with it every night. She boots up the app and she listens to my heartbeat on that app every night.”

Another moment that sticks out to Giangiulio is meeting Patient No. 7 in the USHER program, who he remains in touch with. They ran into each other while waiting to get blood work done, and began talking about their shared experience as transplant recipients.

The clinical trial came up and Giangiulio slow-played his involvement, asking Patient No. 7 about the trial and not letting on that he was ultra-familiar with the program.

When Giangiulio finally told him he was Patient No. 1, Patient No. 7 “came launching out of his chair” to hug him.

“He said, ‘I owe you my life,’” Giangiulio recalled.

After Giangiulio responded that it was the doctors he really owed, Patient No. 7 said he had specifically asked how Patient No. 1 was doing when McLean first offered the program to him.

“She explained that I was going to be No. 7. … I didn’t care about 6, 5, 4, 3 or 2. I wanted to know how No. 1 was doing,” Giangiulio recalled of the conversation. “He said, ‘That was you. … They told me how well you were doing and that if I wanted you’d come here and talk to me, so I owe you.’”

Giangiulio feels strongly about giving back and reciprocating the good fortune he’s had. That’s why he talks to fellow patients and the media to share his story—because it could save other people’s lives, too.

He can’t do as much physical labor as he used to, but he remains involved in the excavating company he owns with his brothers and is the Emergency Management Coordinator for Waterford Township, New Jersey. He also serves on the township’s planning board and was previously Director of Public Safety.

“To me, he’s Superman,” Carin Giangiulio said. “It was insane, completely insane what the human body can endure and still survive.”

That now includes being given a heart with Hepatitis C and then wiping out the virus with the help of modern medicine.

“I would tell (other transplant candidates) to not fear it, especially if you’re here at Penn,” Giangiulio said. “I know there’s a lot of good hospitals across the country, but my loyalty kind of lies here for understandable reasons.”

Other related articles were published in this Open Access Online Scientific Journal include the following:

2016

People with blood type O have been reported to be protected from coronary heart disease, cancer, and have lower cholesterol levels.

https://pharmaceuticalintelligence.com/2016/01/11/people-with-blood-type-o-have-been-reported-to-be-protected-from-coronary-heart-disease-cancer-and-have-lower-cholesterol-levels/

2015

A Patient’s Perspective: On Open Heart Surgery from Diagnosis and Intervention to Recovery

https://pharmaceuticalintelligence.com/2015/05/10/a-patients-perspective-on-open-heart-surgery-from-diagnosis-and-intervention-to-recovery/

No evidence to change current transfusion practices for adults undergoing complex cardiac surgery: RECESS evaluated 1,098 cardiac surgery patients received red blood cell units stored for short or long periods

https://pharmaceuticalintelligence.com/2015/04/08/no-evidence-to-change-current-transfusion-practices-for-adults-undergoing-complex-cardiac-surgery-recess-evaluated-1098-cardiac-surgery-patients-received-red-blood-cell-units-stored-for-short-or-lon/

2013

ACC/AHA Guidelines for Coronary Artery Bypass Graft Surgery

https://pharmaceuticalintelligence.com/2013/11/05/accaha-guidelines-for-coronary-artery-bypass-graft-surgery/

On Devices and On Algorithms: Arrhythmia after Cardiac SurgeryPrediction and ECG Prediction of Paroxysmal Atrial Fibrillation Onset

https://pharmaceuticalintelligence.com/2013/05/07/on-devices-and-on-algorithms-arrhythmia-after-cardiac-surgery-prediction-and-ecg-prediction-of-paroxysmal-atrial-fibrillation-onset/


Editor’s note:

I wish to encourage the e-Reader of this Interview to consider reading and comparing the experiences of other Open Heart Surgery Patients, voicing their private-life episodes in the ER that are included in this recently published volume, The VOICES of Patients, Hospital CEOs, Health Care Providers, Caregivers and Families: Personal Experience with Critical Care and Invasive Medical Procedures.

https://pharmaceuticalintelligence.com/2017/11/21/the-voices-of-patients-hospital-ceos-health-care-providers-caregivers-and-families-personal-experience-with-critical-care-and-invasive-medical-procedures/


I also wish to encourage the e-Reader to consider, if interested, reviewing additional e-Books on Cardiovascular Diseases from the same Publisher, Leaders in Pharmaceutical Business Intelligence (LPBI) Group, on Amazon.com.

  • Perspectives on Nitric Oxide in Disease Mechanisms, on Amazon since 6/2/12013

http://www.amazon.com/dp/B00DINFFYC

  • Cardiovascular, Volume Two: Cardiovascular Original Research: Cases in Methodology Design for Content Co-Curation, on Amazon since 11/30/2015

http://www.amazon.com/dp/B018Q5MCN8

  • Cardiovascular Diseases, Volume Three: Etiologies of Cardiovascular Diseases: Epigenetics, Genetics and Genomics, on Amazon since 11/29/2015

http://www.amazon.com/dp/B018PNHJ84

  • Cardiovascular Diseases, Volume Four: Regenerative and Translational Medicine: The Therapeutics Promise for Cardiovascular Diseases, on Amazon since 12/26/2015

http://www.amazon.com/dp/B019UM909A

Read Full Post »

From Thalidomide to Revlimid: Celgene to Bristol Myers to possibly Pfizer; A Curation of Deals, Discovery and the State of Pharma


Curator: Stephen J. Williams, Ph.D.

Updated 6/24/2019

Updated 4/12/2019

Updated 2/28/2019

Lenalidomide (brand name Revlimid) is an approved chemotherapeutic used to treat multiple myeloma, mantle cell lymphoma, and certain myedysplastic syndromes.  It is chemically related to thalidomide analog with potential antineoplastic activity. Lenalidomide inhibits TNF-alpha production, stimulates T cells, reduces serum levels of the cytokines vascular endothelial growth factor (VEGF) and basic fibroblast growth factor (bFGF), and inhibits angiogenesis. This agent also promotes G1 cell cycle arrest and apoptosis of malignant cells.  It is usually given with dexamethasone for multiple myeloma. Revlimid was developed and sold by Celgene Corp.  However, recent news of deals with Bristol Myers Squib


Revlimid Approval History

FDA Approved: Yes (First approved December 27, 2005)
Brand name: Revlimid
Generic name: lenalidomide
Dosage form: Capsules
Company: Celgene Corporation
Treatment for: Myelodysplastic SyndromeMultiple MyelomaLymphoma

Revlimid (lenalidomide) is an immunomodulatory drug indicated for the treatment of patients with multiple myeloma, transfusion-dependent anemia due myelodysplastic syndromes (MDS), and mantle cell lymphoma.

Development History and FDA Approval Process for Revlimid

Date Article
Feb 22, 2017  FDA Expands Indication for Revlimid (lenalidomide) as a Maintenance Treatment for Patients with Multiple Myeloma Following Autologous Hematopoietic Stem Cell Transplant (auto-HSCT)
Feb 18, 2015  FDA Expands Indication for Revlimid (lenalidomide) in Combination with Dexamethasone to Include Patients Newly Diagnosed with Multiple Myeloma
Jun  5, 2013  FDA Approves Revlimid (lenalidomide) for the Treatment of Patients with Relapsed or Refractory Mantle Cell Lymphoma
Oct  3, 2005 Revlimid PDUFA Date Extended Three Months By FDA
Sep 14, 2005 FDA Oncologic Drugs Advisory Committee Recommends Revlimid for Full Approval
Sep 13, 2005 FDA and Celgene Revlimid Briefing Documents for Advisory Committee Meeting Available Online
Jun 21, 2005 FDA Grants Priority Review for Revlimid NDA for Treatment of Low- and Intermediate- Risk MDS With Deletion 5q Chromosomal Abnormality
Jun  7, 2005 Revlimid (lenalidomide) New Drug Application Accepted for Review by FDA
Apr  8, 2005 Revlimid New Drug Application Submitted to FDA for Review


M&A Deals Now and On The Horizon

  1. Right before the 2019 JP Morgan Healthcare Conference and a month before Bristol Myers quarterly earings reports, Bristol Myers Squib (BMY) announes a $74 Billion offer for Celgene Corp.  From the Bristol Myers website press realease:

Bristol-Myers Squibb to Acquire Celgene to Create a Premier Innovative Biopharma Company

  • Highly Complementary Portfolios with Leading Franchises in Oncology, Immunology and Inflammation and Cardiovascular Disease
  • Significantly Expands Phase III Assets with Six Expected Near-Term Product Launches, Representing Greater Than $15 Billion in Revenue Potential
  • Registrational Trial Opportunities and Early-Stage Pipeline Position Combined Company for Sustained Leadership Underpinned by Cutting-Edge Technologies and Discovery Platforms
  • Strong Combined Cash Flows, Enhanced Margins and EPS Accretion of Greater Than 40% in First Full Year
  • Approximately $2.5 Billion of Expected Run-Rate Cost Synergies to Be Achieved by 2022
THURSDAY, JANUARY 3, 2019 6:58 AM EST

NEW YORK & SUMMIT, N.J.,–(BUSINESS WIRE)–Bristol-Myers Squibb Company (NYSE:BMY) and Celgene Corporation (NASDAQ:CELG) today announced that they have entered into a definitive merger agreement under which Bristol-Myers Squibb will acquire Celgene in a cash and stock transaction with an equity value of approximately $74 billion. Under the terms of the agreement, Celgene shareholders will receive 1.0 Bristol-Myers Squibb share and $50.00 in cash for each share of Celgene. Celgene shareholders will also receive one tradeable Contingent Value Right (CVR) for each share of Celgene, which will entitle the holder to receive a payment for the achievement of future regulatory milestones. The Boards of Directors of both companies have approved the combination.

The transaction will create a leading focused specialty biopharma company well positioned to address the needs of patients with cancer, inflammatory and immunologic disease and cardiovascular disease through high-value innovative medicines and leading scientific capabilities. With complementary areas of focus, the combined company will operate with global reach and scale, maintaining the speed and agility that is core to each company’s strategic approach.

Based on the closing price of Bristol-Myers Squibb stock of $52.43 on January 2, 2019, the cash and stock consideration to be received by Celgene shareholders at closing is valued at $102.43 per Celgene share and one CVR (as described below). When completed, Bristol-Myers Squibb shareholders are expected to own approximately 69 percent of the company, and Celgene shareholders are expected to own approximately 31 percent.

“Together with Celgene, we are creating an innovative biopharma leader, with leading franchises and a deep and broad pipeline that will drive sustainable growth and deliver new options for patients across a range of serious diseases,” said Giovanni Caforio, M.D., Chairman and Chief Executive Officer of Bristol-Myers Squibb. “As a combined entity, we will enhance our leadership positions across our portfolio, including in cancer and immunology and inflammation. We will also benefit from an expanded early- and late-stage pipeline that includes six expected near-term product launches. Together, our pipeline holds significant promise for patients, allowing us to accelerate new options through a broader range of cutting-edge technologies and discovery platforms.”

Dr. Caforio continued, “We are impressed by what Celgene has accomplished for patients, and we look forward to welcoming Celgene employees to Bristol-Myers Squibb. Our new company will continue the strong patient focus that is core to both companies’ missions, creating a shared organization with a goal of discovering, developing and delivering innovative medicines for patients with serious diseases. We are confident we will drive value for shareholders and create opportunities for employees.”

“For more than 30 years, Celgene’s commitment to leading innovation has allowed us to deliver life-changing treatments to patients in areas of high unmet need. Combining with Bristol-Myers Squibb, we are delivering immediate and substantial value to Celgene shareholders and providing them meaningful participation in the long-term growth opportunities created by the combined company,” said Mark Alles, Chairman and Chief Executive Officer of Celgene. “Our employees should be incredibly proud of what we have accomplished together and excited for the opportunities ahead of us as we join with Bristol-Myers Squibb, where we can further advance our mission for patients. We look forward to working with the Bristol-Myers Squibb team as we bring our two companies together.”

Compelling Strategic Benefits

  • Leading franchises with complementary product portfolios provide enhanced scale and balance. The combination creates:
    • Leading oncology franchises in both solid tumors and hematologic malignancies led by Opdivo and Yervoy as well as Revlimid and Pomalyst;
    • A top five immunology and inflammation franchise led by Orencia and Otezla; and
    • The #1 cardiovascular franchise led by Eliquis.

The combined company will have nine products with more than $1 billion in annual sales and significant potential for growth in the core disease areas of oncology, immunology and inflammation and cardiovascular disease.

  • Near-term launch opportunities representing greater than $15 billion in revenue potential. The combined company will have six expected near-term product launches:
    • Two in immunology and inflammation, TYK2 and ozanimod; and
    • Four in hematology, luspatercept, liso-cel (JCAR017), bb2121 and fedratinib.

These launches leverage the combined commercial capabilities of the two companies and will broaden and enhance Bristol-Myers Squibb’s market position with innovative and differentiated products. This is in addition to a significant number of lifecycle management registrational readouts expected in Immuno-Oncology (IO).

  • Early-stage pipeline builds sustainable platform for growth. The combined company will have a deep and diverse early-stage pipeline across solid tumors and hematologic malignancies, immunology and inflammation, cardiovascular disease and fibrotic disease leveraging combined strengths in innovation. The early-stage pipeline includes 50 high potential assets, many with important data readouts in the near-term. With a significantly enhanced early-stage pipeline, Bristol-Myers Squibb will be well positioned for long-term growth and significant value creation.
  • Powerful combined discovery capabilities with world-class expertise in a broad range of modalities. Together, the Company will have expanded innovation capabilities in small molecule design, biologics/synthetic biologics, protein homeostasis, antibody engineering and cell therapy. Furthermore, strong external partnerships provide access to additional modalities.

Compelling Financial Benefits

  • Strong returns and significant immediate EPS accretion. The transaction’s internal rate of return is expected to be well in excess of Celgene’s and Bristol-Myers Squibb’s cost of capital. The combination is expected to be more than 40 percent accretive to Bristol-Myers Squibb’s EPS on a standalone basis in the first full year following close of the transaction.
  • Strong balance sheet and cash flow generation to enable significant investment in innovation. With more than $45 billion of expected free cash flow generation over the first three full years post-closing, the Company is committed to maintaining strong investment grade credit ratings while continuing its dividend policy for the benefit of Bristol-Myers Squibb and Celgene shareholders. Bristol-Myers Squibb will also have significant financial flexibility to realize the full potential of the enhanced late- and early-stage pipeline.
  • Meaningful cost synergies. Bristol-Myers Squibb expects to realize run-rate cost synergies of approximately $2.5 billion by 2022. Bristol-Myers Squibb is confident it will achieve efficiencies across the organization while maintaining a strong, core commitment to innovation and delivering the value of the portfolio.

Terms and Financing

Based on the closing price of Bristol-Myers Squibb stock on January 2, 2019, the cash and stock consideration to be received by Celgene shareholders is valued at $102.43 per share. The cash and stock consideration represents an approximately 51 percent premium to Celgene shareholders based on the 30-day volume weighted average closing stock price of Celgene prior to signing and an approximately 54 percent premium to Celgene shareholders based on the closing stock price of Celgene on January 2, 2019. Each share also will receive one tradeable CVR, which will entitle its holder to receive a one-time potential payment of $9.00 in cash upon FDA approval of all three of ozanimod (by December 31, 2020), liso-cel (JCAR017) (by December 31, 2020) and bb2121 (by March 31, 2021), in each case for a specified indication.

The transaction is not subject to a financing condition. The cash portion will be funded through a combination of cash on hand and debt financing. Bristol-Myers Squibb has obtained fully committed debt financing from Morgan Stanley Senior Funding, Inc. and MUFG Bank, Ltd. Following the close of the transaction, Bristol-Myers Squibb expects that substantially all of the debt of the combined company will be pari passu.

Accelerated Share Repurchase Program

Bristol-Myers Squibb expects to execute an accelerated share repurchase program of up to approximately $5 billion, subject to the closing of the transaction, market conditions and Board approval.

Corporate Governance

Following the close of the transaction, Dr. Caforio will continue to serve as Chairman of the Board and Chief Executive Officer of the company. Two members from Celgene’s Board will be added to the Board of Directors of Bristol-Myers Squibb. The combined company will continue to have a strong presence throughout New Jersey.

Approvals and Timing to Close

The transaction is subject to approval by Bristol-Myers Squibb and Celgene shareholders and the satisfaction of customary closing conditions and regulatory approvals. Bristol-Myers Squibb and Celgene expect to complete the transaction in the third quarter of 2019.

Advisors

Morgan Stanley & Co. LLC is serving as lead financial advisor to Bristol-Myers Squibb, and Evercore and Dyal Co. LLC are serving as financial advisors to Bristol-Myers Squibb. Kirkland & Ellis LLP is serving as Bristol-Myers Squibb’s legal counsel. J.P. Morgan Securities LLC is serving as lead financial advisor and Citi is acting as financial advisor to Celgene. Wachtell, Lipton, Rosen & Katz is serving as legal counsel to Celgene.

Bristol-Myers Squibb 2019 EPS Guidance

In a separate press release issued today, Bristol-Myers Squibb announced its 2019 EPS guidance for full-year 2019, which is available on the “Investor Relations” section of the Bristol-Myers Squibb website at https://www.bms.com/investors.html.

Conference Call

Bristol-Myers Squibb and Celgene will host a conference call today, at 8:00 a.m. ET to discuss the transaction. The conference call can be accessed by dialing (800) 347-6311 (U.S. / Canada) or (786) 460-7199 (International) and giving the passcode 4935567. A replay of the call will be available from January 3, 2019 until January 17, 2019 by dialing (888) 203-1112 (U.S. / Canada) or (719) 457-0820 (International) and giving the passcode 4935567.

A live webcast of the conference call will be available on the investor relations section of each company’s website at Bristol-Myers Squibb https://www.bms.com/investors.html and Celgene https://ir.celgene.com/investors/default.aspx.

Presentation and Infographic

Associated presentation materials and an infographic regarding the transaction will be available on the investor relations section of each company’s website at Bristol-Myers Squibb https://www.bms.com/investors.html and Celgene https://ir.celgene.com/investors/default.aspx as well as a joint transaction website at www.bestofbiopharma.com.

2.  Then through news on Bloomberg and some other financial sites on a possible interest of a merged Celgene-Bristol Myers from Pfizer as well as other pharma groups

Here’s How John Paulson Is Positioning His Celgene/Bristol Trade

Billionaire John Paulson sees a 10 percent to 20 percent chance that Bristol-Myers Squibb Co. receives a takeover bid and he’s positioning his Celgene Corp. trade based on that risk, he said in an interview on Mike Samuels’ “According to Sources” podcast.

Bristol-Myers “is vulnerable and it has an attractive pipeline to several potential acquirers,” Paulson said in the podcast released Monday. “It’s a reasonable probability,” he said. “You have to be prepared someone may show up. It’s an attractive spread, but you can’t take that big a position.”

John Paulson

Photographer: Jin Lee/Bloomberg

Paulson has the Celgene/Bristol-Myers trade as a 3 percent portfolio position, though his firm is short a pharma index rather than Bristol-Myers for about half of the position. If an activist did show up, it would likely blow out the spread from its current $13.85 to probably $20 and, if an actual bid arrived, he said the spread could move out to $40.

“I just don’t feel comfortable being short Bristol in this environment,” Paulson said. “You can sort of get the same economics by shorting an index, maybe even do better because, since Bristol came down, if the pharma sector goes up, Bristol may go up more than the pharma sector, which would increase the profitability on the Celgene. ”

Celgene fell as much as 2.2 percent on Tuesday, its biggest intraday drop since Dec. 27. Bristol-Myers also sank as much as 2.2 percent, the most since Jan. 9.

The question of whether Bristol-Myers receives a hostile takeover offerhas been the top issue for investors since the Celgene deal was announced. The drugmaker was pressured in February 2017 to add three new directors after holding talks with activist hedge fund Jana Partners LLC. The same month, the Wall Street Journal reported that Carl Icahn had taken a stake and saw Bristol-Myers as a takeover target.

Pfizer Inc., AbbVie Inc. or Amgen Inc. “make varying amounts of sense as suitors, though we see many barriers to someone making an offer,” Credit Suisse analyst Vamil Divan wrote in a note earlier this month. AbbVie and Amgen “have the balance sheet strength and could look to beef up their oncology presence.”

CNBC’s David Faber said Jan. 3 — the day the Celgene deal was announced — that there had been “absolutely” no talks between Bristol-Myers and potential acquirers.

Jefferies analyst Michael Yee wrote in note Tuesday that he doesn’t expect an unsolicited offer for Bristol-Myers to “thwart” its Celgene purchase. He sees the deal spread as “quite attractive” again at the current range of 18 percent to 20 percent after it had earlier narrowed to 11 percent to 12 percent.

Paulson managed about $8.7 billion at the the beginning of November.

From StatNews.com at https://www.statnews.com/2019/01/22/celgene-legacy-chutzpah-science-drug-pricing/


Nina Kjellson was just two years out of college, working as a research associate at Oracle Partners, a hedge fund in New York, when a cabbie gave her a stock tip. There was a company in New Jersey, he told her, trying to resurrect thalidomide, a drug that was infamous for causing severe birth defects, as a treatment for cancer.

Kjellson was born in Finland, where the memory of thalidomide, which was given to mothers to treat morning sickness but led to babies born without arms or legs, was particularly raw because the drug hit Northern Europe hard. But she was on the hunt for new cancer drugs, and her interest was piqued. She ended up investing a small amount of her own money in Celgene. That was 1999.

Since then, Celgene shares have risen more than 100-fold; the company became one of the largest biotechnology firms in the world. Earlier this month, rival Bristol-Myers Squibb announced plans to purchase Celgene for $74 billion in cash and stock.

Reflecting on a company she watched for two decades, Kjellson, now a venture capitalist at Canaan Partners in San Francisco, marveled at the “grit and chutzpah” that it took to push thalidomide back onto the market. “The company started taking off,” she remembered, “but not without an incredible reversal.” Celgene faced resistance from some thalidomide victims, and the Food and Drug Administration was lobbied not to revive the drug. In the end, she said, it built a golden egg and became a favorite partner of smaller biotech companies like the ones she funds. And it populated the rest of the pharmaceutical industry with its alumni. “If I had a nickel for every company that says we want to do Celgene-like deals,” she said, “I’d have better returns than from my venture career.”

But there’s another side to Celgene. When the company launched thalidomide as a treatment for leprosy in 1998, it cost $6 a pill. As it became clear that it was also an effective cancer drug, Celgene slowly raised the price, quadrupling it by the time it received approval for an improved molecule, Revlimid. Then, it slowly increased the price of Revlimid by a total of 145 percent, according to Sector & Sovereign LLC, a pharmaceutical consultancy.

Revlimid now costs $693 a pill. In 2017, Revlimid and another thalidomide-derived cancer drug represented 76 percent of Celgene’s $12.9 billion in annual sales. Kjellson gives the company credit for guts in science, for taking a terrible drug and resurrecting it. But it also had chutzpah when it came to what it charged.

A pioneer in ‘modern pricing’

How did the price of thalidomide, and then Revlimid, increase so much? Celgene explained it in a 2004 front-page story in the Wall Street Journal. “When we launched it, it was going to be an AIDS-wasting drug,” Celgene’s chief executive at the time, John Jackson, said. “We couldn’t charge more or there would have been demonstrations outside the company.” But once Celgene realized that the drug was a cancer treatment, the company decided to slowly bring thalidomide’s price more in line with other cancer medicines, such as Velcade, a rival medicine now sold by the Japanese drug giant Takeda. In 2003, it cost more than twice as much as thalidomide. “By bringing [the price] up every year, it was heading toward where it should be as a cancer drug,” Jackson told the Journal.

Thalidomide was not actually approved as a myeloma treatment until 2006. That same year, Revlimid, which causes less sleepiness and nerve pain than thalidomide, was approved, and Barer, the chemist behind Celgene’s thalidomide strategy, took over as chief executive. He made good on thalidomide’s promise, churning out one blockbuster after another. In 2017 Revlimid generated $8.2 billion. Another cancer drug derived from thalidomide, Pomalyst, generated $1.6 billion. Otezla, a very different drug also based on thalidomide’s chemistry, treats psoriasis and psoriatic arthritis. Its 2017 sales: $1.3 billion.

With persistent price increases, quarter after quarter, Celgene pioneered something else: what Wall Street calls “modern pricing.” Cancer drug prices have risen inexorably.


Updated 2/28/2019

From FiercePharma.com

BMS’ largest investor condemns Celgene deal—and it’s music to activists’ ears

Activist investor Starboard Value is officially rallying the troops against Bristol-Myers Squibb’s $74 billion Celgene deal, and thanks to a big investor’s thumbs-down, it’ll have more support than some expected. But the question is whether it’ll be enough to scuttle the merger.

Starboard CEO Jeffrey Smith penned a letter (PDF) to Bristol-Myers’ shareholders on Thursday labeling the transaction “poorly conceived and ill-advised.” It intends to vote its shares—which number 1.63 million, though the hedge fund is seeking more—against the deal, and it wants to see other shareholders do the same. It’ll be filing proxy materials “in the coming days” to solicit “no” votes from BMS investors, Smith said.

Starboard picked up its stake early this year after the deal was announced, BMS confirmed last week, but until now, the activist fund hasn’t been forthcoming about its intentions. But the timing of its reveal is likely no coincidence; just Wednesday, Wellington Management—which owns about 8% of Bristol-Myers’ shares and ranked as its largest institutional shareholder as of earlier this week—came out publicly against the “risky” buyout.

But while “we believe it is possible at least one other long-term top-five [shareholder] may disagree with the transaction, too,” RBC Capital Markets’ Michael Yee wrote in his own investor note, he—as many of his fellow analysts do—still expects to see the deal go through. “We think the vast majority of the acquirer holder base that would not like the deal already voted by selling their shares earlier, leaving investors who are mostly supportive of the deal,” he wrote.

Meanwhile, Starboard has been clear about one other thing: It wants board seats. It’s nominated five new directors, including CEO Smith, and investors will vote on that group at an as-yet-unscheduled meeting. Thing is, that meeting will take place after BMS investors vote on the Celgene deal in April, so Starboard will have to rally sufficient support against the deal if it wants to see them installed.

The “probability of a third-party buyer for Bristol-Myers Squibb” before the April vote is “very low,” BMO Capital Markets analysts wrote recently, adding that “we do not believe a potential activist can change that.” Barclays analysts agreed Wednesday, pointing to a “lack of realistic, potential alternatives that could collectively provide a similar level of upside.”

Updated 4/12/2019

Bristol-Myers Squibb Shareholders Approve Celgene Tie-Up

Three quarters of Bristol-Myers Squibb shareholders vote to approve the deal with Celgene, paving the way for the largest pharmaceutical takeover in history.

Bristol-Myers Squibb (BMY – Get Report) on Friday announced that it had secured enough shareholder votes to approve its roughly $74 billion takeover of Celgene (CELG – Get Report) , putting the company closer to finalizing the largest pharmaceutical merger in history.

More than 75% of Bristol-Myers shareholders voted to approve the deal, according to a preliminary tally announced by Bristol-Myers on Friday.

Bristol-Myers’ position took a positive turn in late March after an influential shareholder advisory group recommended investors vote in favor of the cancer drug specialist’s takeover,  and a key activist dropped its opposition to the deal.

Institutional Shareholder Services recommended the deal, which had been challenged by key Bristol-Myers shareholders Starboard Value and Wellington Management, ahead of Friday’s vote.


Updated 6/24/2019

Bristol Myers agrees to sell off Celgene blockbuster psoriasis and arthritis drug Otezla to satisfy FTC in hopes to speed up merger

By SY MUKHERJEE

June 24, 2019

Happy Monday, readers!

Bristol-Myers Squibb hasn’t exactly had a pristine path to its proposed acquisition of Celgene. Sure, the legacy pharma giant racked up more than 75% of shareholder votes to approve the $74 billion acquisition following a quickly-quashed rebellion from some activist naysayers. But the company hit another hurdle in its Celgene acquisition quest that sent Bristol Myers stock tumbling nearly 7.5%, a $6 billion erasure in market value.

The reason(s)? For one, Bristol-Myers Squibb reported an unfortunate clinical trial result from a late-stage study of its cancer immunotherapy superstar Opdivo in liver cancer. For another—BMS made a somewhat surprising announcement that it would spin off Celgene’s blockbuster psoriasis and arthritis drug Otezla, slated to rake in nearly $2 billion in sales this year alone, in order to address Federal Trade Commission (FTC) antitrust concerns over the M&A.

That means the Bristol-Myers Celgene deal may not close until early 2020, rather than the originally expected timeline by the end of this year.

“Bristol-Myers Squibb reaffirms the significant value creation opportunity of the acquisition of Celgene,” the firm said in a statement. “Together with $2.5 billion of cost synergies, a compelling pipeline and a strong portfolio of marketed products, the company continues to expect growth in sales and earnings through 2025.”

Investors can be a fickle bunch. For now, though, they don’t seem particularly pleased at the decision to lop off one of Celgene’s tried and true cash cows.


Additional posts on Pharma Mergers and Deals on this Open Access Journal include:

Live Conference Coverage Medcity Converge 2018 Philadelphia: Clinical Trials and Mega Health Mergers

First Annual FierceBiotech Drug Development Forum (DDF). Event covers the drug development process from basic research through clinical trials. InterContinental Hotel, Boston, September 19-21, 2016.

Pfizer Near Allergan Buyout Deal But Will Fed Allow It?

New Values for Capital Investment in Technology Disruption: Life Sciences Group @Google and the Future of the Rest of the Biotech Industry

Mapping the Universe of Pharmaceutical Business Intelligence: The Model developed by LPBI and the Model of Best Practices LLC


Read Full Post »

Reporter: Gail S. Thornton


From The Wall Street Journal (www.wsj.com)

Published January 9, 2019

Health-Care CEOs Outline Strategies at J.P. Morgan Conference

Chiefs at Johnson & Johnson, CVS discuss what’s next on a range of industry issues

One of the biggest health conferences of the year for investors, the J.P. Morgan Health-Care Conference, is taking place this week in San Francisco. Here are some of the hot topics covered at the four-day event, which wraps up Thursday.

BioMarin Mulls Payment Plans

BioMarin Pharmaceutical Inc. CEO Jean-Jacques Bienaimé said he would consider pursuing installment payment arrangements for the biotech’s experimental gene therapy for hemophilia. At the conference, Mr. Bienaimé told the Wall Street Journal that the one-time infusion, Valrox, is likely to cost in the millions because studies have shown it can eliminate bleeding episodes in patients, and current hemophilia treatments taken chronically can cost millions over several years. “We’re not trying to charge more than existing therapies,” he said. “We want to offer a better treatment at the same or lower cost.”

Johnson & Johnson Warns on Pricing

As politicians hammer drug prices, Johnson & Johnson CEO Alex Gorsky suggested companies need to police themselves. At the conference, Mr. Gorsky told investors that drug companies should price drugs reasonably and be transparent. “If we don’t do this as an industry, I think there will be other alternatives that will be more onerous for us,” Mr. Gorsky says. Some drugmakers pulled back from price increases in mid-2018 amid heightened political scrutiny, but prices went up for many drugs at the start of 2019.

Marijuana-Derived Drugs Show Promise


CVS Discusses New Stores

CVS Health Corp. Chief Executive Larry Merlo began showing initial concepts the company will be testing as it begins piloting new models of its drugstores that incorporate its Aetna combination. The first new test store will open next month in Houston, he told investors, and it will include expanded health-care services including a new concierge who will help patients with questions. 

Aetna Savings On the Way

Mr. Merlo also spelled out when the company will achieve the initial $750 million in synergies it has promised from the CVS-Aetna deal. In the first quarter, he said the company will see benefits from consolidating corporate functions. Savings from procurement and aligning lists of covered drugs should be seen in the first half, he says. Medical-cost savings will start affecting results toward the end of the year, he noted. 

Lilly Cuts Price

Drugmaker Eli Lilly & Co. expects average net US pricing for its drugs–after rebates and discounts–to decline in the low- to mid-single digits on a percentage basis this year, Chief Financial Officer Josh Smiley told the Journal. Lilly’s net prices had risen during the first half of 2018, but dropped in the third quarter as the company took a “restrained approach,” Mr. Smiley said. Lilly, which hasn’t yet reported fourth-quarter results, took some list price increases for cancer drugs in late December but hasn’t raised prices in the new year, he said.

Peter Loftus at peter.loftus@wsj.com and Anna Wilde Mathews at anna.mathews@wsj.com

Read Full Post »

Reporter: Gail S. Thornton

This article appeared on the web site of Harley Street Concierge, one of the U.K.’s leading independent providers of clinical, practical and emotion support for cancer patients. 

Cancer at Work: An Interview With Barbara Wilson

Whether you’re supporting an employee through cancer at work. Or you’re a cancer patient struggling to get the support you need. Either way, this Q and A with Barbara Wilson will help you out. Read on for a glimpse into Barbara’s personal experience with breast cancer. Find out where companies are falling short of supporting employees. Discover what you need to do if you’re feeling unsupported at work. And learn what’s unacceptable for Barbara in a modern and civilised society.

In a 2013 interview about cancer at work, you expressed amazement at “the lack of understanding there is about cancer. And what the impact is on individuals”. How would you say this has improved in the last 4 years? And what do you feel still needs to change?

There’s greater awareness and understanding about cancer at work. More organisations are aware of the difficulties people face. But many organisations don’t appreciate that recovery isn’t straightforward or quick. They also tend to rely on generic return to work policies. And these are inappropriate when it comes to supporting people recovering from cancer. A lot still depends on how far the local line manager is prepared to support an employee. And whether they’ll bend rules if need be about leave or sick pay.

You were diagnosed with breast cancer in 2005 and given the all clear in 2010. What did you learn about yourself through treatment and recovery?


I learned that I wasn’t immortal or superhuman! And also that life is precious and so it’s important to make the best of it. That doesn’t actually mean counting off things on your bucket list. Or living each day as if it’s your last. It’s about appreciating what you have, family, friends and the sheer joy of being alive.

“Life is precious. It’s about appreciating what you have, family, friends and the sheer joy of being alive.”

It’s a common misperception that people in remission want more family time or to travel the world. What reasons do your clients share with you for wanting to get back to work?

Yes. Before I had cancer, I remember asking a terminally ill employee why she still wanted to work. And she worked until a fortnight before her death. The simple answer is that it’s about feeling normal. Using your brain. Being with friends and colleagues rather than on your own. And losing yourself in your work. There are also financial reasons. But typically – and I can say this based on my own experience – it’s about being ‘you’ again rather than a cancer patient.

“I remember asking a terminally ill employee why she still wanted to work. And she worked until a fortnight before her death. Typically – and I can say this based on my own experience – it’s about being ‘you’ again rather than a cancer patient.”

You share tips for employers and HR professionals in this article for Macmillan. And you set out how to support a colleague during and after cancer treatment. What would you say to an employee who isn’t feeling supported by their employer or colleagues in this way?

In my experience there are two main reasons why people often aren’t supported.

1. Bosses and colleagues don’t understand the full impact of cancer treatment. They won’t understand what fatigue is or chemo brain or peripheral neuropathy. So they often expect people to get ‘back to normal’ work after 6 to 8 weeks. But recovery can take many months. This isn’t helped by the person often looking fit and well.

2. People don’t like talking about cancer at work. They feel awkward. And as a result often decide to say nothing. We advise people to be open from the outset. To understand their right to reasonable adjustments. And their responsibility to update their employer about their recovery and support needs. Employees recovering from cancer often have to take the lead. They have to guide their colleagues about the specific help they need. You can’t expect others to do it for you. It sounds wrong but that’s how it is.

“Bosses and colleagues often expect people to get ‘back to normal’ work after 6 to 8 weeks. But recovery can take many months. “

More than 100,000 people had to wait more than 2 weeks to see a cancer specialist in the UK last year. 25,153 had to wait more than 62 days to start treatment. What’s your reaction to these statistics?

It’s shocking. The worry for patients and their families during this period is totally debilitating. And on top of this it means that the cancer is growing unchecked. Where the cancer is aggressive, the delay may threaten lives. And it will certainly add to the overall costs of care. We really have to address this. It’s just not acceptable in a modern and civilised society.

“The worry for patients and their families during this period is totally debilitating. We really have to address this.”

Finally, can you tell us more about Working With Cancer?

Working With Cancer is a social enterprise and was established in June 2014. We support people affected by cancer to lead fulfilling and rewarding working lives. That means helping people to successfully return to work or remain in work. Or sometimes it’s about helping people to find work – depending on their personal needs. We work with corporate, charities and other third sector organisations to support people throughout the UK.

We coach people diagnosed with cancer to re-establish their working lives. And we train employers to understand how to manage work and cancer. We’ll advise teams about how to support a colleague affected by cancer. And we help carers juggle work whilst supporting their loved ones. Working With Cancer also helps organisations to update or improve their policies.

Barbara Wilson - Cancer at Work

About Barbara Wilson

Barbara Wilson is a senior HR professional with almost 40 years’ experience.  Roles include Group Head of Strategic HR at Catlin Group Ltd. Deputy Head of HR at Schroders Investment Management. And Chief of Staff to the Group HR Director at Barclays. After a breast cancer diagnosis, Barbara launched Working With Cancer. It’s a Social Enterprise providing coaching, training and consultancy to employers, employees, carers and health professionals.


For more information about Working With Cancer, click here to visit the websiteFollow this link to connect with Barbara on Twitter. Email admin@workingwithcancer.co.uk. Or call 07508 232257 or 07919 147784.


SOURCE

https://harleystreetconcierge.com/cancer-at-work/

Other posts on the JP Morgan 2019 Healthcare Conference on this Open Access Journal include:

2018

Top 10 Cancer Research Priorities

https://pharmaceuticalintelligence.com/2018/12/24/top-10-cancer-research-priorities/

Innovation + Technology = Good Patient Experience

https://pharmaceuticalintelligence.com/2018/12/24/innovation-technology-good-patient-experience/

2017

Inspiring Book for ALL Cancer Survivors, ALL Cancer Patients and ALL Cardiac Patients – The VOICES of Patients, Hospitals CEOs, Health Care Providers, Caregivers and Families: Personal Experience with Critical Care and Invasive Medical Procedures

https://pharmaceuticalintelligence.com/2017/10/24/inspiring-book-for-all-cancer-survivors-all-cancer-patients-and-all-cardiac-patients-the-voices-of-patients-hospitals-ceos-health-care-providers-caregivers-and-families-personal-experience-with/

2016

Funding Opportunities for Cancer Research

https://pharmaceuticalintelligence.com/2016/12/08/funding-opportunities-for-cancer-research/

2012

The Incentive for “Imaging based cancer patient’ management”

https://pharmaceuticalintelligence.com/2012/08/27/the-incentive-for-imaging-based-cancer-patient-management/

Read Full Post »

« Newer Posts - Older Posts »