Healthcare analytics, AI solutions for biological big data, providing an AI platform for the biotech, life sciences, medical and pharmaceutical industries, as well as for related technological approaches, i.e., curation and text analysis with machine learning and other activities related to AI applications to these industries.
Individual brain cells within a neural network are highlighted in this image obtained using a fluorescent imaging technique (credit: Sandra Kuhlman/CMU)
Carnegie Mellon University is embarking on a five-year, $12 million research effort to reverse-engineer the brain and “make computers think more like humans,” funded by the U.S. Intelligence Advanced Research Projects Activity (IARPA). The research is led by Tai Sing Lee, a professor in the Computer Science Department and the Center for the Neural Basis of Cognition (CNBC).
A “Human Genome Project” for the brain’s visual system
“MICrONS is similar in design and scope to the Human Genome Project, which first sequenced and mapped all human genes,” Lee said. “Its impact will likely be long-lasting and promises to be a game changer in neuroscience and artificial intelligence.”
The researchers will attempt to discover the principles and rules the brain’s visual system uses to process information. They believe this deeper understanding could serve as a springboard to revolutionize machine learning algorithms and computer vision.
In particular, the researchers seek to improve the performance of artificial neural networks — computational models for artificial intelligence inspired by the central nervous systems of animals. Interest in neural nets has recently undergone a resurgence thanks to growing computational power and datasets. Neural nets now are used in a wide variety of applications in which computers can learn to recognize faces, understand speech and handwriting, make decisions for self-driving cars, perform automated trading and detect financial fraud.
How neurons in one region of the visual cortex behave
“But today’s neural nets use algorithms that were essentially developed in the early 1980s,” Lee said. “Powerful as they are, they still aren’t nearly as efficient or powerful as those used by the human brain. For instance, to learn to recognize an object, a computer might need to be shown thousands of labeled examples and taught in a supervised manner, while a person would require only a handful and might not need supervision.”
To better understand the brain’s connections, Sandra Kuhlman, assistant professor of biological sciences at Carnegie Mellon and the CNBC, will use a technique called “two-photon calcium imaging microscopy” to record signaling of tens of thousands of individual neurons in mice as they process visual information, an unprecedented feat. In the past, only a single neuron, or tens of neurons, typically have been sampled in an experiment, she noted.
“By incorporating molecular sensors to monitor neural activity in combination with sophisticated optical methods, it is now possible to simultaneously track the neural dynamics of most, if not all, of the neurons within a brain region,” Kuhlman said. “As a result we will produce a massive dataset that will give us a detailed picture of how neurons in one region of the visual cortex behave.”
A multi-institution research team
Other collaborators are Alan Yuille, the Bloomberg Distinguished Professor of Cognitive Science and Computer Science at Johns Hopkins University, and another MICrONS team at the Wyss Institute for Biologically Inspired Engineering, led by George Church, professor of genetics at Harvard Medical School.
The Harvard-led team, working with investigators at Cold Spring Harbor Laboratory, MIT, and Columbia University, is developing revolutionary techniques to reconstruct the complete circuitry of the neurons recorded at CMU. The database, along with two other databases contributed by other MICrONS teams, unprecedented in scale, will be made publicly available for research groups all over the world.
In this MICrONS project, CMU researchers and their collaborators in other universities will use these massive databases to evaluate a number of computational and learning models as they improve their understanding of the brain’s computational principles and reverse-engineer the data to build better computer algorithms for learning and pattern recognition.
“The hope is that this knowledge will lead to the development of a new generation of machine learning algorithms that will allow AI machines to learn without supervision and from a few examples, which are hallmarks of human intelligence,” Lee said.
The CNBC is a collaborative center between Carnegie Mellon and the University of Pittsburgh. BrainHub is a neuroscience research initiative that brings together the university’s strengths in biology, computer science, psychology, statistics and engineering to foster research on understanding how the structure and activity of the brain give rise to complex behaviors.
The MICrONS team at CMU allso includes Abhinav Gupta, assistant professor of robotics; Gary Miller, professor of computer science; Rob Kass, professor of statistics and machine learning and interim co-director of the CNBC; Byron Yu, associate professor of electrical and computer engineering and biomedical engineering and the CNBC; Steve Chase, assistant professor of biomedical engineering and the CNBC; and Ruslan Salakhutdinov, one of the co-creators of the deep belief network, a new model of machine learning that was inspired by recurrent connections in the brain, who will join CMU as an assistant professor of machine learning in the fall.
Other members of the team include Brent Doiron, associate professor of mathematics at Pitt, and Spencer Smith, assistant professor of neuroscience and neuro-engineering at the University of North Carolina.
Not all machine-intelligence experts are on board with reverse-engineering the brain. In a Facebook post today, Yann LeCun, Director of AI Research at Facebook and a professor at New York University, asked the question in a recent lecture, “Should we copy the brain to build intelligent machines?” “My answer was ‘no, because we need to understand the underlying principles of intelligence to know what to copy. But we should draw inspiration from biology.’”
Tools for evaluation of disease activity in patients with anti-neutrophil cytoplasmic antibodies (ANCA)-associated vasculitis (AAV) include scoring clinical manifestations, determination of biochemical parameters of inflammation, and obtaining tissue biopsies. These tools, however, are sometimes inconclusive. 2-deoxy-2-[18F]-fluoro-D-glucose (FDG) positron emission tomography (PET) scans are commonly used to detect inflammatory or malignant lesions. Our objective is to explore the ability of PET scanning to assess the extent of disease activity in patients with AAV.
Consecutive PET scans made between December 2006 and March 2014 in Maastricht (MUMC) and between July 2008 and June 2013 in Brussels (EUH) to assess disease activity in patients with AAV were retrospectively included. Scans were re-examined and quantitatively scored using maximum standard uptake values (SUVmax). PET findings were compared with C-reactive protein (CRP) and ANCA positivity at the time of scanning.
Forty-four scans were performed in 33 patients during a period of suspected active disease. All but 2 scans showed PET-positive sites, most commonly the nasopharynx (n = 22) and the lung (n = 22). Forty-one clinically occult lesions were found, including the thyroid gland (n = 4 patients), aorta (n = 8), and bone marrow (n = 7). The amount of hotspots, but not the highest observed SUVmax value, was higher if CRP levels were elevated. Seventeen follow-up scans were made in 13 patients and showed decreased SUVmax values.
FDG PET scans in AAV patients with active disease show positive findings in multiple sites of the body even when biochemical parameters are inconclusive, including sites clinically unsuspected and difficult to assess otherwise.
Granulomatosis with polyangiitis (GPA; Wegener’s) is an inflammatory disease entity affecting small to medium vessels. It is, together with microscopic polyangiitis (MPA) and eosinophilic granulomatosis with polyangiitis (EGPA; Churg Strauss Syndrome), characterized by the presence of anti-neutrophil cytoplasmic antibodies (ANCA) and they are frequently grouped together under the term ANCA-associated vasculitis (AAV).1
Early diagnosis and assessment of the extent of disease activity are important for adequate therapeutic decisions.1 Multiple tools may be helpful, such as biochemical parameters of inflammation, imaging techniques, and tissue biopsies. Even though these tools suffice to diagnose active disease in most episodes, the results can sometimes be inconclusive. In particular, it is sometimes problematic to determine whether symptoms are due to active disease, vasculitic damage, and/or treatment-related side-effects.
2-deoxy-2-[18F]-fluoro-D-glucose (FDG) positron emission tomography (PET) scanning is used for detecting high glucose metabolism in malignancies, infectious, and auto-immune diseases.2–4 Co-registration with computed tomography (CT) allows the increased FDG uptake to be localized to the underlying anatomy. PET scanning has been proven to be a useful diagnostic tool in large vessel vasculitis.5–8 PET scanning can visualize glucose-consuming inflamed vessels, provided that their diameter is >4 mm. The limited spatial resolution was previously thought to be insufficient to detect the involvement of small- and medium-size vessels.6,7 Recent studies, however, have shown that PET scans show abnormalities in patients with ANCA-associated vasculitis.9–11 This novel imaging technique may therefore be a useful tool for diagnosing active disease and, in addition, to assess the severity and the extent of the disease. The latter may be relevant to detect occult diagnostic biopsy sites as previously demonstrated in sarcoidosis.12
The objective of our study is to explore the ability of PET scanning to assess the extent of disease activity in patients with AAV.
Study Population
Consecutive PET scans were performed in patients with AAV at Maastricht University Medical Center (MUMC) between December 2006 and March 2014 and at Erasme University Hospital (EUH) in Brussels between July 2008 and June 2013 and were retrospectively included. All patients fulfilled a diagnosis of GPA according to the 2012 revised International Chapel Hill Consensus Conference Nomenclature.13 Patients were previously treated according to the recommendations of the European League Against Rheumatism (EULAR).14 Disease states were defined according to the EULAR recommendations.15 A PET scan was performed in patients with clinically suspected disease activity (diagnosis or relapse), whereas other tools for evaluation of activity were inconclusive. The possibility of an active bacterial or viral infection was excluded by culture, serology, and persistence of symptoms despite empirical antibiotic treatment. This study was carried out in compliance with the Helsinki Declaration.
Diagnostic Parameters
An extensive diagnostic work-up was done in all cases, including analysis of clinical features, laboratory assessment, imaging techniques, and, if appropriate, a biopsy. Laboratory assessment included high-sensitivity C-reactive protein (CRP, cutoff value ≥10 ng/mL) levels, ANCA levels, and urine analysis at the time of scanning. Hematuria was defined as ≥10 erythrocytes in a urinary sediment, combined with dysmorphic erythrocytes and/or red blood cell casts. In Maastricht, ANCA levels were determined using the Fluorescent-Enzyme Immuno-Assay (FEIA) method.16 FEIA detection for both proteinase-3 (PR3) and myeloperoxidase (MPO) antibodies were fully automated as performed in a UniCAP 100 (Pharmacia Diagnostics). Values ≥10 AU were considered positive.
A whole-body [18F]-FDG-PET/CT scan was performed in both centers. In Maastricht, a Gemini_ PET-CT (Philips Medical Systems) scanner with time-of-flight (TOF) capability was used, together with a 64-slice Brilliance CT scanner. This scanner has a transverse and axial Field of View (FOV) of 57.6 and 18 cm, respectively. The spatial resolution is around 5 mm. In Brussels, a Gemini_ PET-CT (Philips Medical Systems) scanner was used without TOF capability, but with the same PET FOV and spatial resolution, together with a 16-slice Brilliance CT scanner.
Patient Characteristics
Thirty-three patients were included; an overview of the patient characteristics is shown in Table 1. Twenty patients were positive for PR3-ANCA at diagnosis, 9 patients for MPO-ANCA, and 4 patients were ANCA-negative.
Forty-four PET scans were made during an episode of suspected disease activity (Table 2). Eleven scans were performed at diagnosis and 33 scans at a suspected relapse. The suspected relapses occurred after a median of 68 (30–113) months since diagnosis. In 5 patients, ≥2 consecutive episodes occurred during which a PET scan was performed. These patients were in remission between episodes.
Results of PET Scans During Suspected Disease Activity
All PET scans during an episode of suspected disease activity except 2 revealed enhanced non-physiological FDG uptake. Table 3 shows the anatomic location of the positive sites and the corresponding median SUVmax values. The majority of these sites disclosed a SUVmax value between >2.5 and <6. Examples of PET/CT images of patients with AAV are shown in Figures 1 and Figures 2.
In our study, PET scans in AAV patients revealed positive findings in multiple sites of the body, including sites not clinically suspected and difficult to assess otherwise. PET scans may show FDG-positive findings during episodes in which other tools for evaluation of disease activity are inconclusive.
Similar to our findings using Gallium-67 [67Ga] scintigraphy17 in patients with GPA, PET scans seem to be a sensitive tool to assess disease activity. In our current study, all but 2 scans showed non-physiological FDG uptake during an episode of clinically suspected disease activity. Compared with gallium scanning, however, PET scanning offers additional information. First, Gallium scintigraphy suffers from practical limitations, such as the required interval between time of injection of the radiopharmaceuticals and time of scanning (48–72 hours) and the high radiation exposure. Second, the spatial resolution is higher in PET scans. Third, a low-dose CT scan may be used concomitantly to correlate the FDG uptake with the precise anatomical location. In sarcoidosis, PET scans are of value in detecting occult diagnostic biopsy sites.12 In our cohort, 41 clinically occult sites were found on the PET scan, and in 1 patient this resulted in a diagnostic biopsy.9
Whether hotspots on the PET scan can be attributed to activity of vasculitis is sometimes difficult to assess. A biopsy of PET-positive lesions would result in a definitive diagnosis. However, such a strategy is not realistic, as it does not correspond to routine clinical practice and was not performed in the current study. As we observed a favorable outcome after intensifying immunosuppressive treatment, we hypothesize that these patients indeed had active disease at the time of scanning. It is important to note that PET scans do not differentiate active vasculitis from infections, as observed in 2 of our patients with PET-positive findings due to an underlying fungal infection. In one of these patients, a biopsy of a clinically occult lesion led to the discovery of cryptococcal myositis and masquerading vasculitis.18 The differentiation between infections and ANCA-mediated disease activity remains an area of uncertainty, especially because there is strong evidence that infections may be an important trigger in the multifactorial etiology of ANCA-associated vasculitis.19In the future, more sensitive diagnostic modalities, such as the combination of PET scanning with magnetic resonance imaging (PET/MRI), may identify the infectious foci, which started the cascade leading to the (re)activation of vasculitis.
Most importantly, PET scans revealed abnormalities during episodes of active disease in which ANCA were sometimes not detected and CRP levels not increased. However, more hotspots were observed if the CRP levels were elevated. In contrast, the highest observed SUVmax values were not related to CRP levels. These findings suggest that the disease may be more extensive, but not more severe, if biochemical parameters of inflammation are increased.
Biomarker Development, Volume 2 (Volume Two: Latest in Genomics Methodologies for Therapeutics: Gene Editing, NGS and BioInformatics, Simulations and the Genome Ontology), Part 1: Next Generation Sequencing (NGS)
“collaboratively creating the NBDA Standards* required for end-to-end, evidence – based biomarker development to advance precision (personalized) medicine”
Successful biomarkers should move systematically and seamlessly through specific R&D “modules” – from early discovery to clinical validation. NBDA’s end-to-end systems approach is based on working with experts from all affected multi-sector stakeholder communities to build an in-depth understanding of the existing barriers in each of these “modules” to support decision making at each juncture. Following extensive “due diligence” the NBDA works with all stakeholders to assemble and/or create the enabling standards (guidelines, best practices, SOPs) needed to support clinically relevant and robust biomarker development.
Mission: Collaboratively creating the NBDA Standards* required for end-to-end, evidence – based biomarker development to advance precision (personalized) medicine. NBDA Standards include but are not limited to: “official existing standards”, guidelines, principles, standard operating procedures (SOP), and best practices.
“The NBDA’s vision is not to just relegate the current biomarker development processes to history, but also to serve as a working example of what convergence of purpose, scientific knowledge and collaboration can accomplish.”
NBDA Workshop VII – “COLLABORATIVELY BUILDING A FOUNDATION FOR FDA BIOMARKER QUALIFICATION” NBDA Workshop VII December 14-15, 2015 Washington Court Hotel, Washington, DC
The upcoming meeting was preceded by an NBDA workshop held on December 1-2, 2014, “The Promising but Elusive Surrogate Endpoint: What Will It Take?” where we explored in-depth with FDA leadership and experts in the field the current status and future vison for achieving success in surrogate endpoint development. Through panels and workgroups, the attendees extended their efforts to pursue the FDA’s biomarker qualification pathway through the creation of sequential contexts of use models to support qualification of drug development tools – and ultimately surrogate endpoints.
Although the biomarker (drug development tools) qualification pathway (http://www.fda.gov/Drugs/DevelopmentApprovalProcess/DrugDevelopmentTools…) represents an opportunity to increase the value of predictive biomarkers, animal models, and clinical outcomes across the drug (and biologics) development continuum, there are myriad challenges. In that regard, the lack of evidentiary standards to support contexts of use-specific biomarkers emerged from the prior NBDA workshop as the major barrier to achieving the promise of biomarker qualification. It also became clear that overall, the communities do not understand the biomarker qualification process; nor do they fully appreciate that it is up to the stakeholders in the field (academia, non-profit foundations, pharmaceutical and biotechnology companies, and patient advocate organizations) to develop these evidentiary standards.
This NBDA workshop will feature a unique approach to address these problems. Over the past two years, the NBDA has worked with experts in selected disease areas to develop specific case studies that feature a systematic approach to identifying the evidentiary standards needed for sequential contexts of use for specific biomarkers to drive biomarker qualification. These constructs, and accompanying whitepapers are now the focus of collaborative discussions with FDA experts.
The upcoming meeting will feature in-depth panel discussions of 3-4 of these cases, including the case leader, additional technical contributors, and a number of FDA experts. Each of the panels will analyze their respective case for strengths and weaknesses – including suggestions for making the biomarker qualification path for the specific biomarker more transparent and efficient. In addition, the discussions will highlight the problem of poor reproducibility of biomarker discovery results, and its impact on the qualification process.
Health Care in the Digital Age
Mobile, big data, the Internet of Things and social media are leading a revolution that is transforming opportunities in health care and research. Extraordinary advancements in mobile technology and connectivity have provided the foundation needed to dramatically change the way health care is practiced today and research is done tomorrow. While we are still in the early innings of using mobile technology in the delivery of health care, evidence supporting its potential to impact the delivery of better health care, lower costs and improve patient outcomes is apparent. Mobile technology for health care, or mHealth, can empower doctors to more effectively engage their patients and provide secure information on demand, anytime and anywhere. Patients demand safety, speed and security from their providers. What are the technologies that are allowing this transformation to take place?
Anna Barker, Fellow, FasterCures, a Center of the Milken Institute; Professor and Director, Transformative Healthcare Networks, and Co-Director, Complex Adaptive Systems Network, Arizona State University
Atul Butte, Director, Institute of Computational Health Sciences, University of California, San Francisco
Mobile, big data, the Internet of Things and social media are leading a revolution that is transforming opportunities in health care and research. Extraordinary advancements in mobile technology and connectivity have provided the foundation needed to dramatically change the way health care is practiced today and research is done tomorrow. While we are still in the early innings of using mobile technology in the delivery of health care, evidence supporting its potential to impact the delivery of better health care, lower costs and improve patient outcomes is apparent. Mobile technology for health care, or mHealth, can empower doctors to more effectively engage their patients and provide secure information on demand, anytime and anywhere. Patients demand safety, speed and security from their providers. What are the technologies that are allowing this transformation to take place?
Complexity of Protein-Protein Interactions, Volume 2 (Volume Two: Latest in Genomics Methodologies for Therapeutics: Gene Editing, NGS and BioInformatics, Simulations and the Genome Ontology), Part 1: Next Generation Sequencing (NGS)
Complexity of Protein-Protein Interactions
Curator: Larry H. Bernstein, MD, FCAP
Cracking the Complex
Using mass spec to study protein-protein interactions
Mass spectrometry is a proteomics workhorse. By precisely measuring polypeptide masses, researchers can identify and sequence those molecules, and characterize whether and how they have been chemically modified. To twist a phrase, by their masses you shall know them.
But many proteins do not act in isolation. Critical biological processes such as DNA replication, transcription, translation, cell division, and energy generation rely on the action of massive protein assemblies, many of which comprise dozens of subunits. While these clusters are ripe for study, few traditional mass spectrometric methods can handle them.
Indeed, protein complexes are unwieldy for many types of analysis, says Philip Compton, director of instrumentation at the Proteomics Center of Excellence at Northwestern University in Evanston, Illinois. Most complexes are held together by noncovalent interactions, assemble only transiently, or are located in the cell membrane—all of which complicate sample preparation, he explains. Also, while some complexes are relatively abundant, others are rare, further thwarting detection and analysis.
For mass spectrometry specifically, however, the problem with analyzing protein complexes, which can weigh in at 500 kDa, is size. “In a mass spec, things of that size have traditionally been fairly difficult to handle,” Compton says. Even if you can deliver them into the spectrometer itself, you need a way to figure out which proteins are present, and in what stoichiometry. Plus, normal sample preparation procedures tend to denature proteins, ripping complexes apart.
Still, researchers are increasingly keen to train their mass specs on intact protein assemblies. The Scientistasked four protein-complex experts about the approaches they use in their own labs. This is what they said.
GETTING TOGETHER: Lactate dehydrogenase from human skeletal muscle comprises four identical M subunits, shown here in different colors. FVASCONCELLOS/WIKIMEDIA COMMONS
RESEARCHER:Philip Compton, Director of Instrumentation, Proteomics Center of Excellence, Northwestern University
PROJECT: High-throughput top-down proteomics
SOLUTION: If protein complexes are onions, Compton needs a way to iteratively peel off the layers to see what’s inside. Working with researchers at Thermo Fisher Scientific, Compton is developing an Orbitrap-based mass spectrometer that can do just that, or perform what is called an MS3 study.
Basically, an MS3 experiment involves weighing all the complexes in a sample fraction—there could be as many as 10 or 15 at a time—grabbing one, smashing it into inert-gas molecules to eject a subunit, weighing and sequencing the cast-off piece, and then repeating the process.
That’s the goal, but because that instrument is not yet built, Compton must temporarily content himself with what he calls a “pseudo-MS3” experiment. Basically, instead of one seamless workflow, the instrument shatters the complex, weighs the pieces that come off it, and then repeats the process, only this time capturing and fragmenting those ejected pieces for subsequent analysis (Anal Chem, 85:11163-73, 2013). “We’re kind of splitting it into these two different steps; that accomplishes essentially the same thing,” Compton says.
Compton and his team are still ironing out the kinks, but they have begun applying the approach to protein complexes involved in metabolism. One of these, lactate dehydrogenase (LDH), is a 145-kDa tetramer comprising M (muscle) and H (heart) subunits that can exist in any of five configurations (MMMM, MMMH, MMHH, MHHH, and HHHH). Using the MS3 workflow, Compton says he can differentiate these “multiproteoform assemblies,” as well as any posttranslational modifications those subunits may bear, and determine the abundance of each. Now he hopes to apply the approach to quantify LDH differences between cell and tissue types.
From Protein Complexes to Subunit Backbone Fragments: A Multi-stage Approach to Native Mass Spectrometry
Native mass spectrometry (MS) is becoming an important integral part of structural proteomics and system biology research. The approach holds great promise for elucidating higher levels of protein structure: from primary to quaternary. This requires the most efficient use of tandem MS, which is the cornerstone of MS-based approaches. In this work, we advance a two-step fragmentation approach, or (pseudo)-MS3, from native protein complexes to a set of constituent fragment ions. Using an efficient desolvation approach and quadrupole selection in the extended mass-to-charge (m/z) range, we have accomplished sequential dissociation of large protein complexes, such as phosporylase B (194 kDa), pyruvate kinase (232 kDa), and GroEL (801 kDa), to highly charged monomers which were then dissociated to a set of multiply charged fragmentation products. Fragment ion signals were acquired with a high resolution, high mass accuracy Orbitrap instrument that enabled highly confident identifications of the precursor monomer subunits. The developed approach is expected to enable characterization of stoichiometry and composition of endogenous native protein complexes at an unprecedented level of detail.
EXTEND YOUR RANGE: Compton’s team uses a souped-up version of Thermo Fisher’s Orbitrap-based Q Exactive HF mass spectrometer, which among other things features a fourfold wider mass range. Other researchers can perform similar work using Thermo’s Exactive Plus EMR Orbitrap system, an off-the-shelf, “extended mass range” instrument. But, because the EMR lacks the “high-mass isolation capabilities” of Compton’s bespoke hardware, the application range is more limited, he says. “You can still do a similar experiment to us, provided that you have one clean [purified] complex.”
Mapping protein-protein interaction interfaces RESEARCHER:Igor Kaltashov, Professor of Chemistry, University of Massachusetts Amherst
PROJECT: Probing the interactions of candidate protein therapeutics with their molecular targets
SOLUTION: Most attempts at studying protein complexes deliver them to the mass spec intact. Kaltashov takes a different approach, using a technique called hydrogen-deuterium exchange (HDX).
It works like this: proteins (like other molecules) pass hydrogen atoms back and forth with the solvent that surrounds them. Normally, one hydrogen is simply swapped for another, and nobody is the wiser. But in deuterated (“heavy”) water, as hydrogens are swapped at the protein surface, the protein gets slightly heavier as deuterium molecules replace some of the hydrogens. This allows researchers to probe how accessible different pieces of the protein are to the solvent, based on how much deuterium they pick up from the buffer, and how quickly they do so.
As Kaltashov explains, HDX can be used to study any event that might alter the accessibility of different protein regions to the solvent that surrounds them. Those events include protein folding and aggregation, but also protein-protein interactions. “Once two proteins bind to each other, solvent would be excluded from the interface, and that would be reflected in the hydrogen-deuterium exchange kinetics,” he says. That change is evident when compared to the proteins in isolation.
In a 2009 review, Kaltashov demonstrated the process with transferrin, an iron transport protein, and its receptor. After undergoing the exchange reaction, the proteins were fragmented to peptides and analyzed piecemeal. Some peptides exhibited no hydrogen-deuterium exchange, he says. That suggests they were never exposed to solvent because they were buried inside the protein core. Other peptides exchanged hydrogens with the solvent at the same rate regardless of receptor binding, indicating they are not part of the protein-receptor interface. A third set of peptides, though, exhibited clear differences in the presence and absence of receptor, marking those as elements of the protein-protein interaction domain (Anal Chem, 81:7892-99, 2009).
“You can actually localize these sites and obtain information both on the strength of the binding [interactions] and the structural characteristics of the interface region,” Kaltashov says.
H/D exchange and mass spectrometry in the studies of protein conformation and dynamics: Is there a need for a top-down approach?
Hydrogen/deuterium exchange (HDX) combined with mass spectrometry (MS) detection has matured in recent years to become a powerful tool in structural biology and biophysics. Several limitations of this technique can and will be addressed by tapping into ever expanding arsenal of methods to manipulate ions in the gas phase offered by mass spectrometry.
Keywords: hydrogen/deuterium exchange (HDX), mass spectrometry (MS), protein ion fragmentation, collision-induced dissociation (CAD), electron-capture dissociation (ECD), electron-transfer dissociation (ETD), protein conformation, protein dynamics
Introduction: HDX MS in the context of structural proteomics
The spectacular successes of proteomics and bioinformatics in the past decade have resulted in an explosive growth of information on the composition of complex networks of proteins interacting at the cellular level and beyond. However, a simple inventory of interacting proteins is insufficient for understanding how the components of sophisticated biological machinery work together. Protein interactions with each other, small ligands and other biopolymers are governed by their higher order structure, whose determination on a genome scale is a focus of structural proteomics. Realization that “the structures of individual macromolecules are often uninformative about function if taken out of context”1 is shifting the focus of the inquiry from comprehensive characterization of individual protein structures to structural analysis of protein complexes.
X-ray crystallography remains the mainstay in this field, and high resolution structures of proteins and protein complexes often provide important clues as to how they carry out their diverse functions in vivo. However, individual proteins are not static objects, and their behavior cannot be adequately described based solely on information derived from static snapshots and without taking into consideration their dynamic character.2Conformation and dynamics of small proteins can be probed at high spatial resolution on a variety of time scales using NMR spectroscopy; however, rather unforgiving molecular weight limitations make this technique less suited for the studies of larger proteins and protein complexes.
Mass spectrometry (MS) is playing an increasingly visible role in this field, as it can provide information on protein dynamics on a variety of levels, ranging from interactions with their physiological partners by forming dynamic assemblies3 to large-scale conformational transitions within individual subunits.4 Perhaps one of the most powerful MS-based tools to characterize protein conformation and dynamics is HDX MS, a technique that combined hydrogen/deuterium exchange in solution5 with MS detection of the progress of exchange reactions.6 This technique is certainly not new,7 and in fact already made lasting impact in diverse fields ranging from structural proteomics8 to analysis of biopharmaceutical products.9 Nevertheless, HDX MS methodology is still in a phase where dramatic progress is made, fed by the continued expansion of the experimental armamentarium offered by MS. In particular, better integration of new methods of manipulating ions in the gas phase into HDX MS routine is likely to result in truly transformative changes. This sea change in HDX MS methodology will transform it to a potent tool rivaling NMR in terms of resolution, but without suffering the limitations of this technique.
What information can be deduced from HDX MS measurements? The classic “bottom-up” approach, its challenges and limitations
While the concept of HDX experiment may appear rather transparent (Figure 1), interpretation of the results is usually not. The backbone protection measured in a typical HDX MS experiment is a combination of several factors, as the exchange reaction of each labile hydrogen atom is a convolution of two processes.5The first is a protein motion that makes a particular hydrogen atom exposed to solvent and therefore available for the exchange. This could be a small-scale event, such as relatively frequent local structural fluctuations transiently exposing hydrogen atoms residing close to the protein surface, or a rare global unfolding event exposing atoms sequestered from the solvent in the protein core. The second process is a chemical reaction of exchanging the unprotected labile hydrogen atom with the solvent. The kinetics of this reaction (intrinsic exchange rate) strongly depends on solution temperature and pH (with a minimum at pH 2.5-3 for backbone amides), parameters that obviously have a great influence on the protein dynamics as well.
Schematic representation of HDX MS experiments: bottom-up (A) and top-down (B) HDX MS.
Since the majority of HDX MS studies target protein dynamics under near-native conditions, the experiments are typically carried out at physiological pH, where the progress of the exchange is followed by monitoring the protein mass change. The direct infusion scheme offers the simplest way to carry out such measurements, either in real time7 or by using on-line rapid mixing.10 However, in many cases these straightforward approaches cannot be used, as they limit the choice of exchange buffer systems to those compatible with electrospray ionization (ESI). To avoid this, HDX can be carried out in any suitable buffer followed by rapid quenching (lowering pH to 2.5-3 and temperature to near 0°C). Dramatic deceleration of the intrinsic exchange rate for backbone amides under these conditions allows the protein solution to be de-salted prior to MS analysis. Additionally, the slow exchange conditions denature most proteins, resulting in facile removal of various binding partners, ranging from small ligands to receptors (their binding to the protein of interest inevitably complicates the HDX MS data interpretation by making accurate mass measurements in the gas phase less straightforward).
An example of such experiments is shown in Figure 2, where HDX is used to probe the higher order structure and conformational dynamics of metal transporter transferrin (Fe2Tf) alone and in the receptor-bound form. Both Tf-metal and Tf-receptor complexes dissociate under the slow exchange conditions prior to MS analysis; therefore, the protein mass evolution in each case reflects solely deuterium uptake in the course of exchange in solution. The extra protection afforded by the receptor binding to Tf persists over an extended period of time, and it may be tempting to assign it to shielding of labile hydrogen atoms at the protein-receptor interface. However, this view is overly simplistic, as the conformational effects of protein binding are frequently felt well beyond the interface region. The difference in the backbone protection levels of receptor-free and receptor-bound forms of Fe2Tf appears to grow during the initial hour of the exchange (Figure 2), reflecting significant stabilization of Fe2Tf higher order structure by the receptor binding. Indeed, while the fast phase of HDX is typically ascribed to frequent local fluctuations (transient perturbations of higher order structure) affecting relatively small protein segments, the slower phases of HDX usually reflect relatively rare, large-scale conformational transitions (transient partial or complete unfolding). This is why global HDX MS measurements similar to those presented in Figure 2 are can be used to obtain quantitative thermodynamic characteristics for protein interaction with a variety of ligands, ranging from metal ions11 and small organic molecules 12 to other proteins13 and oligonucleotides.14
HDX MS of Fe2Tf in the presence (blue) and the absence (red) of the cognate receptor. The exchange was carried out by diluting the protein stock solution 1:10 in exchange solution (100 mM NH4HCO3 in D2O, pH adjusted to 7.4) and incubating for a certain period of time as indicated on each diagram followed by rapid quenching (lowering pH to 2.5 and temperature to near 0°C). The black trace shows unlabeled protein.
While global HDX MS measurements under near-native conditions provide valuable thermodynamic information on proteins and their interaction with binding partners, structural studies (e.g., localizing the changes in Tf that occur as a result of receptor binding) must rely on the knowledge of exchange kinetics at the local level. This is typically accomplished by carrying out proteolysis under the slow exchange conditions following the quench of HDX.6 Here we will refer to this approach as “bottom-up” HDX MS, by drawing analogy to a bottom-up approach to obtain sequence information.15 An example is shown in Figure 3, where Fe2Tf undergoes exchange in solution in the absence and in the presence of the receptor, followed by rapid quenching of HDX reactions, protein reduction and digestion with pepsin and LC/MS analysis of the deuterium content of individual proteolytic peptides.
Localizing the influence of the receptor binding on backbone protection of Fe2Tf using bottom-up HDX MS on the physiologically relevant time scale. The panels show isotopic distributions of representative peptic fragments derived from the protein subjected to HDX in the presence (blue) and the absence (red) of the receptor and followed by rapid quenching. Dotted lines indicate deuterium content of unlabeled and fully exchanged peptides. Colored segments within the Fe2Tf/receptor complex show location of the peptic fragments.
Evolution of deuterium content of various peptic fragments in Figure 3 reveals a wide spectrum of protection, which is clearly distributed very unevenly across the protein sequence. While some peptides exhibit nearly complete protection of backbone amides (e.g., segment [396-408] sequestered in the core of the protein C-lobe), exchange in some other segments is fast (e.g., peptide [612-621] in the solvent-exposed loop of the C-lobe). The influence of the receptor binding on the backbone protection is also highly localized. While many segments appear to be unaffected by the receptor binding, there are a few regions where exchange kinetics noticeably decelerates (e.g., segment [71-81] of the N-lobe, which contains several amino acid residues that form Tf/receptor interface according to the available model of the complex based on low-resolution cryo-EM data16).
Although the increased protection of backbone amides proximal to the protein/receptor binding interface is hardly surprising, HDX MS data also reveal a less trivial trend, acceleration of exchange kinetics in some segments of the protein as a result of receptor binding (such behavior is illustrated in Figure 3 with segment [113-134], a part of the N-lobe that is distal to the receptor). Therefore, in addition to mapping binding interface regions, HDX MS also provides a means to localize the protein segments that are affected by the binding indirectly via allosteric mechanisms. However, this example also highlights one of the limitations of HDX MS, namely inadequate spatial resolution. This peptic fragment spans several distinct regions of the protein (an α-helical segment, a β-strand, and two loops). The moderate level of protection observed in this segment in the absence of the receptor binding (fast exchange of three protons followed by slow exchange of the rest) is likely to be a result of averaging out very uneven protection patterns across this peptide. Even smaller peptides may comprise two or more distinct structural elements, such as segment [71-81] spanning three distinct regions of the protein (an α-helical segment, a β-strand, and a loop connecting them).
In some favorable cases spatial resolution in HDX MS of small proteins (<15 kDa) may be enhanced up to a single residue level by analyzing deuterium content of a set of overlapping proteolytic fragments.17However, single-residue resolution has never been demonstrated in HDX MS studies of proteins falling out of the mass range routinely accessible by NMR, although overlapping peptic fragments frequently provide moderate improvement of spatial resolution.
In addition to limited spatial resolution, the “classic” HDX MS scheme frequently suffers from incomplete sequence coverage, especially when applied to larger and extensively glycosylated proteins. Proteins with multiple disulfide bonds constitute another class of targets for which adequate sequence coverage is difficult to achieve, although certain changes in experimental protocol can alleviate this problem, at least for smaller proteins.18 Typically, an 80% level of sequence coverage is considered good, although significantly lower levels may also be adequate, depending on the context of the study.
Protein processing in HDX MS experiments is carried out under the conditions that minimize the exchange rates for backbone amides. Since these slow exchange conditions are highly denaturing for most proteins, both intact protein and its proteolytic fragments lack any protection and inevitably begin to lose their labile isotopic labels, despite low (but finite) intrinsic exchange rates.19 This phenomenon, known as “back-exchange,” may be accelerated during various stages of protein processing, e.g. during the chromatographic step.20 Although back-exchange was frequently evaluated in early HDX MS studies using unstructured model peptides, the utility of this procedure is questionable, since the intrinsic exchange rates are highly sequence-dependent. In many instances, back-exchange may be estimated using algorithms based on context-specific kinetics data (e.g., http://hx2.med.upenn.edu/download.html); it may also be determined experimentally for each proteolytic fragment by processing a fully labeled protein using a series of steps that precisely reproduce those used in HDX MS measurements.9 Typical back-exchange levels reported in recent literature range from 10% to 50%, although significantly higher numbers have also been reported. Even if back-exchange can be accounted for, it nonetheless has very detrimental influence on the quality of HDX MS measurements by reducing the available dynamic range.
Finally, the classic HDX MS scheme is poorly suited for measurements that are carried out under conditions favoring correlated exchange, when HDX kinetics follows the so-called EX1 regime, leading to appearance of bimodal and convoluted multi-modal isotopic distributions of protein ions.21 Carrying out HDX MS measurements under these conditions provides a unique opportunity to visualize and characterize distinct conformational states, which can be populated either transiently10 or at equilibrium.22 The distinction among such states can be made based on the differences in their deuterium contents. However, proteolysis in solution almost always leads to a loss of correlation between the deuterium content of fragment peptides and specific conformers with distinct levels of backbone protection. Therefore, the classic HDX MS scheme does not allow protein higher order structure and dynamics to be characterized in a conformer-specific fashion.
“Top-down” HDX MS: tandem MS allows protein structure to be probed in the conformer-specific fashion but raises the specter of hydrogen scrambling
The problem of characterizing protein conformation and dynamics in a conformer-specific fashion can be addressed using methods of tandem mass spectrometry (the so-called “top-down” HDX MS). Indeed, replacement of proteolysis in solution with protein ion fragmentation in the gas phase following mass selection of precursor ions provides a means to obtain fragment ions originating from a particular conformer with a specific level of deuterium incorporation. Deuterium content of fragment ions would then provide a measure of local protection patterns, assuming there is no internal re-arrangement of labile hydrogen and deuterium atoms during ion activation (vide infra). Although the idea to use polypeptide ion dissociation in the gas phase as an alternative to proteolysis was originally proposed in early 1990s,23 its implementation for proteins only became possible24 following dramatic improvements in FTMS and hybrid TOF analyzers in the late 1990s.
An example of conformer-specific characterization of protein higher order structure using a top-down HDX MS approach is illustrated in Figure 4. The isotopic profile of a fully deuterated 18 kDa protein wt*-CRABPI is recorded following its brief exposure to the 1H-based exchange buffer. The bimodal appearance of the isotopic distribution of the molecular ion (top trace in Figure 4A) clearly indicates the presence of at least two conformers with different levels of backbone protection. Collisional activation of the entire protein ion population generates a set of fragment ions with convoluted isotopic distributions (top trace in Figure 4B). However, mass selection of precursor ions with a specific level of deuterium content allows the top-down HDX MS measurements to be carried out in a conformation-specific fashion, taking full advantage of the HDX MS ability to detect distinct conformers. For example, selective fragmentation of protein ions representing a highly protected conformation is achieved by mass-selecting a narrow population of intact protein ions with high level of retained deuterium (the blue trace in Figure 4A). Mass-selection and subsequent fragmentation of a narrow population of protein ions with significantly lower deuterium content (the red trace in Figure 4A) generates a set of fragment ions whose isotopic distributions provide information on backbone protection within non-native protein states. For example, the data presented in Figure 4 clearly indicate that the C-terminal segment of the protein represented by the y172+ ions retains significant structure even within the partially unfolded conformers: the amount of retained deuterium atoms reduces by only 30% as a result of switching from the precursor ion from highly protected (blue) to less protected (red). At the same time, selection of the precursor ion has a much more dramatic effect on the protection levels exhibited by the N-terminal segment (represented by the b425+ ion), where more than a two-fold decrease in the amount of retained deuterium atoms is observed. Extending this analysis to other protein fragments may allow detailed backbone protection maps to be created for each protein conformer, provided there is no hydrogen scrambling prior to protein ion fragmentation (vide infra).
Characterization of local dynamics in wt*-CRABP I in a conformer-specific fashion using top-down HDX MS (fully deuterated protein was exposed to 1H2O/CH3CO2N1H4 at pH 3.1 for 10 min; the gray trace at the bottom corresponds to HDX end-point). A: mass selection of precursor ions for subsequent CAD (from top to bottom): broad-band selection of the entire ionic population (not conformer-specific); highly protected conformers; narrow population of less protected conformers; HDX end-point. B: isotopic distributions of two representative fragment ions generated by CAD of precursor ions shown in panel A. Selection of different ion populations as precursor ions for subsequent fragmentation was achieved by varying the width of a mass selection window of a quadrupole filter (Q) in a hybrid quadrupole/time-of-flight mass spectrometer (Qq-TOF MS).
The example shown above illustrates a great promise of top-down HDX MS as a technique uniquely capable of probing structure and dynamics of populations of protein conformers coexisting in solution with high selectivity. Furthermore, this approach often allows one to avoid protein handling under the slow exchange conditions prior to MS analysis, thereby eliminating back-exchange as a factor adversely influencing the quality of measurements. Nonetheless, applications of top-down HDX MS have been limited due to concerns over the possibility of hydrogen scrambling accompanying collision-activated dissociation (CAD) of protein ions. Indeed, several reports pointed out that proton mobility in the gas phase may under certain conditions influence the outcome of top-down HDX MS measurements when CAD is employed to fragment protein ions.25, 26
The occurrence (or the absence) of hydrogen scrambling in the gas phase can be reliably detected by using built-in scrambling indicators. One particularly convenient indicator is a Histag, a 6-30 residues long, histidine-rich segment appended to wild-type sequences to facilitate protein purification on metal affinity columns. Such segments are fully unstructured in solution and, therefore, should lack any backbone protection.27 Alternatively, intrinsic scrambling indicators (e.g., internal flexible loops26), as well as other approaches25 can be used to detect occurrence of scrambling. The available experimental evidence suggests that slow protein ion activation (e.g., SORI CAD) always leads to hydrogen scrambling, while fast activation allows it to be minimized or eliminated in top-down HDX MS experiments.26
Another shortcoming of top-down HDX MS schemes utilizing CAD is the limited extent of protein ion fragmentation, which may lead to sizeable gaps in sequence coverage, particularly for larger proteins,28 and insufficient level of spatial resolution (even for smaller proteins29). Our earlier attempts to solve this problem by employing multi-stage CAD (MSn) were unsuccessful due to massive hydrogen scrambling exhibited by the second generation of fragments.
Electron-induced ion fragmentation in top-down schemes: keeping hydrogen scrambling at bay while enhancing sequence coverage and spatial resolution
Some time ago we suggested that the specter of hydrogen scrambling in top-down HDX MS measurements may be alleviated by using non-ergodic fragmentation processes, where dissociation is induced by ion-electron interaction, rather than collisional activation.30 Indeed, the results of earlier work combining hydrogen exchange of polypeptide ions in the gas phase and electron capture dissociation (ECD) were consistent with the notion of intramolecular rearrangement of hydrogen atoms occurring on a slower time scale compared to ion dissociation.31 A recent study demonstrated that the extent of scrambling was indeed negligible when ECD was used as a means to obtain fragment ions in top-down HDX MS characterization of a small protein ubiquitin.32
Our own recent work suggests that hydrogen scrambling can be avoided when top-down HDX MS employs ECD in characterizing higher order structure of larger proteins (approaching 20 kDa), although experimental conditions must be carefully controlled to minimize proton mobility induced by ion-molecule collisions in the ESI interface. The point in question is illustrated in Figure 5, which shows the results of top-down HDX MS analysis of higher order structure of wt*-CRABP I. The protein retains a significant proportion of labile deuterium label following its complete deuteration and then brief exposure to the 1H-based exchange buffer, as indicated by the isotopic distribution of the surviving molecular ions (red and blue traces in Figure 5A). However, the deuterium content of fragment ions derived from the 21-residue long His-tag region of the protein (e.g., c22 in Figure 5B) is indistinguishable from that of the exchange reaction endpoint, as long as moderate ion desolvation conditions are kept in the ESI interface. This clearly signals that hydrogen scrambling does not affect the outcome of local HDX MS measurements. However, once collision-assisted desolvation of protein ions is attempted in the ESI interface, the appearance of isotopic distributions of larger fragment ions derived from the His-tag region (e.g., c22, red trace in Figure 5B) shifts, indicating apparent deuterium retention and signaling the occurrence of limited hydrogen scrambling. We also demonstrated that deuterium distribution across the protein backbone is preserved when another recently introduced fragmentation technique based on cation-electron interactions, electron transfer dissociation (ETD), is used in top-down HDX MS schemes.33
Top-down HDX MS of wt*-CRABP I using ECD of the entire protein ion population (fully deuterated protein was exposed to1H2O/CH3CO2N1H4 at pH 3.5 for varying time periods); the black trace at the bottom of corresponds to HDX end-point). A: isotopic distributions of surviving intact protein ions. B: two representative c-ions. Minimal collision-and temperature-induced desolvation was used for acquisition of all mass spectra, except the one top (red trace).
In addition to allowing scrambling to be easily eliminated in top-down HDX MS experiments, both ECD and ETD appear to be superior to CAD in terms of sequence coverage, at least for the proteins in the 20 kDa range. Unlike CAD, protein backbone cleavage in ECD and ETD is less specific,34 leading to a higher number of fragment ions. This translates not only to improved sequence coverage, but also enhanced spatial resolution. Indeed, in some cases it becomes possible to generate patterns of deuterium distribution across the protein backbone down to the single residue level.
One example of such work is shown in Figure 6, where ETD was used as a protein ion fragmentation tool in top-down HDX MS characterization of a 16 kDa variant of CRABP I. The bar graph shows the levels of deuterium retention in a series of c-ions derived from the N-terminal segment of the protein. The bar height at position n in this diagram shows mass difference between two cn-1 fragments, one derived from the fully deuterated protein that was exposed to the protiated exchange buffer at pH 7 for 5 min and then placed under the slow exchange conditions for the duration of the data acquisition cycle, and another one representing the HDX endpoint (raw data for bars at n=14 and 35 are shown in Figure 7). Unchanged height between two adjacent bars at residues n and n+1 indicates no difference in deuterium content of cn-1 and cn fragments, signaling no backbone amide deuterium retention at residue n+1, while bar height increase by one unit indicates complete retention of deuterium at the nth amide.
Backbone protection pattern of CRABPI mutant (without N-terminal His-tag) obtained from top-down HDX MS measurements using ETD of the entire protein ion population. HDX was initiated by exposing the fully deuterated protein to 1H2O/CH3CO2N1H4 at pH 3.5 for 5 min followed by rapid quenching.
An example of raw HDX MS data used to generate the protection plot shown in Figure 6. Isotopic distributions of c13 and c34 fragments derived from protein subjected to 5 min HDX exchange in solution (red trace) and protein at the HDX end-point (blue trace) were used to calculate the bar heights at n=12 and 35.
The resulting backbone protection pattern in Figure 6 shows clear correlation with the known higher order structure of the protein (the amino acid sequence and the secondary structure assignment are shown at the top of the graph). Furthermore, the diagram clearly shows uneven distribution of backbone protection even within single structural elements (e.g., lower protection at the fringes vs. the middle of helix α1), as well as unequal protection of similar structural elements participating in the same structural motif (e.g., lower protection of helix α2 vs. helix α1, consistent with the available NMR data). A comparable level of spatial resolution can be achieved with ECD, as shown recently in top-down HDX MS analysis of higher order structure of myoglobin.35
The ability to characterize protein conformation and dynamics at the single residue level is certainly very exciting; however, it comes at a price. Since the protein fragmentation is carried out entirely in the gas phase, no fragment separation can be done prior to mass analysis. A large number of fragment ions with different masses and charges are usually confined to a relatively narrow m/z region, leading to inevitable overlaps of fragment ion isotopic distributions (Figure 7). This places rather stringent requirements on the resolving power of the mass analyzer, effectively narrowing the selection of mass spectrometers suitable for this work to FTMS.
Meeting in the middle: integration of top-down strategies into bottom-up HDX MS schemes
The top-down approach to HDX MS measurements clearly shows a promise to solve many problems that mar the commonly employed bottom-up methodology. The fragmentation efficiency afforded by ECD and ETD provides better spatial resolution, at least for proteins in the 20 kDa range, and this number is likely to grow as there are numerous examples of successful use of these fragmentation techniques to obtain sequence information on significantly larger proteins.36 Unlike the classic bottom-up approach, top-down HDX MS provides an elegant solution to the problem of characterizing higher order structure and dynamics in a conformer-specific fashion (see Figure 4 and discussion in the text). Finally, back-exchange can be eliminated, as outsourcing protein fragmentation to the gas phase often eliminates the need to manipulate the protein in solution under the slow exchange conditions prior to MS analysis.
The top-down/bottom-up dichotomy in HDX MS should not be viewed through the “eitheror” prism. In fact, gas phase fragmentation can enhance the quality of HDX MS data derived from experiments that are built around the bottom-up approach. The suggestion to supplement proteolysis in solution with peptide ion fragmentation in the gas phase to achieve better spatial resolution was made over 10 years ago.37 However, earlier attempts to implement this idea using CAD on a variety of platforms yielded mixed results due to apparent scrambling in some (but not all) fragment ions.37, 38 Later reports showed even more extensive scrambling in small peptide ions subjected to collisional activation,39 an obvious anathema to the proposed marriage of CAD and bottom-up HDX MS. Nonetheless, continued search for a scrambling-free solution to this problem has yielded very encouraging results, with both ECD and ETD showing minimal scrambling when applied to short peptides under carefully controlled conditions40, 41 and feasibility of supplementing proteolytic fragmentation in solution with ETD in the gas phase was recently demonstrated using a small model protein.42 Although these initial steps are relatively modest, they certainly warrant further work in this field.
The two complementary approaches to HDX MS measurements share a set of common challenges that inevitably arise as these techniques gain popularity and the scope of their applications expands. One such challenge is presented by membrane proteins, a notoriously difficult class of biological objects. HDX MS has been shown to have a great potential in this field.43 Interestingly, some initial work in this field was done nearly ten years ago using then-infant top-down HDX MS technique,44 while more recent work in this field utilizes both bottomup18 and top-down45 approaches. Another challenge faced by HDX MS is presented by highly heterogeneous proteins, such as proteins conjugated to other biopolymers and/or synthetic polymers, which constitute a significant fraction of the next generation of biopharmaceuticals. Presently, there are no biophysical techniques capable of characterizing conformation and dynamics of these systems, and there is an urgent need to fill this gap. Finally, nearly all HDX MS work reported to date was carried out in vitro under conditions that some regard as “reductionist.” Although initial HDX work with living objects was carried out over 75 years ago,46 as the years passed only one report on in vivo HDX MS studies was published.47 As mass spectrometry at large is being increasingly used in both in vivo and ex vivo studies, there is a growing pressure on HDX MS to follow the trend, although it remains to be seen how this will be done.
It probably is not an exaggeration to say that we are witnessing a renaissance of HDX MS, with the emergence of the top-down approach not only expanding our experimental arsenal by offering new capabilities, but also serving as a catalyst in enhancing the classic bottom-up methodology. The two techniques are highly complementary, and their synergism will certainly bring about new exciting discoveries and accelerate our progress in solving a variety of problems ranging from very fundamental questions in biophysics to applied problems in drug design.
WATCH OUT FOR DISULFIDES: If you’re going to try bottom-up HDX experiments, be careful of disulfide bonds, Kaltashov says. Pepsin is one of the very few proteinases that can efficiently digest a protein into its composite peptides under HDX experimental conditions, but it struggles when multiple disulfide bonds are present. In 2014, Kaltashov’s lab published two solutions to that problem. The first employs a fragmentation technique called electron capture dissociation (ECD) to break the disulfide linkage in the mass spec (Anal Chem, 86:5225-31, 2014); the second skips the pepsin digestion altogether—a strategy called top-down analysis (Anal Chem, 86:7293-98, 2014).
Enhancing the Quality of H/D Exchange Measurements with Mass Spectrometry Detection in Disulfide-Rich Proteins Using Electron Capture Dissociation
Hydrogen/deuterium exchange (HDX) mass spectrometry (MS) has become a potent technique to probe higher-order structures, dynamics, and interactions of proteins. While the range of proteins amenable to interrogation by HDX MS continues to expand at an accelerating pace, there are still a few classes of proteins whose analysis with this technique remains challenging. Disulfide-rich proteins constitute one of such groups: since the reduction of thiol–thiol bonds must be carried out under suboptimal conditions (to minimize the back-exchange), it frequently results in incomplete dissociation of disulfide bridges prior to MS analysis, leading to a loss of signal, inadequate sequence coverage, and a dramatic increase in the difficulty of data analysis. In this work, the dissociation of disulfide-linked peptide dimers produced by peptic digestion of the 80 kDa glycoprotein transferrin in the course of HDX MS experiments is carried out using electron capture dissociation (ECD). ECD results in efficient cleavage of the thiol–thiol bonds in the gas phase on the fast LC time scale and allows the deuterium content of the monomeric constituents of the peptide dimers to be measured individually. The measurements appear to be unaffected by hydrogen scrambling, even when high collisional energies are utilized. This technique will benefit HDX MS measurements for any protein that contains one or more disulfides and the potential gain in sequence coverage and spatial resolution would increase with disulfide bond number.
———
Hydrogen/deuterium exchange (HDX) with mass spectrometry (MS) detection has evolved in the past two decades into a powerful tool that is now used to decipher intimate details of processes as diverse as protein folding, recognition and binding, and enzyme catalysis.1,2 While initially being a tool that was used exclusively in fundamental studies, HDX MS is now becoming an indispensable part of the analytical arsenal in the biopharmaceutical sector, where it is utilized increasingly in all stages of protein drug development from discovery to quality control.3−5 Despite this progress, several areas remain where the application of HDX MS has met with only limited success. Disulfide-rich proteins constitute one such group, where characterization of higher-order structure and dynamics is particularly difficult, because of the suboptimal conditions used for reduction of thiol–thiol bonds following a quench of the exchange reactions. Proteins containing disulfide bonds are encountered very rarely in the protein folding studies where the most popular targets are small proteins lacking cysteine residues (with a notable exception of the oxidative folding studies), as well as in many other fundamental studies focusing on proteins of prokaryotic origin. However, disulfide-rich proteins are encountered very frequently in eukaryotic proteomes6 and constitute a large segment of the biopharmaceutical products,7 where the thiol–thiol bonds are critical elements defining conformation of protein drugs, and also play an important role in stabilizing proteins by endowing them with protease resistance.
While disulfide bond reduction is a relatively trivial task that can be readily accomplished at neutral pH using a variety of reagents, the acidic, low-temperature environment where proteins are placed to quench HDX narrows down the choice to a single reducing agent, TCEP.8 However, the alkaline pH for optimal disulfide reduction by TCEP is substantially higher, compared to the acidic environment of typical “slow exchange conditions” commonly employed to minimize back exchange within proteins and their peptic fragments prior to MS analysis.9 Furthermore, disulfide reduction in HDX MS measurements is usually carried out within a relatively short period of time (a few minutes) and at low temperature (0–4 °C) to limit the extent of the back-exchange, which in many situations does not allow the complete dissociation of thiol–thiol linkages of individual peptic fragments to be achieved in solution prior to LC separation and MS analysis of their deuterium content. Incomplete reduction of disulfide bonds dramatically increases the pool of candidate peptides that should be considered when analyzing proteolytic fragments in HDX MS measurements and frequently reduces sequence coverage and/or spatial resolution. While the former problem can be solved by employing more powerful and robust search engines for peptide identification, the latter one is more difficult to circumvent and can be very detrimental for the quality of HDX MS data and may require significant changes in experimental protocols. Indeed, a complete failure to reduce a certain disulfide bond in a protein will give rise to a thiol–thiol linked peptide dimer, whose constituent monomers do not necessarily represent a contiguous segment of the protein and may have vastly different conformational and dynamic properties. The total deuterium content of the entire dimer (measured by HDX MS) would not provide any meaningful information under these conditions, thereby effectively reducing the sequence coverage in the corresponding segments of the protein.
———-
Disulfide-rich proteins have traditionally been challenging targets for HDX MS studies, because of incomplete reduction of thiol–thiol linkages, which is a consequence of the quench conditions used to minimize amide back-exchange in peptides prior to MS analysis of their deuterium content: limited time, low temperature, and low pH. Traditionally, the principal strategy to address difficult-to-reduce or high-density disulfides in the HDX MS workflow is a brute force approach utilizing high concentrations of reductant and denaturant prior to (or even in combination with) digestion. The effectiveness of this approach is protein-dependent and extended incubation times frequently employed to enhance exposure to reductant invariably result in an undesirable increase in H/D back exchange. More recently, a novel electrochemical approach to reduce disulfides in solution under quench conditions prior to LC-MS has been reported for insulin.32 While electrochemical reduction shows promise, several limitations were identified, an apparent requirement for low-salt conditions, a higher-than-optimal temperature (10 °C), and a current cell pressure limit of 50 bar. In this work, electron capture dissociation (ECD) was used to circumvent the disulfide problem, since it effectively cleaves external disulfide bonds. Dissociation of the disulfide-linked peptide dimers can be accomplished on the fast LC time scale and produces abundant signals for monomeric subunits without interchain hydrogen scrambling, even when collisional activation of ions is applied prior to ion selection and ECD fragmentation. Inclusion of ECD in the HDX MS workflow results in increased sequence coverage and spatial resolution and provides an attractive alternative to extensive chemical reduction of disulfide-rich proteins.
Approach to Characterization of the Higher Order Structure of Disulfide-Containing Proteins Using Hydrogen/Deuterium Exchange and Top-Down Mass Spectrometry
Top-down hydrogen/deuterium exchange (HDX) with mass spectrometric (MS) detection has recently matured to become a potent biophysical tool capable of providing valuable information on higher order structure and conformational dynamics of proteins at an unprecedented level of structural detail. However, the scope of the proteins amenable to the analysis by top-down HDX MS still remains limited, with the protein size and the presence of disulfide bonds being the two most important limiting factors. While the limitations imposed by the physical size of the proteins gradually become more relaxed as the sensitivity, resolution and dynamic range of modern MS instrumentation continue to improve at an ever accelerating pace, the presence of the disulfide linkages remains a much less forgiving limitation even for the proteins of relatively modest size. To circumvent this problem, we introduce an online chemical reduction step following completion and quenching of the HDX reactions and prior to the top-down MS measurements of deuterium occupancy of individual backbone amides. Application of the new methodology to the top-down HDX MS characterization of a small (99 residue long) disulfide-containing protein β2- microglobulin allowed the backbone amide protection to be probed with nearly a single-residue resolution across the entire sequence. The high-resolution backbone protection pattern deduced from the top-down HDX MS measurements carried out under native conditions is in excellent agreement with the crystal structure of the protein and high-resolution NMR data, suggesting that introduction of the chemical reduction step to the top-down routine does not trigger hydrogen scrambling either during the electrospray ionization process or in the gas phase prior to the protein ion dissociation.
Since its initial introduction in the late 1990s,1−3 top-down hydrogen/deuterium exchange (HDX) with mass spectrometric (MS) detection evolved to become a potent biophysical tool capable of providing valuable information on higher order structure and conformational dynamics of proteins at an unprecedented level of structural detail. Among the many advantages offered by top-down HDX MS compared to conventional (bottom-up) measurements are significant reduction or indeed complete elimination of the back exchange,4 high spatial resolution,5,6 and the ability to study conformational dynamics in the conformer-specific fashion.7,8 However, despite the spectacular recent advances and the broader acceptance of this technique, the scope of the proteins amenable to the analysis by top-down HDX MS remains limited, with the protein size and the presence of disulfide bonds being the two most important limiting factors. The limitations imposed by the physical size of the proteins gradually become more relaxed as the sensitivity, resolution, and dynamic range of modern MS instrumentation continue to improve at an ever accelerating pace. However, the presence of disulfides remains a much less forgiving limitation even for the proteins of relatively modest size.
In this work we demonstrated feasibility of applying top-down HDX MS measurements to characterize higher order structure and conformational dynamics of disulfide-containing proteins, which have been out of the reach of this technique so far. Use of a moderate amount of a reducing agent TCEP is compatible with the ESI process, while allowing a fraction of the protein molecules to be reduced in solution thereby enabling nearcomplete sequence coverage at high resolution. The agreement between the top-down HDX MS and NMR data sets demonstrate that the new experimental approach is capable of capturing the dynamic picture of protein conformation at high spatial resolution without compromising the quality of the data by triggering hydrogen scrambling in the gas phase. Despite its modest size, β2m is known to be able to populate a non-native state,35 which might be a key player in a variety of processes, including amyloidosis. However, the structure of this non-native state of β2m remains elusive since this conformer exists in dynamic equilibrium with the native state of the protein.36,37 Recently we demonstrated that top-down HDX MS provides an elegant way to selectively probe structure of protein states coexisting in solution at equilibrium;8 however, β2m remained out of reach of this technique until recently due to the presence of a disulfide bond. The ability to expand the scope of top-down HDX MS to disulfide-containing proteins opens up a host of exciting possibilities to explore the structure of β2m, interferon, lysozyme, and a variety of other disulfidecontaining proteins in a conformer-specific fashion, where physiologically important non-native states may play important roles in processes as diverse as folding, recognition, signaling, and amyloidosis. ■ ASSOCIATED CONTENT *S Supporting Information Representative examples of isotopic distributions of fragment ions that have (Supplementary Figure 1) and have not (Supplementary Figure 2) been used to calculate the deuterium occupancy at individual backbone amides of β2m in top-down HDX MS measurements. This material is available free of charge via the Internet at http://pubs.acs.org.
SUSSING OUT THE SURFACE: Protein topology can be probed by firing low-energy electrons (white circles) at intact protein complexes within a high-resolution mass spectrometer. That reaction, called electron capture dissociation, causes the protein complex to fracture on its surface, revealing the exposed amino acid residues. COURTESY OF PIRIYA WONGKONGKATHEP AND HUILIN LI, UCLA
RESEARCHER:Joseph Loo, Professor of Biological Chemistry, David Geffen School of Medicine, University of California, Los Angeles)
PROJECT: Studying protein-ligand and protein-protein interactions
SOLUTION: Loo is less interested in complex identification than in how the protein subunits assemble. Specifically, he wants to know which amino acid residues lie on the complex’s surface and which are buried inside or interacting with ligands.
It’s a question of structural biology, he explains: “How is this thing folded in a way that these residues are on the outside?”
To work that out, Loo combines high-resolution Fourier transform ion cyclotron resonance mass spectrometry (FTICR) with electron-capture dissociation (ECD), a mass spec fragmentation method in which an ion in the mass spectrometer interacts with free electrons, causing the protein to fracture along its peptide backbone. By measuring the mass of those fragments with high precision, researchers can determine the protein’s amino acid sequence.
In Loo’s case, though, that fragmentation is not uniform along the length of the protein. Proteins usually are denatured for mass spectrometry analysis, but the protein complexes in his studies are intact—a process called native mass spectrometry. Fragmentation thus occurs preferentially on the surface of the complex, like the cracks in the shell of a hard-boiled egg. “You get limited sequence information, but that sequence information comes from regions that are specific to its 3-D structure,” he says (Anal Chem, 86:317-20, 2014).
Native Top-Down ESI-MS of 158 kDa Protein Complex by High Resolution Fourier Transform Ion Cyclotron Resonance Mass Spectrometry
Fourier transform ion cyclotron resonance mass spectrometry (FT-ICR MS) delivers high resolving power, mass measurement accuracy, and the capabilities for unambiguously sequencing by a top-down MS approach. Here, we report isotopic resolution of a 158 kDa protein complex – tetrameric aldolase with an average absolute deviation of 0.36 ppm and an average resolving power of ~520,000 at m/z 6033 for the 26+ charge state in magnitude mode. Phase correction further improves the resolving power and average absolute deviation by 1.3 fold. Furthermore, native top-down electron capture dissociation (ECD) enables the sequencing of 149 C-terminal amino acid (AA) residues out of 463 total AAs. Combining the data from top-down MS of native and denatured aldolase complexes, a total of 58% of the backbone cleavages efficiency is achieved. The observation of complementary product ion pairs confirms the correctness of the sequence and also the accuracy of the mass fitting of the isotopic distribution of the aldolase tetramer. Top-down MS of the native protein provides complementary sequence information to top-down ECD and CAD MS of the denatured protein. Moreover, native top-down ECD of aldolase tetramer reveals that ECD fragmentation is not limited only to the flexible regions of protein complexes and that regions located on the surface topology are prone to ECD cleavage.
“Native” mass spectrometry (MS) is an emerging technique that has been successfully used to characterize intact, noncovalently-bound protein complexes, providing stoichiometry and structural information that is complementary to data supplied by conventional structural biology techniques.1–3 To confidently characterize protein complexes, electrospray ionization (ESI)-MS measurements acquired with isotopic resolving power (RP) and high mass accuracy and capabilities for deriving primary structure, i.e., sequence, information would be ideal. Fourier transform ion cyclotron resonance mass spectrometry (FT-ICR MS) is prominent for its superior resolving power and mass accuracy and its utility for tandem MS (MS/MS) with a variety of fragmentation techniques; FT-ICR MS is noted for characterizating posttranslational modifications (PTMs) and protein-ligand and protein-protein interactions.4–9 However, it remains challenging to isotopically resolving large biomolecules over 100 kDa due to sample heterogeneity, cation/solvent/buffer addition, space charge effects, and electric and magnetic field inhomogeneity (for FT-ICR).10–13 Unit mass resolution has been achieved for a few denatured proteins, including a 112 kDa protein with 3 Da mass error using a 9.4 T FT-ICR MS,14 a 115 kDa protein by a 7 T instrument with a mass error of 5 ppm,4 and a 148 kDa protein with a mass error of 1 Da by a 9.4 T FTMS.10
Compared to denatured proteins, it is more difficult to achieve isotopic resolution for inherently lower charged (and thus, higher m/z) native protein complexes because (1) the peak height is proportional to its charge state, (2) the resolving power is inversely proportional to mass-to-charge ratio for FT-ICR MS, and (3) the broader isotope distribution of large biomolecules reduces overall signal-to-noise ratio.15 However, the introduction of a new FT-ICR analyzer cell – the ParaCell, by Nikolaev and coworkers has significantly increased the resolving power of FT-ICR MS.16, 17 By dynamically harmonizing the electric field potential at any radius of cyclotron motion in the entire cell volume, a resolving power of 39 M has been achieved for the alkaloid, resperine (m/z 609), using a 7 T system.18 In addition, a few native protein complexes, including enolase dimer (93 kDa, RP ~ 800,000 at m/z 4250), alcohol dehydrogenase tetramer (147 kDa, RP ~ 500,000 at m/z 5465), and enolase tetramer (186 kDa), have been isotopically resolved with a 12 T FT-ICR system with the new ICR cell.18 Although Mitchell and Smith reported that cyclotron phase locking due to Coulombic interactions limits the highest mass that unit mass resolution can be achieved by FT-ICR MS (Mmax ≈ 1×10⁴B, where B is magnetic field strength),19 the ParaCell has made it significantly easier and promising to measure high resolution mass spectra for large native protein complexes.
……
Native top-down CAD and ISD were performed for the aldolase tetramer; dissociation of the tetramer to yield monomer was observed in both approaches and no sequence information was obtained. The cleavage sites from ECD (colored in red) and CAD (colored in green) of the denatured aldolase monomer (26+) are overlaid with the native ECD results for aldolase tetramer (Figure 2B). As shown in Figure 2B, in contrast to the limited number of c-ion fragments observed in the ECD of aldolase tetramer, ECD of denatured aldolase monomer induces extensive c-ion fragments in the N-terminal region and enables the assignment of first 156 N-terminal AA residues. Surprisingly, the number of z•-ions observed from ECD of the denatured aldolase monomer is much less compared to the ECD of the native aldolase tetramer. Although it may be possible that the z•-ions may undergo secondary fragmentation due to excess available energy, electrons, or long ion-electron reaction times during the ECD experiment, ECD experiments with reduced reaction time and bias voltages were performed and the results argue against this assumption. Overall, 58% of the total number of backbone bonds are cleaved from combining top-down MS of native aldolase complex and denatured aldolase monomer (20% for native ECD of aldolase tetramer, 37% for ECD of denatured aldolase, and 5% for CAD of denatured aldolase).
The three dimensional structure of the aldolase tetramer is shown in Figure 3. To compare the flexibility of the structure to the data from ECD of the aldolase tetramer, one of the subunits (B-chain) is presented as B-factor putty and the D-chain is shown with its native ECD backbone cleavage regions colored in red. The remaining A- and C-chains are shown in grey. Although the C-terminal region (AA 340–363) of each subunit is highly flexible based on the crystallography B-factor (see B-chain in Figure 3A), only 4 out of 75 backbone cleavage sites are from the AA 340–363 region. Instead, the native ECD fragments largely originate from surface regions of the protein structure (see D-chain in Figure 3A). The N-terminal regions are not directly involved in the interfaces between subunits, but they are located in regions that are partially buried, which is consistent with the limited c-ions observed. To better show the native ECD backbone cleavage regions, the D-chain is rotated 90 degrees clockwise (Figure 3B). It is clear that, although protein structure flexibility might play a role in the native top-down ECD fragmentation pattern, for aldolase the ECD cleavage sites are not limited to the flexible region. In addition, backbone cleavage regions from CAD (yellow) and ECD (cyan) of denatured aldolase are complementary with the native ECD results.
A) Structure of tetrameric aldolase (1ZAH)29. A- and C-chains are shown as grey ribbons, the B-chain is shown in B-factor putty, and the D-chain is in cartoon with native ECD cleavage sites colored in red, CAD cleavage sites of denatured aldolase in yellow, and ECD cleavage sites of the N-terminal region from ECD of denatured aldolase in cyan. B) The D-chain is rotated 90 degrees clockwise to show the outer surface region of the subunit structure.
Also evident in such data sets are protein–small molecule interactions. As the proteins break apart, Loo explains, ligands often remain attached to the polypeptide shards that are produced. In one recent publication, for instance, his team mapped zinc binding sites in eukaryotic alcohol dehydrogenase, a 147-kDa tetrameric complex (J Am Soc Mass Spectrom, 25:2060-8, 2014).
Revealing Ligand Binding Sites and Quantifying Subunit Variants of Non-Covalent Protein Complexes in a Single Native Top-Down FTICR MS Experiment
“Native” mass spectrometry (MS) has been proven increasingly useful for structural biology studies of macromolecular assemblies. Using horse liver alcohol dehydrogenase (hADH) and yeast alcohol dehydrogenase (yADH) as examples, we demonstrate that rich information can be obtained in a single native top-down MS experiment using Fourier transform ion cyclotron mass spectrometry (FTICR MS). Beyond measuring the molecular weights of the protein complexes, isotopic mass resolution was achieved for yeast ADH tetramer (147 kDa) with an average resolving power of 412,700 at m/z 5466 in absorption mode and the mass reflects that each subunit binds to two zinc atoms. The N-terminal 89 amino acid residues were sequenced in a top-down electron capture dissociation (ECD) experiment, along with the identifications of the zinc binding site at Cys46 and a point mutation (V58T). With the combination of various activation/dissociation techniques, including ECD, in-source dissociation (ISD), collisionally activated dissociation (CAD), and infrared multiphoton dissociation (IRMPD), 40% of the yADH sequence was derived directly from the native tetramer complex. For hADH, native top-down ECD-MS shows that both E and S subunits are present in the hADH sample, with a relative ratio of 4:1. Native top-down ISD MS hADH dimer shows that each subunit (E and S chain) binds not only to two zinc atoms, but also the NAD+/NADH ligand, with a higher NAD+/NADH binding preference for the S chain relative to the E chain. In total, 32% sequence coverage was achieved for both E and S chains.
Studying how proteins interact with one another and assemble on a structural basis is key to understanding biological processes and their function. As a complementary technique to conventional technologies used in structural biology, such as nuclear magnetic resonance (NMR) spectroscopy, X-ray crystallography, and electron microscopy, “native” mass spectrometry (MS) has established its crucial role in the characterization of intact noncovalently-bound protein complexes, revealing the composition, stoichiometry, dynamics, stability, and also spatial information of subunit arrangements in protein assemblies [1–11]. To date, most native MS studies of protein complexes have been performed using quadrupole time-of-flight (Q-TOF) MS instruments with electrospray ionization (ESI). Because of the efficient transmission of high mass and highm/z ions using TOF analyzers, large proteins with molecular weights up to 18 MDa have been studied [12,13]. The coupling of ion mobility spectrometry (IMS) with mass spectrometry provides a new dimension to the analysis of biomolecules [14]. With IMS, ions are separated based on size and shape, and the IMS-derived collision cross-section information can be used to understand the topological properties of gas phase protein complexes. Surface induced dissociation (SID) has been recently added for the purposes of disassembling protein complexes into sub-complexes that appear to better reflect the structure of the solution phase complexes [15–17]. The capability of Orbitrap MS has been extended significantly for the analysis of macromolecules, with greatly improved mass (and m/z) range and resolving power to measure the binding of ADP and ATP to the 800 kDa GroEL complex [18].
Fourier transform ion cyclotron resonance mass spectrometry (FTICR MS) is known for its superior resolving power and mass accuracy and its capabilities for tandem MS (MS/MS) with a variety of fragmentation techniques. Particularly, after the introduction of electron capture dissociation (ECD) [19], FTICR MS quickly established its utility for protein top-down protein sequencing, post-translational modification characterization, and protein gas phase studies [20–34]. Polypeptide backbone bonds are cleaved by ECD, but non-covalent interactions are preserved, which therefore makes the native top-down MS study of the non-covalent interaction sites of protein-ligands complexes more feasible. Our group and others have successfully applied top-down ECD-MS to pinpoint the interaction sites of several protein-ligand system [35–38], and this can be enhanced by “supercharging” [35]. An early attempt of applying ECD-MS to the study of large protein complexes was made by Heeren and Heck, but little topology and sequence information was derived [39]. However, the Gross group starting in 2010 made the first breakthrough for the study of large protein complexes using native top-down ECD with FTICR MS. Besides obtaining molecular weight, sequence, and metal-binding site information in a single MS experiment, they correlated the origins of ECD product ions to the flexible regions of proteins as determined by the “B-factor” from the X-ray crystal structures of protein complexes [40, 41]. Therefore, native top-down ECD has been proposed as a tool to probe the flexible regions of protein complexes. Our group recently also demonstrated the capability of obtaining sequence information and isotopic mass resolution of a noncovalently-bound protein complex of 158 kDa using native top-down FTICR MS, and most importantly, we found that the origin of ECD fragments is not limited only to the flexible region of the protein complex (e.g., tetrameric aldolase), but also largely from the surface of the complex [42].
The application of FTICR MS for native top-down interrogation of large non-covalent bound protein complexes is still in its infancy. Here, for the purpose of further exploring the capability of FTICR MS in the analysis of large protein complexes, various fragmentation techniques including in-source dissociation (ISD), collisionally activated dissociation (CAD), ECD, and infrared multiphoton dissociation (IRMPD) were applied in the native top-down MS studies of a 80 kDa dimeric protein complex and a 147 kDa tetrameric protein complex. The results demonstrate that with the superior resolving power, mass accuracy, and versatile fragmentation techniques of FTICR MS, rich information, including isotopic mass resolution, amino acid sequence, point mutations, metal/ligand binding sites, and identification and quantification of subunit variants can be accomplished in a single native top-down FTICR MS experiment.
Still, Loo admits, the technique “is not really ready for prime time.” His team is collecting ECD data on a bank of proteins of known structure to ensure the data they collect really do reflect protein topology. In the meantime, they are working to extend the size of the complexes they can analyze. The technique’s current limit is 800 kDa.
GO NATIONAL: FTICR mass spectrometers offer top-of-the-line accuracy and resolution, with price tags to match. Few researchers have direct access to them, Loo says, but they can always try the national laboratories. Both the National High Magnetic Field Laboratory at Florida State University and the Environmental Molecular Sciences Laboratory at the Pacific Northwest National Laboratory have user facilities open to worthy projects.
Determining the architecture of protein complexes
RESEARCHER: Vicki Wysocki, Ohio Eminent Scholar and Professor of Chemistry and Biochemistry, Ohio State University
PROJECT: Instrumentation development for whole-complex analysis
SOLUTION: An analytical chemist by training, Wysocki focuses on instrumentation development for protein-complex analysis. Among the discoveries in her lab is a method called surface-induced dissociation (SID).
HIT THE WALL, JACK: When it comes to molecular collision in a mass spectrometer, size matters. Collide a complex with small gas molecules, and proteins in the complex will simply unravel (top). By smacking them into a “wall”—a process called surface-induced dissociation—the complex dissociates to reveal its underlying architecture. COURTESY OF VICKI WYSOCKI
Like many other fragmentation approaches, SID works by forcing an ion in the mass spectrometer to collide with another object. Usually that object is a small gas molecule, with the energy of collision sufficient to crack the peptide backbone. But for large protein complexes, bigger is better, and the collision partner in SID is as big as it can get: the method slams protein ions of interest into a nonreactive surface inside the instrument—essentially, a wall—causing complexes to fracture into subcomplexes that reveal the assembly’s inner architecture.
Wysocki combined this approach with ion-mobility separation—a kind of gas-phase electrophoresis that resolves molecules by their size and shape—to dissect an enzyme involved in antibiotic production. The enzyme, they found, has two copies each of three subunits, alpha, beta, and gamma, arranged as a pair of triads sitting on top of one another, with the alpha and beta subunits of one triad linked more tightly to each other than either is to gamma (Anal Chem, 83:2862-65, 2011).
Such information can be valuable to protein engineers, Wysocki says, especially as this particular complex otherwise falls into a structural biology knowledge gap: “It doesn’t crystallize, and it’s too small for the cryoEM and a little bit large for NMR,” she says. “And so, mass spec turned out to be a great tool.”
Revealing the Quaternary Structure of a Heterogeneous Noncovalent Protein Complex through Surface-Induced Dissociation
As scientists begin to appreciate the extent to which quaternary structure facilitates protein function, determination of the subunit arrangement within noncovalent protein complexes is increasingly important. While native mass spectrometry shows promise for the study of noncovalent complexes, few developments have been made toward the determination of subunit architecture, and no mass spectrometry activation method yields complete topology information. Here, we illustrate the surface-induced dissociation of a heterohexamer, toyocamycin nitrile hydratase, directly into its constituent trimers. We propose that the single-step nature of this activation in combination with high energy deposition allows for dissociation prior to significant unfolding or other large-scale rearrangement. This method can potentially allow for dissociation of a protein complex into subcomplexes, facilitating the mapping of subunit contacts and thus determination of quaternary structure of protein complexes.
The majority of proteins exist and perform their functions as multimers of varing stoichiometries and architecture.1 However, very few methods are available that can provide insights into subunit interactions. Native mass spectrometry (MS) is increasingly being used to study noncovalent protein complexes, as many structural features found in solution may be maintained in the gas phase.2,3 While subunit stoichiometries are readily obtainable by mass measurement alone, the determination of subunit arrangement within protein complexes remains a significant challenge. This is particularly true for heterogeneous complexes with multiple types of subunits. Considerable progress has been made using solution-phase disruption to divide the original protein complex into smaller subcomplexes, which may be readily measured by MS.4,5 The composition of the stable subcomplexes provides insight on the topology of the protein complex. However, MS activation methods used to date have fallen short of providing subunit topology. Here, we present the first evidence for subunit arrangement obtained directly from gas-phase experiments on a heterogeneous complex via surfaceinduced dissociation (SID). We have demonstrated previously the ability of SID to yield unique dissociation pathways for protein complexes, resulting in complementary information to collision-induced dissociation (CID).68 While the SID process is not yet well understood for macromolecules, there is a large body of work concerning SID of small molecules; influential factors such as collision energy, surface composition, and translational-to-vibrational energy conversion have been well-studied.911 The higher effective mass of a surface relative to that of neutral gas atoms used in CID (typically argon) results in significantly higher energy deposited through a single surface collision.9 As SID is a single-collision activation process, rather than activation via thousands of less energetic collisions as in CID, dissociation pathways other than those of the lowest energies become accessible
……
This is the only study to date demonstrating an ion activation method capable of yielding extensive dissociation, as well as the release of intact subcomplexes, thus providing relevant substructure information on a noncovalent, hetero-oligomeric protein complex. The capacity to produce intact, charge-symmetric subcomplexes suggests that dissociation occurs faster than subunit unfolding and that a significant degree of secondary and tertiary structure is maintained up to the point of dissociation and for some period of time afterward. Identification of trimeric substructure in TNH provides insight into a protein with little previous structural characterization and indicates a promising advancement of MS as a tool for structural biology.
Such information can be valuable to protein engineers, Wysocki says, especially as this particular complex otherwise falls into a structural biology knowledge gap: “It doesn’t crystallize, and it’s too small for the cryoEM and a little bit large for NMR,” she says. “And so, mass spec turned out to be a great tool.”
CHOOSE MASS: Mass spec may not be the only method for quickly working out protein structure, but it surely is the fastest, Wysocki says. She recalls one instance when a colleague sent over a complex that his group couldn’t crack. “In one afternoon, my student gave them a prediction of the structure: this one’s a heptamer, with a large subunit sitting atop a hexameric ring.” Even if the experiment doesn’t work, she adds, that fast turnaround time can be a boon, as collaborators can get rapid feedback for tweaking their experimental conditions. “Mass is a great thing.”
Sophisticated testing instruments, as well as integrated calibration and error correction software (or stand-alone software systems), can evaluate today’s complex designs. Such tools position designers to successfully tackle challenges in the even faster data environment of the future.
The demand for optical network data has soared, with rates of 100 Gb/s evolving into 400 Gb/s, 1 Tb/s and beyond, pushing designers to explore inventive and even unconventional modulation schemes in order to encode data more efficiently for faster throughput. In this context, it can pay off for designers to think about how to optimize their testing environment to quickly and accurately evaluate design progress.
When considering a coherent optical modulation analysis system, it’s important to consider the signal fidelity of its acquisition system. This typically includes an optical modulation analyzer (OMA) or coherent receiver, as well as a digitizer (usually an oscilloscope), and some form of algorithmic processing.
When purchasing a coherent optical acquisition system, users must look beyond obvious performance parameters, such as coherent receiver bandwidth and oscilloscope sample rate. Consider also these vital questions:
• Does this OMA achieve the lowest possible error vector magnitude (EVM) value for the acquisition system? And is this oscilloscope the most effective digitizer available? These two considerations have an obvious impact on measured signal quality.
• Is the analysis software that comes with the OMA adequate for testing the complexities of the design or research?
• Do these instruments meet not only present acquisition needs, but also anticipated needs in one year, two years or even longer?
Achieving low EVM and high ENOB
Signal quality is obviously critical to testing success. EVM is often seen as a representation of the overall signal quality — the lower the better. An EVM is simply the vector that points from the actual measured symbol to where that symbol was intended in the signal constellation diagram.
The manufacturing process can introduce a wide range of system impairment and configuration issues into the OMA, which can adversely impact the receiver EVM. These include IQ (in-phase and quadrature) phase angle errors, IQ gain imbalance, IQ skew errors, and XY polarization skew errors. The good news is that some OMAs are able to precisely measure these manufacturing errors and calibrate their impacts in the algorithmic processing that typically follows coherent detection.
With these OMAs, each receiver is tested at the time of manufacture, and a unique calibration file is created. It is later automatically used by the optical modulation analyzer software that comes with the receiver to remove the impacts discussed above during acquisition.
Figure 1 offers an example of the software that accompanies a Tektronix OM4245 45-GHz OMA. Unique calibration files are created for all Tektronix OMAs at the time of manufacture, so that the software can remove any impacts. Once the signal is received by the OMA, the next step is to digitize it on the electrical signal paths using a multichannel oscilloscope. This can introduce a number of factors that can affect the EVM, the most fundamental being the oscilloscope’s bandwidth and sample rate.
Figure 1. An example of the software that accompanies optical modulation analyzer (OMA) systems; here, a Tektronix OM4245 45-GHz OMA is shown.
Assuming an oscilloscope with the appropriate bandwidth and sample rate is utilized, and that all OMA impairments are being corrected algorithmically as described above, achieving the lowest measurable EVM comes down to a function of the effective number of bits (ENOB) of the oscilloscope. The ENOB is measurably impacted by the way the oscilloscope handles interleaved sampling. Some real-time oscilloscopes use frequency interleaving techniques in order to extend bandwidth, but they do so at the cost of increasing the noise in the measurement channel.
The limitation of the frequency interleaving approach lies in how the various frequency ranges are added together to reconstruct the final waveform, a step that compromises noise performance. In traditional frequency interleaving, each analog-to-digital converter (ADC) in the signal acquisition system only “sees” part of the input spectrum. But other oscilloscopes, such as the one shown in Figure 2, use a time-based interleaving approach, where all the ADCs see the full spectrum with full signal path symmetry. This approach preserves signal fidelity and ensures the highest possible ENOB.
Figure 2. Some oscilloscopes, such as this one, provide signal acquisition up to 70-GHz bandwidth. Its asynchronous time interleaving (ATI) architecture provides a low-noise, real-time signal acquisition and high effective number of bits (ENOB).
Analysis for conclusive evaluation
Any test and measurement coherent receiver comes with some sort of analysis and visualization software package. But will that software have the particular types of measurement and visualization tools needed for evaluating specific designs or research?
For example, when evaluating the quality of a new phase recovery algorithm, OMA software may be needed. This type of software can provide not only the basic building blocks for measurements but also allows the complete customization of the signal processing. Stand-alone optical analysis software packages of high quality are on the market. Some include features such as a library of analysis algorithms designed specifically for coherent optical analysis and executed in a customer-supplied MATLAB installation, with an applications programmatic interface (API) to these algorithms. Some provide a graphical user interface with optical tools that analyze complex modulated optical signals without needing to know any MATLAB, analysis algorithms or software programming, as shown in Figure 3.
Figure 3. The user interface of software like this, Tektronix’s OM1106 Coherent Optical Analysis system, allows the user to conduct a detailed analysis of complex modulated optical signals without requiring knowledge of MATLAB, analysis algorithms or software programming.
Flexible measurement-taking software also is available. For instance, measurements can be made solely through the user interface, or via the programmatic interface to and from MATLAB for customized processing. Using both methods together is also an option, made possible by employing the user interface as a visualization and measurement framework, around which custom processing can be built.
Most software includes sophisticated core processing algorithms for analyzing coherent signals — estimating the signal phase, determining the signal clock frequency, performing ambiguity resolution, estimating the power spectral density, etc. — but some packages can customize the core processing algorithms. This provides an excellent method for conducting signal processing research. For instance, in order to speed up the development of signal processing routines, one user interface provides a dynamic MATLAB integration window (Figure 4).
Figure 4. A dynamic MATLAB integration window helps speed up the development of signal processing routines.
Any MATLAB code typed in this window is executed on every pass through the signal processing loop. This allows the “comment out” function calls, writing of specific values into data structures, or modification of signal processing parameters on the fly without having to stop the processing loop or modify the MATLAB source code.
Future-proofing an acquisition system
While the bulk of today’s coherent optical R&D activity is focused on 100-G signals, R&D with 400-G signals is already underway at many sites. Testing at 400 G may well be needed within the lifetime of many 100-G test instruments. Therefore, it makes sense to buy equipment at the right performance and price for 100 G now, but also to ensure that future expansion into 400 G is possible.
But how? Typically, four channels of 33-GHz real-time oscilloscope acquisition are used to test 100-G signals. In order to test 400-G signals in the future, bandwidths greater than 65 GHz will be needed, especially for a full dual-polarization system. But if testing at 100 G is all that’s needed now, it could be hard to justify the additional expense. One way around this problem is to purchase a system with a flexible, modular design, and one that uses distributed processing to allow for additional capacity for the system as needed.
For example, Figure 5 shows a system with four channels of 33-GHz acquisition that are distributed across two stand-alone oscilloscopes (left). The instruments are connected by a high speed bus, which not only provides a common external trigger between the two but also includes a common 12.5-GHz sample clock. The result is that the two oscilloscopes are combined to form, in effect, a single instrument whose acquisition-to-acquisition jitter across all channels delivers the same level of measurement precision as a stand-alone, monolithic oscilloscope.
Figure 5. Shown here is a modular way to build coherent optical testing systems from 100 to 400 G using an oscilloscope connected by cables. The processing is distributed and provides a common trigger without acquisition-to-acquisition jitter.
The system shown in Figure 5 also has two 70-GHz channels (one in each unit). Therefore, by simply switching from the 33-GHz channels to the 70-GHz channels, the oscilloscope bandwidth and sample rate can both be doubled. This permits a “peek” at single-polarization 400-G signals using the 100-G test system, as shown in the middle of the illustration. When the time comes to perform full 400-G testing, a second system can be added to the first with another high speed bus, providing two more channels of 70-GHz acquisition. This creates a system that is capable of full dual-polarization coherent optical acquisition (as demonstrated on the right). As the base units are stand-alone oscilloscopes, the systems can also be scaled down and redeployed to other projects as needed when a project comes to an end.
Meet the author
Chris Loberg is a senior technical marketing manager at Tektronix Inc., responsible for oscilloscopes in the Americas region; email: christopher.j.loberg@tektronix.com.
Ultrafast lasers simplify fabrication of 3D hydrogel tissue scaffolds
Multimode holographic waveguides tackle in vivo biological imaging
Mid-infrared Lasers CMOS silicon-on-sapphire process produces broad mid-IR supercontinuum
Looking Back/Looking Forward: Positioning equipment—the challenge of building a solid foundation for optics Stability and precision have been crucial for optics since the 19th century. Jeff Hecht
Monolithic DFB QCL array aims at handheld IR spectral analysis Many QCLs combined on a single chip demonstrate fully electronic wavelength tuning for stand-off IR spectroscopy of explosives and other materials.
Mark F. Witinski, Romain Blanchard, Christian Pfluegl, Laurent Diehl, Biao Li, Benjamin Pancy, Daryoosh Vakhshoori, and Federico Capasso
Quantum dots and silicon photonics combine in broadband tunable laser
A new wavelength-tunable laser diode combines quantum-dot technology and silicon photonics with large optical gains around the 1310 nm telecom window.
Tomohiro Kita and Naokatsu Yamamoto
Computer modeling boosts laser device development
A full quantitative understanding of laser devices is boosted by computer modeling, which is not only essential for efficient development processes, but also for identifying the causes of unexpected behavior.
Rüdiger Paschotta
Monolithic DFB QCL array aims at handheld IR spectral analysis
MARK F. WITINSKI, ROMAIN BLANCHARD, CHRISTIAN PFLUEGL, LAURENT DIEHL, BIAO LI, BENJAMIN PANCY, DARYOOSH VAKHSHOORI, and FEDERICO CAPASSO
Advances in infrared (IR) laser sources, optics, and detectors promise major new advances in areas of chemical analysis such as trace-gas monitoring, IR microscopy, industrial safety, and security.
One key type of photonic device that has yet to reach its full potential is a truly portable noncontact (standoff), chemically versatile analyzer for fast Fourier-transform infrared (FTIR)quality spectral examination of nearly any condensed-phase material. The unique challenges of standoff IR spectroscopy actually extend beyond advances in IR hardware, requiring the proper combination of several areas of expertise: cutting-edge optical design and laser fabrication, integrated laser electronics, thermally efficient hermetic packaging, statistical signal processing methods, and deep chemical knowledge.
At the core of the approach we have taken at Pendar Technologies is the monolithic distributed feedback (DFB) quantum-cascade laser (QCL) array. Invented in Federico Capasso’s group at Harvard University (Cambridge, MA) and licensed exclusively to Pendar, the continuously wavelength-tunable QCL array source is a highly stable broadband source that can be used for illumination in reflectance spectroscopy. Each element of the array is individually addressable and emits at a different wavelength by design.
The advantages of these QCL arrays over external-cavity (EC) QCLs stem from (1) the monolithic structure of QCL arrays and (2) their fully electronic wavelength tuning— that is, no moving gratings, allowing for much-higher-speed acquisition through improved amplitude and wavelength stability. When integrated into a system, the result is robust, stable, and field-deployable.
One of the key advances that has enabled this technology to be fielded is the high-yield fabrication of each laser ridge in the QCL array from a single wafer such that every channel simultaneously meets the specified wavelength, power, and single-mode suppression ratio. Each of these parameters is critical to both efficient beam combining and to obtaining high-quality molecular spectroscopy once integrated.
With these hurdles largely overcome, the payoff in terms of spectrometer performance lies largely in a demonstrated shot-to-shot amplitude stability in pulsed mode of <0.1%—a factor of 50 more stable than is typical for EC QCLs, even when used in the lab. Most importantly, the DFB QCL noise is random, and averages toward an Allan variance limit quickly such that detector-noise-limited, high-quality spectra can be obtained for trace levels (for example, 1–50 µg/cm2) of typical powders in just 100 ms.
More DFB array advantages While the stability advantage of DFBs vs. EC configurations has been well established, there are a few less-obvious aspects to DFB arrays that make them more suitable to real-world spectroscopy tools and, in particular, portable spectroscopy tools. For one, the laser array as a whole can maintain a 100% duty cycle while each laser in the array requires operation only over a 100/n (%) duty cycle, where n is the number of lasers in the array. Put another way, a laser array consisting of only pulsed QCLs can operate as a truly continuous-wave (CW) system, allowing for high-measurement duty cycle while possibly reducing the cost of fabrication.
In a related way, generating light for an array that has a 100% aggregate duty cycle (by using, for instance, 32 lasers at 3% duty cycle), the thermal heat-sinking requirements of the source are dramatically reduced. Indeed, our packaged prototypes do not even require active cooling to keep the system cool enough to run. A thermoelectric cooler is built into the package only to stabilize the temperature, which therefore stabilizes the 32 wavelengths (see Fig. 1).
FIGURE 1. A 200 cm-1 prototype QCL array with 32 QCLs is shown prior to beam combining and packaging (a), and experimental spectra from 32 adjacent QCLs are seen (b). (Courtesy of Pendar Technologies)
Finally, the arbitrary programmability of the QCL array opens up many new possibilities for experimental optimization. Certain lasers can be skipped, multiple lasers can fire at once, repetition rates and pulse durations can be set for each element, and so on. These advantages are only truly realized when the QCL array is instrumented into a full system.
Looking holistically at how best to integrate this new capability into a full system, it is critical to draft the link equations that govern the use of electrons to produce photons, the collection of photons scattered back, and finally the conversion from raw spectral information to chemical identification. In the case of mid-IR material identification, it becomes clear that three aspects are particularly consequential: (1) How broad a wavelength range is needed for the tool to be of maximum specificity without producing redundant or useless chemical information (that is, how many laser channels should be used, how should they be spaced with respect to one another, and over what total wavelength regime should they be spaced); (2) the mechanical and electro-optical design of the instrument; and (3) how to get the highest performance regressions against reference spectra while maintaining the high-speed identification that the QCL array actually enables.
With regard to the wavelength regions of interest (see Fig. 2), most of the spectral richness of an IR spectrum is centered in two bands, generally referred to as the functional group region (about 3.3–5.5 µm) and the fingerprint region (about 7–11 µm). The first is typically dominated by the stretch modes of certain common bond groups, while the latter includes bending modes of some functional groups as well as lower frequency modes that are characteristic of the macromolecule “backbone”—for instance, the torsional modes of a toluene ring found in many highly energetic materials. With support from the Department of Homeland Security (DHS)’s Widely Tunable Infrared Source (WTIRS) program and from the Army Research Lab, Pendar is developing a compact array module that fully covers 7–11 µm (900–1430 cm-1).
FIGURE 2. An assemblage of IR spectra of many common explosives shows that each has at least one unique absorption feature in the wavelength ranges selected. The blue shaded box indicates strong water interference in the troposphere. The figure intentionally spans beyond 1800 cm-1 so as to illustrate that no new information is gained for this chemical class by shifting the longwave-IR (LWIR) source further to the blue until the midwave-IR (MWIR) is reached.
System architecture drivers To maximize signal-to-noise (SNR) while minimizing the required acquisition time, the system architecture is driven by the following first-order considerations: 1. Increasing the laser power enabled by relaxed thermal constraints as the heat load is distributed over several modules (arrays) and laser waveguides. 2. Maximization of the measurement duty cycle enabled by the fast purely electronic control of the array, allowing close to zero-delay switching between lasers— that is, a laser is on at any time. This is also enabled by the distributed heat load among the laser units. 3. Improved source stability, wavelength accuracy, pulse-to-pulse amplitude, and frequency repeatability—all of which are needed to ensure that the source noise is not the limiting form of noise (compared to detector or speckle noise). Other researchers have studied the source-noise problem of commercial EC QCLs as well and concluded that the order-of-magnitude advantage in minimum detectable absorbance (MDA) offered by a DFB QCL carries through the full experiment.
Finally, once the spectra are digitized, the system must use complex chemometrics algorithms to ensure confident identification of threats in the presence of chemical clutter, deliberate interferents, and unknown backgrounds, without the intervention of an expert user. Our approach to real-time chemometrics is centered on the fact that for chemically cluttered situations, spectral libraries alone—no matter how large—cannot constitute the sole basis for chemometric analysis. Microphysics modeling and experimentation are also required, particularly in regard to crystal size distribution, clutter interactions, and chemical photolysis/reactions.
The key advance lies in the incorporation of chemical and physical understanding of the targets and their co-indicators. We are currently developing a four-tiered approach to the spectroscopic algorithms challenge:
1. Physics-based models. Reliable chemical detection from standoff measurements will involve transformation of the chemical signatures in the reference spectral library to reflect the physical and environmental conditions of the experiment. A physics-based model will thus be included in the detection algorithm to help us model the variability in a reference spectrum as a function of effects such as vapor pressure, deliquescence, photochemical lifetime, reactive lifetime, decomposition products, and so on to facilitate better comparison with the measured spectrum.
2. Situational effects. Effects of different substrates and their properties on the chemical signatures and the angular dependence of spectra that are not clearly linked to equations of physics and chemistry will be experimentally evaluated and included in the detection algorithm. In particular, experimentally measuring such variability will help us algorithmically model the variability of chemical signatures from some “gold standard” reference signature, which—in
addition to the physical model—will enable better detection strategies.
3. Feature-based classification. Extraction of relevant feature vectors from the reference library spectra and the knowledge of the chemistry to form a hierarchical decision tree that will help us provide different levels of classification based on the customer requirements. For instance, if a customer is only interested in finding out whether a given chemical is an explosive, then we might save on computational cost by avoiding searching through the leaves of the decision tree to find out the exact chemical.
4. Real-time atmospheric measurements. Once validated, the model will be suitable for field implementation by the inclusion of an integrated sensor suite that simultaneously records atmospheric pressure, temperature, relative humidity, solar flux, wind magnitude, and water-vapor mixing ratio. With these design drivers considered, Pendar recently completed the build of a handheld demonstration system.
Figure 3 shows the experimentally obtained spectra for two nonhazardous chemical targets as a function of stand-off distance. The yellow line in each panel shows the library FTIR (“true”) spectrum for each. Agreements of r2 > 0.9 were typical. With the prototype system as an extrapolation point, continued, focused advances in the technology are now underway to open myriad frontiers in molecular spectroscopy.
FIGURE 3. Standoff spectra of of acetaminophen and ibuprofen for three target distances. The black line shows the FTIR of the same using a diffuse reflectance accessory. The only data processing shown is the normalization of the curve areas to a common value.
ACKNOWLEDGEMENT Pendar Technologies was formed in August 2015 through a merger between Pendar Medical (Cambridge, MA), a portable spectroscopy company founded by Daryoosh Vakhshoori (who was previously at Ahura Scientific and CoreTek), and QCL sensing startup Eos Photonics (Cambridge, MA), a Harvard spinoff founded by professor Federico Capasso and his postdocs.
Quantum dots and silicon photonics combine in broadband tunable laser
TOMOHIRO KITA and NAOKATSU YAMAMOTO
A new wavelength-tunable laser diode combines quantum-dot (QD) technology and silicon photonics with large optical gains around the 1310 nm telecom window and is amenable to integration of other passive and active components towards a truly integrated photonic platform.
A new heterogeneous wavelength-tunable laser diode, configured using quantum dot (QD) and silicon photonics technology, leverages large optical gains in the 1000–1300 nm wavelength region using a scalable platform for highly integrated photonics devices. A cooperative research effort between Tohoku University (Sendai, Japan) and the National Institution of Information and Communication Technology (NICT; Tokyo, Japan) has resulted in the demonstration of broadband tuning of 44 nm around a 1230 nm center wavelength with an ultrasmall device footprint, with many more configurations with various performance metrics possible.
Recently developed high-capacity optical transmission systems use wavelength-division multiplexing (WDM) systems with dense frequency channels. Because the frequency channels in the conventional band (C-band) at 1530–1565 nm are overcrowded, the frequency utilization efficiency of such WDM systems becomes saturated. However, extensive and unexploited frequency resources are buried in the near-infrared (NIR) wavelength regions such as the thousand (T) and original (O) bands between 1000 and 1260 nm and 1260 and 1350 nm, respectively. Quantum dot-based optical gain media have various attractive characteristics, including ultrabroad optical gain bandwidths, high-temperature device stability, and small line width enhancement factors, as well as silicon photonic wire waveguides based on silicon-on-insulator (SOI) structures that are easily amenable to constructing highly integrated photonics devices.1-4
Quantum dot-based optical gain media have various attractive characteristics, including ultrabroad optical gain bandwidths, high-temperature device stability, and small linewidth enhancement factors, as well as silicon photonic wire waveguides based on silicon-on-insulator (SOI) structures that are easily amenable to constructing highly integrated photonics devices.1-4
The photonic devices used for shortrange data transmission are required to have a small footprint and low power consumption. Therefore, compact, low-power wavelength-tunable laser diodes are key devices for use in higher-capacity data transmission systems that have been designed to use these undeveloped frequency bands, and our heterogeneous tunable wavelength laser diode consisting of a QD optical gain medium and a silicon photonics external cavity is a promising candidate.5
Quantum dot optical amplifier Ultrabroadband optical gain media spanning the T- and O-band are effectively fabricated by using QD growth techniques on large-diameter gallium-arsenide (GaAs) substrates. Our sandwiched sub-nano-separator (SSNS) growth technique is a simple and efficient method for obtaining high-quality QDs (see Fig. 1).
FIGURE 1. A cross-section (a) shows a quantum dot (QD) device grown using the SSNS technique, resulting in a high-density, highquality QD structure (b) that is used to create a typical SOA (c) using QD optical gain.
In the SSNS method, three monolayers (each around 0.85 nm thick) of GaAs thin film are grown in an indium GaAs (InGaAs) quantum well (QW) under the QDs. We had previously observed many large, coalescent dots that could induce crystal defects in QD devices using a conventional growth technique without SSNS. Now, we can obtain high-density (8.2 × 1010 cm-2), high-quality QD structures since the SSNS technique successfully suppresses the formation of coalescent dots.
For single-mode transmission, a ridgetype semiconductor waveguide was fabricated for single-mode transmission. The cross-section of the semiconductor optical amplifier (SOA) has an anti-reflection (AR) coating facet to connect a silicon photonics chip with low reflection and a cleaved facet used as a reflecting mirror in the laser cavity.
To fabricate the SOA, the SSNS growth technique was combined with molecular beam epitaxy. Quantum dots comprised of indium arsenide (InAs) with 20–30 nm diameters were grown within an InGaAs QW. Seven of these QD layers are stacked to achieve broadband optical gain. Subsequently, this QD-SOA is used as an optical gain medium for the heterogeneous laser, which can be complemented by other communication technology devices such as a high-speed modulator, a two-mode laser, and a photoreceiver.6, 7
Silicon photonics ring resonator filter With the QD-SOA fabricated, a wavelength filter is fabricated next using silicon photonics techniques. It includes a spot-size converter that has a silicon oxide (SiOx) core and a tapered Si waveguide that connects the QD-SOA to the Si photonic wire waveguide while minimizing optical reflections and coupling losses (see Fig. 2).
FIGURE 2. A microscope image (a) shows a silicon-photonicsbased wavelength-tunable filter. In a transmittance analysis (b), the red and blue dotted lines indicate the transmittance of a small ring resonator with free spectral range FSR1 and a large ring resonator with FSR2, respectively, and the solid line indicates the product of each transmittance. The tuning wavelength range is determined from the FSR difference of the two rings. A smaller difference in the FSR provides a wider wavelength tuning range, even when the transmittance difference between the main and side peaks is small.
The wavelength-tunable filter consists of two ring resonators of different size. The Vernier effect of these two ring resonators allows only light of a specific wavelength to reflect to the QD-SOA. Furthermore, Tantalum micro-heaters formed above the resonators provide a means whereby the laser wavelength can be tuned through application of the thermooptic effect.
Essentially, the wavelength tuning operation of the double ring resonator wavelength filter is achieved through Vernier effects wherein a ring resonator acts as a wavelength filter with constant wavelength interval called the free spectral range (FSR), which is inversely proportional to the circumference of the ring. The tuning wavelength range is determined from the FSR difference of the two rings with FSR1 and FSR2.
A smaller difference in the FSR provides a wider wavelength tuning range, even when the transmittance difference between the main and side peaks is small. On the other hand, a sufficiently large transmittance difference is required to achieve stable single-mode lasing and is obtained using large FSR ring resonators.
Silicon photonics allows us to fabricate an ultrasmall ring resonator with large FSR because of the strong light confinement in the waveguide. The ring resonator consists of four circle quadrants and four straight lines and the radius of the circle was chosen to be 10 µm to avoid bending losses. The FSRs of the ring resonators and the coupling efficiency between the bus-waveguide and the ring resonator are optimized to obtain wide wavelength tuning range and sufficient transmittance difference.
The FSRs and the coupling efficiencies of the double ring resonators are designed to obtain a 50 nm wavelength tuning range and 1 dB transmittance difference. We have since fabricated various wavelength-tunable laser diodes, including a broadband tunable laser diode, a narrow spectral-linewidth tunable laser diode, and a high-power integrated tunable laser diode by using a silicon photonics wavelength filter and a commercially available C-band SOA.8, 9
The tunable laser diode Using stepper motor controllers, the QD-SOA—kept at approximately 25°C using a thermoelectric cooler—and the silicon photonics wavelength filter are butt-jointed (see Fig. 3). The lasing wavelength is controlled by the temperature of a micro-heater placed on the ring resonators. With physical footprints of 600 µm × 1 mm and 1 × 2 mm for the wavelength filter and the QD-SOA, respectively, the total device size of the tunable laser diode is just 1 × 3 mm.
FIGURE 3. A schematic shows how the heterogeneous wavelengthtunable laser diode is constructed.
Measured using a lensed fiber, the laser output from the cleaved facet of the QD-SOA shows single-mode lasing characteristics with a laser oscillation threshold current of 230 mA. Maximum fiber-coupled output power is 0.4 mW when the QD-SOA injection current is 500 mA. As the ring resonator temperature is increased by a heater with 2.1 mW/nm power consumption, the superimposed lasing spectra show a 44 nm wavelength tuning range with more than a 37 dB side-mode-suppression ratio between the ring resonator’s modes. The 44 nm wavelength tuning range of our heterogeneous QD/Si photonics wavelength-tunable laser is, to our knowledge, the broadest achieved to date. The 44 nm tuning range around 1230 nm corresponds to 8.8 THz in the frequency domain, which is far larger than the 4.4 THz frequency that is available within the C-band.
Our heterogeneous laser is suitable for use as a light source on a silicon photonics platform that includes other optical components such as high-speed modulators and germanium (Ge)-based detectors. In addition to application as a single-chip broadband optical transceiver for telecommunications, the laser could also be applied to biomedical imaging applications such as optical coherence tomography (OCT), considering the low absorption of NIR light at 1310 nm in the presence of water.
ACKNOWLEDGEMENTS This research was partially supported by the Strategic Information and Communications R&D Promotion Program (SCOPE), of Japan’s Ministry of Internal Affairs and Communications and a Grant-in-Aid for Scientific Research of the Japan Society for the Promotion of Science.
REFERENCES
1. Y. Arakawam and H. Sakaki, Appl. Phys. Lett., 40, 11, 939–941 (1982).
2. D. L. Huffaker et al., Appl. Phys. Lett., 73, 18, 2564–2566 (1998).
3. R. A. Soref, Proc. IEEE, 81, 12, 1687–1706 (1993).
4. B. Jalai and S. Fathpour, J. Lightwave Technol., 24, 12, 4600–4615 (2006).
5. T. Kita et al., Appl. Phys. Express, 8, 6, 062701 (2015).
6. N. Yamamoto et al., Jpn. J. Appl. Phys., 51, 2S, 02BG08 (2012).
7. N. Yamamoto et al., Proc. OFC, Los Angeles, CA, paper W2A.24 (Mar. 2015).
8. T. Kita et al., Appl. Phys. Lett., 106, 11, 111104 (2015).
9. N. Kobayashi et al., J. Lightwave Technol., 33, 6, 1241–1246 (2015).
Computer modeling boosts laser device development
RÜDIGER PASCHOTTA
A full quantitative understanding of laser devices is boosted by computer modeling, which is not only essential for efficient development processes, but also for identifying the causes of unexpected behavior.
Computer modeling can give valuable insight into the function of laser devices. It can even reveal internal details that could not be observed in experiments, and thus allows one to develop a comprehensive understanding from which laser development can enormously profit. For example, the performance potentials of certain technologies can be fully exploited and time-consuming and expensive iterations in the development process can be avoided. Some typical examples clarify the benefits of computer modeling for improved laser device development.
Example 1: Q-switched lasers
FIGURE 1. Evolution of the transverse beam profile (shown with a color scale) and the optical power (black circles, in arbitrary units) in an actively Q-switched laser is simulated with RP Fiber Power software using numerical beam propagation. The color scale is normalized for each round trip according to the timedependent optical power so that the variation of the beam diameter can be seen.
Example 2: Mode-locked lasers
Example 3: Ultrashortpulse fiber amplifiers
FIGURE 2. The evolution of pulse energy and forward ASE powers in a four-stage fiber amplifier system with various types of ASE suppression between the stages, calculated with a comprehensive computer model
FIGURE 3. Form-based software can be used to model laser devices such as a fiber amplifier. It is essential that such forms be made or modified by the user or by technical support, so that they can be tailored to specific applications.
…. more
Documentation and support For any modeling task, documentation of methods and results is essential. The documentation must not only explain details of the user interface, but must inform the user what kind of physical model was used, what simplifying assumptions were made, and what limitations need to be considered. Unfortunately, software documentation is often neglected. In case of doubt, competent technical support should be available—not only for helping with the handling of the software, but also offering detailed technical and scientific advice. For example, a beginner may find it difficult to decide which kind of model should be implemented for a certain purpose and which possibly disturbing effects need to be considered. Such support should come from a competent expert in the field rather than just a programmer.
Rüdiger Paschotta is founder and executive of RP Photonics Consulting, Bad Dürrheim, Germany; e-mail: paschotta@rp-photonics.com; www.rp-photonics.com
In a unique collaboration, University of New South Wales (UNSW), Sydney, and Australian photographer Tamara Dean set out to “show our knowledge seekers in a different light, in their environment. Not in a way the public normally sees them and their work.” They had the ingenious idea to “help take our research out into the world” to showcase scientists working in the elements to address problems like climate change, endangered species, toxic industrial sites and marine pollution.
The result is a compelling photography series that presents a powerful challenge to the stereotype of nerdy researchers working in a lab coats. From studying heat stress on beach sand dunes in Sydney to combining seafaring with mathematical modeling, and from mathematical analysis of colossal fire tornadoes to subterranean sleuthing, the Wild Researchers exhibition transports viewers outside into the landscapes where researchers work. It gives a glimpse of scientists as they really are, in the real-world environments where they acquire data, collect samples and ponder scientific mysteries and discoveries.
“Imagination: it’s not the first word usually associated with research — with science itself — but it’s a vital one,” writes journalist and science writer Ashley Hay in an essay included in the exhibition catalog.
The exhibition’s 12 images showcase university researchers in the field. Most of the 17 researchers featured are working in scientific areas — from mathematics and astronomy to climate change and biotechnology — along with a landscape architect and a philosopher.
Dean’s body of work “powerfully explores the relationship humans have with the natural world,” and she discusses her inspiration for Wild Researchers and how the project brings together her two loves — nature and art making — in a four-minute video. The exhibition was developed and commissioned in 2014 as part of Dean’s UNSW Artist-in-Residency. Her multi-sensory art installation, Here and Now, premiered to critical acclaim at Studio One in February 2015, assisted by the University’s Creative Practice Lab.
The Australian Museum in Sydney is hosting Wild Researchers from November 4 through December 13, 2015. The exhibition also can be viewed on the University of New South Wales (UNSW) Web site at www.wildresearchers.unsw.edu.au.
“I am thrilled that journalist and author Ashley Hay took up our commission of an essay for the exhibition. Just as Tamara has so evocatively conjured up these images, Ashley has worked a different kind of magic. Her essay is a gorgeous meditation on photography, place and science and I commend it to you,” said Denise Knight, Director of Media at UNSW Australia.
Hay observes: “If I could have any piece of knowledge I would ask what these subjects thought about as they sat still — pinned, pressed — as Tamara Dean fixed these richly made images.” Her companion essay is titled “The Fieldwork of Looking and Seeing.”
Hallie Leighton had dense breasts — a fact she discovered only in her late 30s, via a mammogram. She grew up in an Ashkenazi family in New York, pursued a career in writing and worked with organizations promoting peace between Israelis and Arabs. By 2013 she was making a documentary on her father Jan Leighton, an actor who set the record as an actor for appearing in the most roles (2,407 according to the 1985 Guinness Book of World Records). She was never able to complete it. She died that year, at the age of 42.
Every woman in Leighton’s family had breast cancer, so she began getting annual mammograms at 35 — five years earlier than the recommended age. In 2009 the results of Leighton’s mammogram came in as “negative” or “normal”; by 2013 she was bedridden, undergoing her final days of chemotherapy.
When Leighton was first diagnosed in 2010, her doctor told her, “You have breast cancer, and it was there in 2009.” The tumor in Leighton’s breast went undiscovered until it was palpable — and at that point, the cancer was already in stage 4.
“Happygram,” a documentary which exposes some of the shortcomings in mammography, chronicles Leighton’s struggle with cancer and the implications of having dense breasts.
“Most women simply aren’t informed that they have dense breast tissue,” said Leighton’s best friend Julie Marron. She wrote and directed the documentary, which is currently screening at film festivals around the country.
Breast density is defined by the relative amount of fat in relation to the amount of connective and epithelial tissue (tissue that lines blood vessels and cavities). When more than 50% of breast tissue is connective and epithelial tissue, instead of fatty tissue, the breasts are considered dense. Mammography is the only way to determine breast density.
“If you have dense breasts, what looks dense on a mammogram looks the same as a cancer would look. It tends to confuse or confound the physician, and reduces the sensitivity of the mammogram,” said Gerald Kolb, founder and president of The Breast Group, which counsels clients on different technologies in breast care. “Hallie Leighton’s breasts looked like snowballs; there was no chance they were going to find anything with the mammogram.”
Forty percent of women who are screened for breast cancer have dense breast tissue. These women also account for more than 70% of all invasive cancers. “Mammograms are not very effective screening tools for these women, as they miss between 50% and 75% of all invasive cancers in dense breast tissue,” Marron said. “This is obviously a very critical issue when you are dealing with a population that is more likely to develop cancer.”
Ashkenazi women are even more at risk. They are 1.6 times more likely than the general population to have dense breast tissue, according to Kolb. Moreover, one in 40 Ashkenazi women will test positive for one or both of BRCA gene mutations responsible for breast cancer. For the general population, that number is between one in 350 and one in 800.The BRCA 1 or 2 genes don’t cause cancer, they fight cancer, Kolb says. But if the gene is mutated, the body is not as well equipped to fight the cancer.
“A woman with a BRCA mutation has a lifetime risk of around 33% to 87%, depending on the gene and mutation,” Marron said. “Compare this to a lifetime risk of 12% for developing breast cancer for the overall population.” BRCA gene mutations can be inherited from either or both parents, and therefore they can be present in men as well as in women.
Breast density and BRCA gene mutations are not directly related, but both independently present an increased susceptibility to breast cancer.
“The biggest risk is that a doctor is not going to find the cancer when it’s really small,” Kolb said. When a tumor is detected at a centimeter or smaller, there’s a 95% cure rate. But if the cancer is the size of a golf ball by the time it’s detected, Kolb says, the woman has a 60% chance of living for five years, and then her mortality increases dramatically.
The good news is that mammography isn’t the only method of detecting breast cancer; the bad news is that very few people know this. “What we’re trying to do in the density movement is give women enough information so they can ask appropriate questions of a doctor,” Kolb said.
Kolb advises high-risk women to get a genetic risk analysis, which can be performed by a genetic counselor or a radiologist. He advises getting the risk analysis as early as age 25, but doing so is a personal decision. Not every woman is emotionally prepared to know the results.
“Mammography is a starting point,” said Dr. Dennis McDonald, a California-based women’s imager. Additionally, doctors recommend that women with dense breasts get an MRI, which McDonald says is reserved for high-risk women. It’s an expensive, invasive and time-consuming procedure that requires the injection of fluid in order to read the MRI. As of yet, doctors do not know the side effects of getting an annual MRI.
“A doctor should have started [Leighton] on an MRI right away. She was high risk and they chose to just monitor with a mammogram,” Kolb said. “That’s insufficient.”
Breast ultrasound is another alternative for women with dense breast tissue. “Most of the time, breast density doesn’t present a problem [with ultrasounds],” McDonald said. Though the ultrasound is effective in detecting cancer, he says the downside is that radiologists are often not that comfortable with the technology, simply because they have little experience with it. There are also a lot of false positives, he adds, which result in unnecessary exams or biopsies.
As “Happygram” documents, informing women of their breast density and of alternatives to mammography is a highly charged political issue.
“The whole breast cancer industry has grown up around mammograms,” Marron said. “Physicians weren’t educated on [breast density], deliberately so to a certain extent, and refused to inform patients on this issue, which is really outrageous if you think about it.” Marron says that doctors are required by law and ethical guidelines to inform patients of “material” medical information. “There is no legitimate reason that women have not been informed of this information,” she noted.
After Leighton’s diagnosis, she wanted to ensure that other women didn’t suffer the same misfortune of all-too-late tumor discovery on account of dense breast tissue. She gave media interviews, lobbied in Albany and starred in “Happygram,” all the while undergoing chemotherapy. She died four months after the Breast Density Information Bill passed in New York.
Similar legislation has been passed in more than 20 states throughout the country, but not without objection. Many well-intentioned radiologists, poorly informed about alternative screening options, feared that telling women the limitations of mammography would cause them to lose faith in it altogether and not get tested. Others argued that the information would make women anxious, and that it wouldn’t be fair for those who couldn’t afford additional testing. And still further arguments against informing women were possibly impacted by financial considerations, Marron added.
“Women aren’t getting the benefit of full notification across the board yet,” Marron said. “I think that has to change through education. That’s the primary reason we made this movie. There’s been so much resistance within the medical community to telling women. Change isn’t going to come from the medical community, it has to come from the patients.”
Ashkenazi women shouldn’t panic, Kolb says, but they need to carefully examine their breast density and alternative screening options: “Anytime you have a preventative tragedy like that, you have to do everything in your power to stop it from happening.”
Madison Margolin is a freelance writer based in New York. She writes frequently for the Village Voice.
Tweets can give medical professionals a window into the minds of patients, according to a new study published in the Journal of Medical Imaging and Radiation Sciences
Philadelphia, PA, October 28, 2015 – Magnetic Resonance Imaging (MRI) can be a stressful experience for many people, but clinicians have few ways to track the thoughts and feelings of their patients regarding this procedure. While the social networking site Twitter is known for breaking news and celebrity tweets, it may also prove to be a valuable feedback tool for medical professionals looking to improve the patient experience, according to a new study published in the December issue of the Journal of Medical Imaging and Radiation Sciences.
Johnathan Hewis, MSc, PgCert (LTHE), PgCert (BE), BSc Hon, an investigator from Charles Sturt University in Australia, analyzed 464 tweets related to MRI over the course of one month and found that patients, their friends, and family members were sharing their thoughts and feelings about all aspects of the procedure through the microblogging site. Tweets were categorized into three themes: MRI appointment, scan experience, and diagnosis.
Twitter is a giant in the social media space. In 2014, 19% of the entire adult population of the U.S. used Twitter, with almost 90% of those individuals accessing the service from their mobile phones. Because it is so ubiquitous, Twitter can provide crucial new insights to which practitioners would otherwise not be privy. In the study, patients expressed anxiety about many aspects of the process, including a lot of stress over the possibility of bad news. “The findings of this study indicate that anticipatory anxiety can manifest over an extended time period and that the focus can shift and change along the MRI journey,” explained Hewis. “An appreciation of anxiety related to results is an important clinical consideration for MRI facilities and referrers.”
The study found that tweets encapsulated patient thoughts about many other parts of the procedure including the cost, the feelings of claustrophobia, having to keep still during the scan, and the sound the MRI machine makes. One particularly memorable tweet about the sound read, “Ugh, having an MRI is like being inside a pissed off fax machine!”
Not all the tweets were centered around stress. Many friends and family members expressed sentiments of support including prayers and offering messages of strength. Some patients used Twitter to praise their healthcare team or give thanks for good results. Others spoke about the fact they liked having an MRI because it gave them some time to themselves or offered them a chance to nap.
Twitter isn’t just words, it’s also a way to share pictures. “An unexpected discovery of the examination preparation process was the ‘MRI gown selfie,'” revealed Hewis. “Fifteen patients tweeted a self-portrait photograph taken inside the changing cubicle while posing in their MRI gown/scrubs. Anecdotally, the ‘MRI gown selfie’ seemed to transcend age.”
During the course of his analysis, Hewis discovered that many patients took issue with the fact that they were not allowed to select the music they listened to during the MRI. “Music choice,” said Hewis, “is a simple intervention that can provide familiarity within a ‘terrifying’ environment.’ The findings of this study reinforce the ‘good practice’ of enabling patients’ choice of music, which may alleviate procedural anxiety.”
With such a broad reach, social networks like Twitter offer medical practitioners the opportunity to access previously unavailable information from their patients, which can help them continuously improve the MRI experience. “MRI patients do tweet about their experiences and these correlate with published findings employing more traditional participant recruitment methods,” concluded Hewis. “This study demonstrates the potential use of Twitter as a viable platform to conduct research into the patient experience within the medical radiation sciences.”
Assuming that we could visualize pathological processes such as cancer at a very early stage and additionally distinguish the various different cell types, this would represent a giant step for personalized medicine. Xenon magnetic resonance imaging has the potential to fulfil this promise – if suitable contrast media are found that react sensitively enough to the “exposure”. Researchers at the Leibniz-Institut für Molekulare Pharmakologie in Berlin have now found that a class of pumpkin-shaped molecules called cucurbiturils together with the inert gas xenon, enables particularly good image contrast – namely around 100 times better than has been possible up to now. This finding published in the November issue cover article of Chemical Science by the Royal Society of Chemistry points the way to the tailoring of new contrast agents to different cell types and has the potential to enable molecular diagnostics even without tissue samples in the future.
Personalized medicine instead of one treatment for all – especially in cancer medicine, this approach has led to a paradigm shift. Molecular diagnostics is the key that will give patients access to tailor-made therapy. However, if tumors are located in poorly accessible areas of the body or several tumor foci are already present, this often fails due to a lack of sufficient sensitivity of the diagnostic imaging. But such sensitivity is needed to determine the different cell types, which differ considerably even within a tumor. Although even the smallest of tumor foci and other pathological changes can be detected using the PET-CT, a differentiation according to cell type is usually not possible.
Scientists from the FMP are therefore focusing on xenon magnetic resonance imaging: The further development of standard magnetic resonance imaging makes use of the “illuminating power” of the inert gas xenon, which can provide a 10,000-fold enhanced signal in the MRI. To do this, it must be temporarily captured by so-called “cage molecules” in the diseased tissue. This has been more or less successful with the molecules used to date, but the experimental approach is still far from a medical application.
Cucurbituril Provides Stunning Image Contrasts
The research group led by Dr. Leif Schröder at the Leibniz-Institut für Molekulare Pharmakologie (FMP) has now discovered a molecule class for this purpose that eclipses all of the molecules used to date. Cucurbituril exchanges around 100 times more xenon per unit of time than its fellow molecules, which leads to a much better image contrast. “It very quickly became clear that cucurbituril might be suitable as a contrast medium,” reports Leif Schröder. “However, it was surprising that areas marked with it were imaged with a much better contrast than previously.” The explanation is to be found in the speed. Upon exposure, so to speak, cucurbituril generates contrast more rapidly than all molecules used to date, as it only binds the xenon very briefly and thus transmits the radio waves to detect the inert gas to very many xenon atoms within a fraction of a second. In this way, the inert gas is passed through the molecule much more efficiently.
In the study, which appeared in the specialist journal “Chemical Science”, the world’s first MRI images with cucurbituril have been achieved. With the aid of a powerful laser and a vaporized alkali metal, the researchers initially greatly strengthened the magnetic properties of normal xenon. The hyperpolarized gas was then introduced into a test solution with the cage molecules. A subsequent MRI image showed the distribution of the xenon in the object. In a second image, the curcurbituril together with radio waves destroyed the magnetization of the xenon, leading to dark spots on the images.
“Comparison of the two images demonstrates that only the xenon in the cages has the right resonance frequency to produce a dark area,” explains Schröder. “This blackening is possible to a much better degree with cucurbituril than with previous cage molecules, for it works like a very light-sensitive photographic paper. The contrast is around 100 times stronger.”
Time-of-Flight IC Revolutionizes Object Detection and Distance Measurement
Tue, 10/13/2015 – 9:07amby Intersil
New ISL29501 signal processing IC detects objects up to two meters
http://www.mdtmag.com/product-release/2015/10/time-flight-ic-revolutionizes-object-detection-and-distance-measurement
Intersil Corporation has introduced an innovative time-of-flight (ToF) signal processing IC that provides a complete object detection and distance measurement solution when combined with an external emitter (LED or laser) and photodiode. The ISL29501 ToF device offers one-of-a-kind functionality, including ultra-small size, low-power consumption and superior performance ideal for connected devices that make up the Internet of Things (IoT), as well as consumer mobile devices and the emerging commercial drone market.
The ISL29501 overcomes the shortcomings of traditional amplitude-based proximity sensors and other ToF solutions that perform poorly in lighting conditions above 2,000 lux, or cannot provide distance information unless the object is perpendicular to the sensor.
The ISL29501 applies Intersil’s power management expertise to save power and extend battery life through several innovations.
“Prior to Intersil’s time-of-flight technology breakthrough, there was no practical way to measure distance up to two meters in a small form factor,” said Andrew Cowell, senior vice president of Mobile Power Products at Intersil. “The innovative ISL29501 provides customers a cost-effective, small footprint solution that also gives them the flexibility to use multiple devices to increase the field of view to a full 360 degrees for enhanced object detection capabilities.”
Key Features and Specifications
On-chip DSP calculates ToF for accurate proximity detection and distance measurement up to two meters
Modulation frequency of 4.5MHz prevents interference with other consumer products such as IR TV remote controls that operate at 40kHzOn-chip emitter DAC with programmable current up to 255mA
Allows designers to choose the desired current level to optimize distance measurement and power budget
Operates in single shot mode for initial object detection and approximate distance measurement, while continuous mode improve distance accuracy
On-chip active ambient light rejection minimizes or eliminates the influence of ambient light during distance measurement
Programmable distance zones: allows the user to define three ToF distance zones for determining interrupt alerts
Interrupt controller generates interrupt alerts using distance measurements and user defined thresholds
Automatic gain control sets optimum analog signal levels to achieve best SNR response
Supply voltage range of 2.7V to 3.3V
I2C interface supports 1.8V and 3.3V bus
The ISL29501 can be combined with the ISL9120 buck-boost regulator to further reduce power consumption and extend battery life in consumer and home automation applications.
Optoelectronic Implantable Could Enable Two-Way Communication with Brain
Brown University researchers have created a new type of optoelectronic implantable device to access brain microcircuits, synergizing a technique that enables scientists to control the activity of brains cells using pulses of light. The invention, described in the journal Nature Methods, is a cortical microprobe that can stimulate multiple neuronal targets optically by specific patterns on micrometer scale while simultaneously recording the effects of that stimulation in the underlying neural microcircuits of interest with millisecond precision.
“We think this is a window-opener,” said Joonhee Lee, a senior research associate in Professor Arto Nurmikko’s lab in the School of Engineering at Brown and one of the lead authors of the new paper. “The ability to rapidly perturb neural circuits according specific spatial patterns and at the same time reconstruct how the circuits involved are perturbed, is in our view a substantial advance.”
First introduced around 2005, optogenetics has enriched ability of scientists seeking to understand brain function at the neuronal level. The technique involves genetically engineering neurons to express light-sensitive proteins on their membranes. With those proteins expressed, pulses of light can be used to either promote or suppress activity in those particular cells. The method gives researchers in principle unprecedented ability to control specific brain cells at specific times.
But until now, simultaneous optogenetic stimulation and recording of brain activity rapidly across multiple points within a brain microcircuit of interest has proven difficult. Doing it requires a device that can both generate a spatial pattern of light pulses and detect the dynamical patterns of electrical reverberations generated by excited cellular activity. Previous attempts to do this involved devices that cobbled together separate components for light emission and electrical sensing. Such probes were physically bulky, not ideal for insertion into a brain. And because the emitters and the sensors were necessarily a hundreds of micrometers apart, a sizable distance, the link between stimulation and recorded signal was ambiguous.
The new compact, integrated device developed by Nurmikko’s lab begins with the unique advantages endowed by a so-called wide bandgap semiconductor called zinc oxide. It is optically transparent yet able readily to conduct an electrical current.
“Very few materials have that pair of physical properties,” Lee said. “The combination makes it possible to both stimulate and detect with the same material.”
Joonhee Lee, with Assistant Research Professor Ilker Ozden and Professor Yoon-Kyu Song at Seoul National University in Korea, co-developed a novel microfabrication method with Nurmikko to shape the material into a monolithic chip just a few millimeters square with sixteen micrometer sized pin-like “optoelectrodes,” each capable of both delivering light pulses and sensing electrical current. The array of optoelectrodes enables the device to couple to neural microcircuits composed of many neurons rather than single neurons.
Such ability to stimulate and record at the network level on spatial and time scales at which they operate is key, Nurmikko says. Brain functions are driven by neural circuits rather than single neurons.
“For example, when I move my hand, that’s an example of action driven by specific network-level activity in the brain,” he said. “Our new device approach gives scientists and engineers a tool in applying the full power of optogenetics as a means of neural stimulation, while providing the means to read activity of perturbed networks at multiple points at high spatial precision and time resolution.”
Ozden led the initial testing of the device in rodent models. The researchers looked at the extent to which different light intensities could stimulate network activity. The tests showed that increasing optical power led to distinct recruitment of neuronal circuits revealing functional connectivity in the targeted network.
“We went over a range of optical power that was large–over three orders of magnitude–and in so doing we got a range of network-related responses, in particular we could replicate an activity pattern naturally occurring in the brain.” Ozden said. “It gave us a new insight into how optogenetics operates on the network level. This gives us encouragement to go ahead and extend the repertoire and application of the device technology.”
Nurmikko’s group together with the Song lab in Seoul plan to continue further development of the device, ultimately include an access via wireless means. Their next steps anticipate the use of the new device technology as chronic implant in non-human primates at potentially hundreds of points and, depending on progress in worldwide research on optogenetics ahead, perhaps even one day in humans.
“At least, the initial building blocks are here,” Nurmikko said, who conceived the idea with his Korean colleague Song.
Study Advances Possibility of Mind-Controlled Devices
Mon, 10/12/2015 – 10:50amby Ryan Bushey, Associate Editor, R&D
A study published in the journal Nature Medicine has shown a possible path to creating effective neural prosthetics.
The study’s subjects, only listed as T6 and T7, have Amyotropic Lateral Sclerosis (ALS). The scientists performed surgery on them one year ago to place a “neural recording device” in the part of the brain in charge of controlling hand function, notes Bloomberg.
The test documented in the study required T6 and T7 to perform a variety of tasks, such as moving a cursor to hit different targets on a computer screen. The device receives electrical impulses from the brain and morphs them into a computer signal to operate the cursor.
Both test subjects had the highest published performance so far, and even doubled the results of the previous clinical trial participant, according to the study.
The hope is that these devices can improve quality of life for people suffering from paralysis.
Removing 62 Barriers to Pig–to–Human Organ Transplant in One Fell Swoop
Mon, 10/12/2015 – 9:09amby Wyss Institute for Biologically Inspired Engineering
The largest number of simultaneous gene edits ever accomplished in the genome could help bridge the gap between organ transplant scarcity and the countless patients who need them
Never before have scientists been able to make scores of simultaneous genetic edits to an organism’s genome. But now in a landmark study by George Church, Ph.D., and his team at the Wyss Institute for Biologically Inspired Engineering at Harvard University and Harvard Medical School, the gene editing system known as “CRISPR–Cas9” has been used to genetically engineer pig DNA in 62 locations – an explosive leap forward in CRISPR’s capability when compared to its previous record maximum of just six simultaneous edits. The 62 edits were executed by the team to inactivate retroviruses found natively in the pig genome that have so far inhibited pig organs from being suitable for transplant in human patients. With the retroviruses safely removed via genetic engineering, however, the road is now open toward the possibility that humans could one day receive life–saving organ transplants from pigs.
Church is a Wyss Core Faculty member, the Robert Winthrop Professor of Genetics at Harvard Medical School (HMS) and Professor of Health Sciences and Technology at Harvard and MIT. The advance, reported by Church and his team including the study’s lead author Luhan Yang, Ph.D., a Postdoctoral Fellow at HMS and the Wyss Institute, was published in the October 11 issue of Science.
The concept of xenotransplantation, which is the transplant of an organ from one species to another, is nothing new. Researchers and clinicians have long hoped that one of the major challenges facing patients suffering from organ failure – which is the lack of available organs in the United States and worldwide – could be alleviated through the availability of suitable animal organs for transplant. Pigs in particular have been especially promising candidates due to their similar size and physiology to humans. In fact, pig heart valves are already commonly sterilized and de–cellularized for use repairing or replacing human heart valves.
This artistic rendering shows pig chromosomes (background) which reside in the nucleus of pig cells and contain a single strand of RNA, and the Cas9 protein targeting DNA (foreground). The CRISPR–Cas9 gene editing system works like molecular scissors to precisely edit genes of interest. A new advance reported in Science by Wyss Core Faculty member George Church and his team used Cas9 to make 62 edits to the pig genome to remove latent retroviruses, presenting a solution to one of the largest safety concerns that has so far blocked progress in making pig organs compatible for xenotransplant in humans. (Credit: Wyss Institute at Harvard University)
But the transplant of whole, functional organs comprised of living cells and tissue constructs has presented a unique set of challenges for scientists. One of the primary problems has been the fact that most mammals including pigs contain repetitive, latent retrovirus fragments in their genomes – present in all their living cells – that are harmless to their native hosts but can cause disease in other species.
“The presence of this type of virus found in pigs – known as porcine endogenous retroviruses or PERVs – brought over a billion of dollars of pharmaceutical industry investments into developing xenotransplant methods to a standstill by the early 2000s,” said Church. “PERVs and the lack of ability to remove them from pig DNA was a real showstopper on what had been a promising stage set for xenotransplantation.”
Now – using CRISPR–Cas9 like a pair of molecular scissors – Church and his team have inactivated all 62 repetitive genes containing a PERV in pig DNA, surpassing a significant obstacle on the path to bringing xenotransplantation to clinical reality. With more than 120,000 patients currently in the United States awaiting transplant and less than 30,000 transplants on average occurring annually, xenotransplantation could give patients and clinicians an alternative in the future.
“Pig kidneys can already function experimentally for months in baboons, but concern about the potential risks of PERVs has posed a problem for the field of xenotransplantation for many years,” said David H. Sachs, M.D., Director of the TBRC Laboratories at Massachusetts General Hospital, Paul S. Russell Professor of Surgery Emeritus at Harvard Medical School, and Professor of Surgical Sciences at Columbia University’s Center for Translational Immunology. Sachs has been developing special pigs for xenotransplantation for more than 30 years and is currently collaborating with Church on further genetic modifications of his pigs. “If Church and his team are able to produce pigs from genetically engineered embryos lacking PERVs by the use of CRISPR-Cas9, they would eliminate an important potential safety concern facing this field.”
Yang says the team hopes eventually they can completely eliminate the risk that PERVs could cause disease in clinical xenotransplantation by using modified pig cells to clone a line of pigs that would have their PERV genes inactivated.
“This advance overcomes a major hurdle that has until now halted the progress of xenotransplantation research and development,” said Wyss Institute Founding Director Donald Ingber, M.D., Ph.D., who is also the Judah Folkman Professor of Vascular Biology at Harvard Medical School and Professor of Bioengineering at the Harvard John A. Paulson School of Engineering and Applied Sciences. “The real value and potential impact is in the number of lives that could be saved if we can one day use xenotransplants to close the huge gap between the number of available functional organs and the number of people who desperately need them.”
The remarkable and newly demonstrated capability for CRISPR to edit tens of repetitive genes such as PERVs will also unlock new ways for scientists to study and understand repetitive regions in the genome, which has been estimated to comprise more than two–thirds of our own human genome.
Contributors to the work also included: co–lead authors Marc Güell of the Wyss Institute and Harvard Medical School Department of Genetics, Dong Niu of HMS Dept. of Genetics and Zhejiang University’s College of Animal Sciences, and Haydy George of HMS Dept. of Genetics; and co–authors Emal Lesha, Dennis Grishin, Jürgen Poci, Ellen Shrock, and Rebeca Cortazio of HMS Dept. of Genetics, Weihong Xu of Massachusetts General Hospital Department of Surgery, and Robert Wilkinson and Jay Fishman of MGH’s Transplant Infection Disease & Compromised Host Program.
Novel Gut-on-a-Chip Nearly Indistinguishable from Human GI Tract
Fri, 10/09/2015 – 1:17pmby University of North Carolina Healthcare
A team of researchers from the University of North Carolina at Chapel Hill and NC State University has received a $5.3 million, five-year Transformative Research (R01) Award from the National Institutes of Health (NIH) to create fully functioning versions of the human gut that fit on a chip the size of a dime.
Such “organs-on-a-chip” have become vital for biomedical research, as researchers seek alternatives to animal models for drug discovery and testing. The new grant will fund a technology that represents a major step forward for the field, overcoming limitations that have mired other efforts.
The technology will use primary cells derived directly from human biopsies, which are known to provide more relevant results than the immortalized cell lines used in current approaches. In addition, the device will sculpt these cells into the sophisticated architecture of the gut, rather than the disorganized ball of cells that are created in other miniature organ systems.
This is a picture of a schematic of colonic epithelial tissue. Crypt units are pointed down, flat surface faces center of the gut tube. Stem cells are red, progenitor cells are pink, differentiated cells are grey, blue and green. Yellow cells are stem cell niche cells. Lumenal surface is above crypts. (Credit: Scott Magness, PhD, UNC School of Medicine)
“We are building a device that goes far beyond the organ-on-a-chip,” said Nancy L. Allbritton, MD, PhD, professor and chair of the UNC-NC State joint department of biomedical engineering and one of four principle investigators on the NIH grant. “We call it a ‘simulacrum,’ a term used in science fiction to describe a duplicate. The idea is to create something that is indistinguishable from your own gut.”
Allbritton is an expert at microfabrication and microengineering. Also on the team are intestinal stem cell expert Scott T. Magness, PhD, associate professor of medicine, biomedical engineering, and cell and molecular physiology in the UNC School of Medicine; microbiome expert Scott Bultman, PhD, associate professor of genetics in the UNC School of Medicine; and bioinformatics expert Shawn Gomez, associate professor of biomedical engineering at UNC-Chapel Hill and NC State.
The impetus for the “organ-on-chip” movement comes largely from the failings of the pharmaceutical industry. For just a single drug to go through the discovery, testing, and approval process can take as many as 15 years and as much as $5 billion dollars. Animal models are expensive to work with and often don’t respond to drugs and diseases the same way humans do. Human cells grown in flat sheets on Petri dishes are also a poor proxy. Three-dimensional “organoids” are an improvement, but these hollow balls are made of a mishmash of cells that doesn’t accurately mimic the structure and function of the real organ.
Basically, the human gut is a 30-foot long hollow tube made up of a continuous single-layer of specialized cells. Regenerative stem cells reside deep inside millions of small pits or “crypts” along the tube, and mature differentiated cells are linked to the pits and live further out toward the surface. The gut also contains trillions of microbes, which are estimated to outnumber human cells by ten to one. These diverse microbial communities — collectively known as the microbiota — process toxins and pharmaceuticals, stimulate immunity, and even release hormones to impact behavior.
These are fluorescent images of the side view of two synthetic crypts. Blue: nuclei of the cells. Red: proliferating stem cells in similar location to those in the human colon. (Credit: Scott Magness, PhD, UNC School of Medicine)
To create a dime-sized version of this complex microenvironment, the UNC-NC State team borrowed fabrication technologies from the electronics and microfluidics world. The device is composed of a polymer base containing an array of imprinted or shaped “hydrogels,” a mesh of molecules that can absorb water like a sponge. These hydrogels are specifically engineered to provide the structural support and biochemical cues for growing cells from the gut. Plugged into the device will be various kinds of plumbing that bring in chemicals, fluids, and gases to provide cues that tell the cells how and where to differentiate and grow. For example, the researchers will engineer a steep oxygen gradient into the device that will enable oxygen-loving human cells and anaerobic microbes to coexist in close proximity.
“The underlying concept — to simply grow a piece of human tissue in a dish — doesn’t seem that groundbreaking,” said Magness. “We have been doing that for a long time with cancer cells, but those efforts do not replicate human physiology. Using native stem cells from the small intestine or colon, we can now develop gut tissue layers in a dish that contains stem cells and all the differentiated cells of the gut. That is the thing stem cell biologists and engineers have been shooting for, to make real tissue behave properly in a dish to create better models for drug screening and cell-based therapies. With this work, we made a big leap toward that goal.”
Right now, the team has a working prototype that can physically and chemically guide mouse intestinal stem cells into the appropriate structure and function of the gut. For several years, Magness has been isolating and banking human stem cells from samples from patients undergoing routine colonoscopies at UNC Hospitals. As part of the grant, he will work with the rest of the team to apply these stem cells to the new device and create “simulacra” that are representative of each patient’s individual gut. The approach will enable researchers to explore in a personalized way how both the human and microbial cells of the gut behave during healthy and diseased states.
“Having a system like this will advance microbiota research tremendously,” said Bultman. “Right now microbiota studies involve taking samples, doing sequencing, and then compiling an inventory of all the microbes in the disease cases and healthy controls. These studies just draw associations, so it is difficult to glean cause and effect. This device will enable us to probe the microbiota, and gain a better understanding of whether changes in these microbial communities are the cause or the consequence of disease.”
A schematic view shows the optical waveguide intersecting a fluidic microchannel containing target particles. Targets are optically excited as they flow past well-defined excitation spots created by multi-mode interference; fluorescence is collected by the liquid-core waveguide channel and routed into solid-core waveguides (red). (Credit: Ozcelik et al., PNAS 2015)
New chip-based optical sensing technologies developed by researchers at UC Santa Cruz and Brigham Young University enable the rapid detection and identification of multiple biomarkers. In a paper published October 5 in Proceedings of the National Academy of Sciences, researchers describe a novel method to perform diagnostic assays for multiple strains of flu virus on a small, dedicated chip.
“A standard flu test checks for about ten different flu strains, so it’s important to have an assay that can look at ten to 15 things at once. We showed a completely new way to do that on an optofluidic chip,” said senior author Holger Schmidt, the Kapany Professor of Optoelectronics in the Baskin School of Engineering at UC Santa Cruz.
Over the past decade, Schmidt and his collaborators at BYU have developed chip-based technology to optically detect single molecules without the need for high-end laboratory equipment. Diagnostic instruments based on their optofluidic chips could provide a rapid, low-cost, and portable option for identifying specific disease-related molecules or virus particles.
In the new study, Schmidt demonstrated a novel application of a principle called wavelength division multiplexing, which is widely used in fiber-optic communications. By superimposing multiple wavelengths of light in an optical waveguide on a chip, he was able to create wavelength-dependent spot patterns in an intersecting fluidic channel. Virus particles labeled with fluorescent markers give distinctive signals as they pass through the fluidic channel depending on which wavelength of light the markers absorb.
“Each color of light produces a different spot pattern in the channel, so if the virus particle is labeled to respond to blue light, for example, it will light up nine times as it goes through the channel, if it’s labeled for red it lights up seven times, and so on,” Schmidt explained.
The researchers tested the device using three different influenza subtypes labeled with different fluorescent markers. Initially, each strain of the virus was labeled with a single dye color, and three wavelengths of light were used to detect them in a mixed sample. In a second test, one strain was labeled with a combination of the colors used to label the other two strains. Again, the detector could distinguish among the viruses based on the distinctive signals from each combination of markers. This combinatorial approach is important because it increases the number of different targets that can be detected with a given number of wavelengths of light.
For these tests, each viral subtype was separately labeled with fluorescent dye. For an actual diagnostic assay, fluorescently labeled antibodies could be used to selectively attach distinctive fluorescent markers to different strains of the flu virus.
While previous studies have shown the sensitivity of Schmidt’s optofluidic chips for detection of single molecules or particles, the demonstration of multiplexing adds another important feature for on-chip bioanalysis. Compact instruments based on the chip could provide a versatile tool for diagnostic assays targeting a variety of biological particles and molecular markers.
The optofluidic chip was fabricated by Schmidt’s collaborators at Brigham Young University led by Aaron Hawkins. The joint first authors of the PNAS paper are Damla Ozcelik and Joshua Parks, both graduate students in Schmidt’s lab at UC Santa Cruz. Other coauthors include Hong Cai and Joseph Parks at UC Santa Cruz and Thomas Wall and Matthew Stott at BYU.
In another recent paper, published September 25 in Nature Scientific Reports, Schmidt’s team reported the development of a hybrid device that integrates an optofluidic chip for virus detection with a microfluidic chip for sample preparation.
“These two papers represent important milestones for us. Our goal has always been to use this technology to analyze clinically relevant samples, and now we are doing it,” Schmidt said.
Boom in Gene-Editing Studies amid Ethics Debate over Its Use
Mon, 10/12/2015 – 1:54pmby Lauran Neergaard, AP Medical Writer
The hottest tool in biology has scientists using words like revolutionary as they describe the long-term potential: wiping out certain mosquitoes that carry malaria, treating genetic diseases like sickle cell, preventing babies from inheriting a life-threatening disorder.
It may sound like sci-fi, but research into genome editing is booming. So is a debate about its boundaries, what’s safe and what’s ethical to try in the quest to fight disease.
Does the promise warrant experimenting with human embryos? Researchers in China already have, and they’re poised to in Britain.
Should we change people’s genes in a way that passes traits to future generations? Beyond medicine, what about the environmental effects if, say, altered mosquitoes escape before we know how to use them?
“We need to try to get the balance right,” said Jennifer Doudna, a biochemist at the University of California, Berkeley. She helped develop new gene-editing technology and hears from desperate families, but urges caution in how it’s eventually used in people.
The U.S. National Academies of Science, Engineering and Medicine will bring international scientists, ethicists and regulators together in December to start determining that balance. The biggest debate is whether it ever will be appropriate to alter human heredity by editing an embryo’s genes.
“This isn’t a conversation on a cloud,” but something that families battling devastating rare diseases may want, Dr. George Daley of Boston Children’s Hospital told specialists meeting this week to plan the ethics summit. “There will be a drive to move this forward.”
Laboratories worldwide are embracing a technology to precisely edit genes inside living cells — turning them off or on, repairing or modifying them — like a biological version of cut-and-paste software. Researchers are building stronger immune cells, fighting muscular dystrophy in mice and growing human-like organs in pigs for possible transplant. Biotech companies have raised millions to develop therapies for sickle cell disease and other disorders.
The technique has a wonky name — CRISPR-Cas9 — and a humble beginning.
Doudna was studying how bacteria recognize and disable viral invaders, using a protein she calls “a genetic scalpel” to slice DNA. That system turned out to be programmable, she reported in 2012, letting scientists target virtually any gene in many species using a tailored CRISPR recipe.
There are older methods to edit genes, including one that led to an experimental treatment for the AIDS virus, but the CRISPR technique is faster and cheaper and allows altering of multiple genes simultaneously.
“It’s transforming almost every aspect of biology right now,” said National Institutes of Health genomics specialist Shawn Burgess.
In this photo provided by UC Berkeley Public Affairs, taken June 20, 2014 Jennifer Doudna, right, and her lab manager, Kai Hong, work in her laboratory in Berkeley, Calif. The hottest tool in biology has scientists using words like revolutionary as they describe the long-term potential: wiping out certain mosquitoes that carry malaria, treating genetic diseases like sickle-cell, preventing babies from inheriting a life-threatening disorder. “We need to try to get the balance right,” said Doudna. She helped develop new gene-editing technology and hears from desperate families, but urges caution in how it’s eventually used in people. (Cailey Cotner/UC Berkeley via AP)
CRISPR’s biggest use has nothing to do with human embryos. Scientists are engineering animals with human-like disorders more easily than ever before, to learn to fix genes gone awry and test potential drugs.
Engineering rodents to harbor autism-related genes once took a year. It takes weeks with CRISPR, said bioengineer Feng Zhang of the Broad Institute at MIT and Harvard, who also helped develop and patented the CRISPR technique. (Doudna’s university is challenging the patent.)
A peek inside an NIH lab shows how it works. Researchers inject a CRISPR-guided molecule into microscopic mouse embryos, to cause a gene mutation that a doctor suspects of causing a patient’s mysterious disorder. The embryos will be implanted into female mice that wake up from the procedure in warm blankets to a treat of fresh oranges. How the resulting mouse babies fare will help determine the gene defect’s role.
Experts predict the first attempt to treat people will be for blood-related diseases such as sickle cell, caused by a single gene defect that’s easy to reach. The idea is to use CRISPR in a way similar to a bone marrow transplant, but to correct someone’s own blood-producing cells rather than implanting donated ones.
“It’s like a race. Will the research provide a cure while we’re still alive?” asked Robert Rosen of Chicago, who has one of a group of rare bone marrow abnormalities that can lead to leukemia or other life-threatening conditions. He co-founded the MPN Research Foundation, which has begun funding some CRISPR-related studies.
So why the controversy? CRISPR made headlines last spring when Chinese scientists reported the first-known attempt to edit human embryos, working with unusable fertility clinic leftovers. They aimed to correct a deadly disease-causing gene but it worked in only a few embryos and others developed unintended mutations, raising fears of fixing one disease only to cause another.
If ever deemed safe enough to try in pregnancy, that type of gene change could be passed on to later generations. Then there are questions about designer babies, altered for other reasons than preventing disease.
In the U.S., the NIH has said it won’t fund such research in human embryos.
In Britain, regulators are considering researchers’ request to gene-edit human embryos — in lab dishes only — for a very different reason, to study early development.
Medicine aside, another issue is environmental: altering insects or plants in a way that ensures they pass genetic changes through wild populations as they reproduce. These engineered “gene drives” are in very early stage research, too, but one day might be used to eliminate invasive plants, make it harder for mosquitoes to carry malaria or even spread a defect that gradually kills off the main malaria-carrying species, said Kevin Esvelt of Harvard’s Wyss Institute for Biologically Inspired Engineering.
No one knows how that might also affect habitats, Esvelt said. His team is calling for the public to weigh in and for scientists to take special precautions. For example, Esvelt said colleagues are researching a tropical mosquito species unlikely to survive cold Boston even if one escaped locked labs.
“There is no societal precedent whatsoever for a widely accessible and inexpensive technology capable of altering the shared environment,” Esvelt told a recent National Academy of Sciences hearing.
Researchers Use ‘Avatar’ Experiments to Get Leg Up On Locomotion
Mon, 10/12/2015 – 5:09pmby North Carolina State University
North Carolina State University scientists take a giant leap closer to understanding locomotion from the leg up
Simple mechanical descriptions of the way people and animals walk, run, jump and hop liken whole leg behavior to a spring or pogo stick.
But until now, no one has mapped the body’s complex physiology – which in locomotion includes multiple leg muscle-tendons crossing the hip, knee and ankle joints, the weight of a body, and control signals from the brain – with the rather simple physics of spring-like limb behavior.
Using an “Avatar”-like bio-robotic motor system that integrates a real muscle and tendon along with a computer controlled nerve stimulator acting as the avatar’s spinal cord, North Carolina State University researchers have taken a giant leap closer to understanding locomotion from the leg up. The findings could help create robotic devices that begin to merge human and machine in order to assist human locomotion.
Despite the complicated physiology involved, NC State biomedical engineer Greg Sawicki and Temple University post-doctoral researcher Ben Robertson show that if you know the mass, the stiffness and the leverage of the ankle’s primary muscle-tendon unit, you can predict neural control strategies that will result in spring-like behavior.
“We tried to build locomotion from the bottom up by starting with a single muscle-tendon unit, the basic power source for locomotion in all things that move,” said Greg Sawicki, associate professor in the NC State and UNC-Chapel Hill Joint Department of Biomedical Engineering and co-author of a paper published in Proceedings of the National Academy of Sciences that describes the work. “We connected that muscle-tendon unit to a motor inside a custom robotic interface designed to simulate what the muscle-tendon unit ‘feels’ inside the leg, and then electrically stimulated the muscle to get contractions going on the benchtop.”
The researchers showed that resonance tuning is a likely mechanism behind springy leg behavior during locomotion. That is, the electrical system – in this case the body’s nervous system – drives the mechanical system – the leg’s muscle-tendon unit – at a frequency which provides maximum ‘bang for the buck’ in terms of efficient power output.
Sawicki likened resonance tuning to interacting with a slinky toy. “When you get it oscillating well, you hardly have to move your hand – it’s the timing of the interaction forces that matters.
“In locomotion, resonance comes from tuning the interaction between the nervous system and the leg so they work together,” Sawicki said. “It turns out that if I know the mass, leverage and stiffness of a muscle-tendon unit, I can tell you exactly how often I should stimulate it to get resonance in the form of spring-like, elastic behavior.”
The findings have design implications relevant to designing exoskeletons for able-bodied individuals, as well as exoskeleton or prosthetic systems for people with mobility impairments.
“In the end, we found that the same simple underlying principles that govern resonance in simple mechanical systems also apply to these extraordinarily complicated physiological systems,” said Robertson, the corresponding author of the paper.


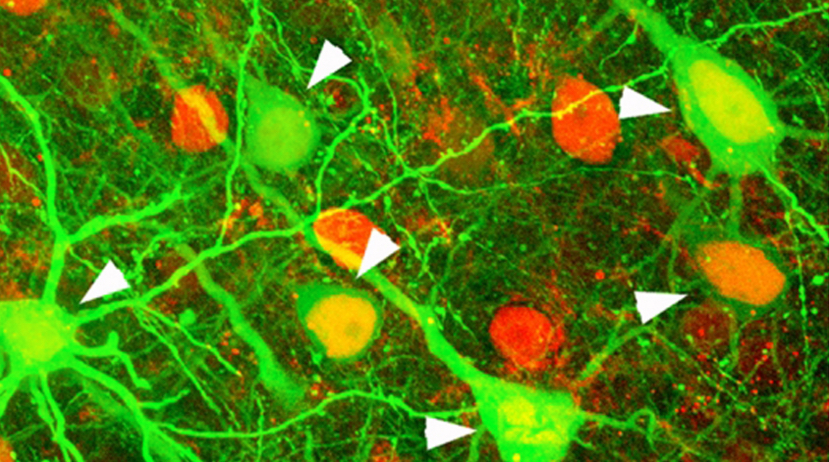
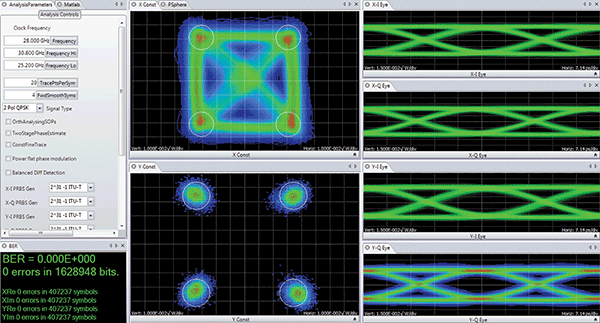
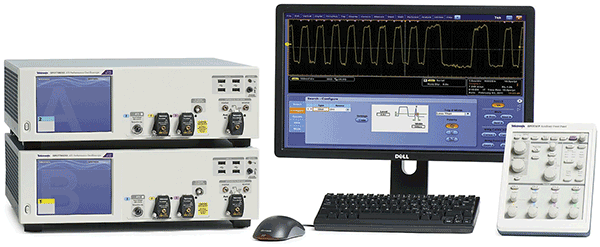
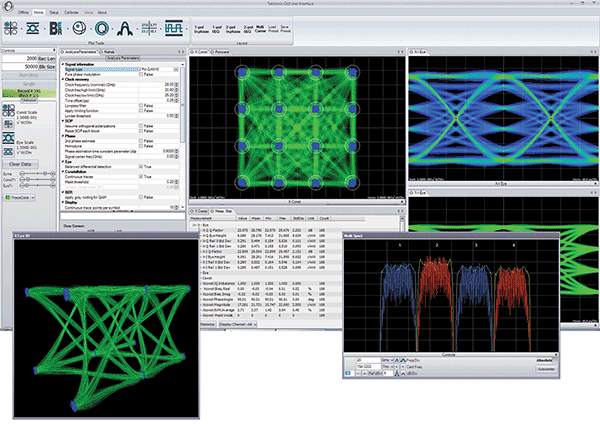