Feeds:
Posts
Comments

Posts Tagged ‘dual polarization coherent optical acquisition system’

High resolution 3-D optics

Curator: Larry H. Bernstein, MD, FCAP


MIT invention could boost resolution of 3-D depth cameras 1,000-fold

Imagine 3-D depth cameras built into cellphones, 3-D printing replicas, and driverless cars with clear vision in rain, snow, or fog
By combining the information from the Kinect depth frame in (a) with polarized photographs, MIT researchers reconstructed the 3-D surface shown in (c). Polarization cues can allow coarse depth sensors like Kinect to achieve laser scan quality (b). (credit: courtesy of the researchers)

MIT researchers have shown that by exploiting light polarization (as in polarized sunglasses) they can increase the resolution of conventional 3-D imaging devices such as the Microsoft Kinect as much as 1,000 times.

The technique could lead to high-quality 3-D cameras built into cellphones, and perhaps the ability to snap a photo of an object and then use a 3-D printer to produce a replica. Further out, the work could also help the development of driverless cars.

Headed Ramesh Raskar, associate professor of media arts and sciences in the MIT Media Lab, the researchers describe the new system, which they call Polarized 3D, in a paper they’re presenting at the International Conference on Computer Vision in December.

How polarized light works

If an electromagnetic wave can be thought of as an undulating squiggle, polarization refers to the squiggle’s orientation. It could be undulating up and down, or side to side, or somewhere in-between.

Polarization also affects the way in which light bounces off of physical objects. If light strikes an object squarely, much of it will be absorbed, but whatever reflects back will have the same mix of polarizations (horizontal and vertical) that the incoming light did. At wider angles of reflection, however, light within a certain range of polarizations is more likely to be reflected.

This is why polarized sunglasses are good at cutting out glare: Light from the sun bouncing off asphalt or water at a low angle features an unusually heavy concentration of light with a particular polarization. So the polarization of reflected light carries information about the geometry of the objects it has struck.

This relationship has been known for centuries, but it’s been hard to do anything with it, because of a fundamental ambiguity about polarized light. Light with a particular polarization, reflecting off of a surface with a particular orientation and passing through a polarizing lens is indistinguishable from light with the opposite polarization, reflecting off of a surface with the opposite orientation.

This means that for any surface in a visual scene, measurements based on polarized light offer two equally plausible hypotheses about its orientation. Canvassing all the possible combinations of either of the two orientations of every surface, in order to identify the one that makes the most sense geometrically, is a prohibitively time-consuming computation.

Polarization plus depth sensing

To resolve this ambiguity, the Media Lab researchers use coarse depth estimates provided by some other method, such as the time a light signal takes to reflect off of an object and return to its source. Even with this added information, calculating surface orientation from measurements of polarized light is complicated, but it can be done in real-time by a graphics processing unit, the type of special-purpose graphics chip found in most video game consoles.

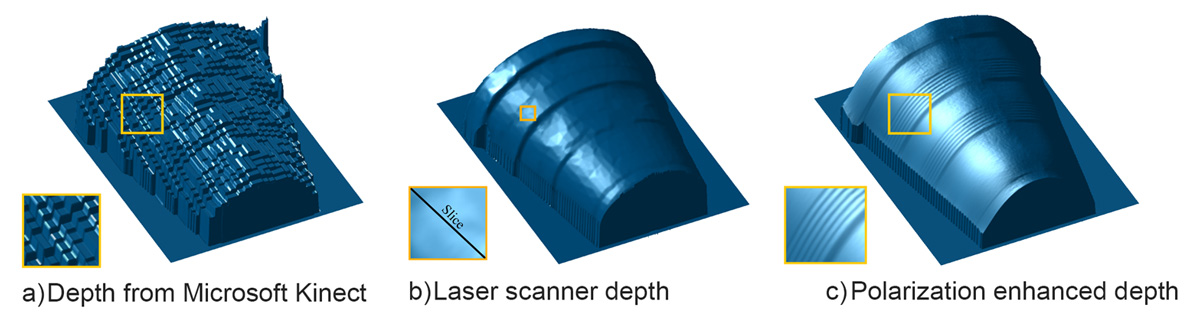
The researchers’ experimental setup consisted of a Microsoft Kinect — which gauges depth using reflection time — with an ordinary polarizing photographic lens placed in front of its camera. In each experiment, the researchers took three photos of an object, rotating the polarizing filter each time, and their algorithms compared the light intensities of the resulting images.

On its own, at a distance of several meters, the Kinect can resolve physical features as small as a centimeter or so across. But with the addition of the polarization information, the researchers’ system could resolve features in the range of hundreds of micrometers, or one-thousandth the size.

For comparison, the researchers also imaged several of their test objects with a high-precision laser scanner, which requires that the object be inserted into the scanner bed. Polarized 3D still offered the higher resolution.

Uses in cameras and self-driving cars

A mechanically rotated polarization filter would probably be impractical in a cellphone camera, but grids of tiny polarization filters that can overlay individual pixels in a light sensor are commercially available. Capturing three pixels’ worth of light for each image pixel would reduce a cellphone camera’s resolution, but no more than the color filters that existing cameras already use.

The new paper also offers the tantalizing prospect that polarization systems could aid the development of self-driving cars. Today’s experimental self-driving cars are, in fact, highly reliable under normal illumination conditions, but their vision algorithms go haywire in rain, snow, or fog.

That’s because water particles in the air scatter light in unpredictable ways, making it much harder to interpret. The MIT researchers show that in some very simple test cases their system can exploit information contained in interfering waves of light to handle scattering.


Abstract of Polarized 3D: High-Quality Depth Sensing with Polarization Cues

Coarse depth maps can be enhanced by using the shape information from polarization cues. We propose a framework to combine surface normals from polarization (hereafter polarization normals) with an aligned depth map. Polarization normals have not been used for depth enhancement before. This is because polarization normals suffer from physics-based artifacts, such as azimuthal ambiguity, refractive distortion and fronto-parallel signal degradation. We propose a framework to overcome these key challenges, allowing the benefits of polarization to be used to enhance depth maps. Our results demonstrate improvement with respect to state-of-the-art 3D reconstruction techniques

Read Full Post »

stand-alone software systems

Larry H. Bernstein, MD, FCAP, Curator

LPBI


Optimization of a Coherent OMA Acquisition System

Sophisticated testing instruments, as well as integrated calibration and error correction software (or stand-alone software systems), can evaluate today’s complex designs. Such tools position designers to successfully tackle challenges in the even faster data environment of the future.

CHRIS LOBERG, TEKTRONIX INC.             http://www.photonics.com/Article.aspx?AID=57878

The demand for optical network data has soared, with rates of 100 Gb/s evolving into 400 Gb/s, 1 Tb/s and beyond, pushing designers to explore inventive and even unconventional modulation schemes in order to encode data more efficiently for faster throughput. In this context, it can pay off for designers to think about how to optimize their testing environment to quickly and accurately evaluate design progress.

When considering a coherent optical modulation analysis system, it’s important to consider the signal fidelity of its acquisition system. This typically includes an optical modulation analyzer (OMA) or coherent receiver, as well as a digitizer (usually an oscilloscope), and some form of algorithmic processing.

When purchasing a coherent optical acquisition system, users must look beyond obvious performance parameters, such as coherent receiver bandwidth and oscilloscope sample rate. Consider also these vital questions:

• Does this OMA achieve the lowest possible error vector magnitude (EVM) value for the acquisition system? And is this oscilloscope the most effective digitizer available? These two considerations have an obvious impact on measured signal quality.

• Is the analysis software that comes with the OMA adequate for testing the complexities of the design or research?

• Do these instruments meet not only present acquisition needs, but also anticipated needs in one year, two years or even longer?


Achieving low EVM and high ENOB

Signal quality is obviously critical to testing success. EVM is often seen as a representation of the overall signal quality — the lower the better. An EVM is simply the vector that points from the actual measured symbol to where that symbol was intended in the signal constellation diagram.

The manufacturing process can introduce a wide range of system impairment and configuration issues into the OMA, which can adversely impact the receiver EVM. These include IQ (in-phase and quadrature) phase angle errors, IQ gain imbalance, IQ skew errors, and XY polarization skew errors. The good news is that some OMAs are able to precisely measure these manufacturing errors and calibrate their impacts in the algorithmic processing that typically follows coherent detection.

With these OMAs, each receiver is tested at the time of manufacture, and a unique calibration file is created. It is later automatically used by the optical modulation analyzer software that comes with the receiver to remove the impacts discussed above during acquisition.

Figure 1 offers an example of the software that accompanies a Tektronix OM4245 45-GHz OMA. Unique calibration files are created for all Tektronix OMAs at the time of manufacture, so that the software can remove any impacts. Once the signal is received by the OMA, the next step is to digitize it on the electrical signal paths using a multichannel oscilloscope. This can introduce a number of factors that can affect the EVM, the most fundamental being the oscilloscope’s bandwidth and sample rate.


An example of the software that accompanies optical modulation analyzer (OMA) systems; here, a Tektronix OM4245 45-GHz OMA

http://www.photonics.com/images/Web/Articles/2015/10/28/OMA_Software.png

Figure 1. An example of the software that accompanies optical modulation analyzer (OMA) systems; here, a Tektronix OM4245 45-GHz OMA is shown.


Assuming an oscilloscope with the appropriate bandwidth and sample rate is utilized, and that all OMA impairments are being corrected algorithmically as described above, achieving the lowest measurable EVM comes down to a function of the effective number of bits (ENOB) of the oscilloscope. The ENOB is measurably impacted by the way the oscilloscope handles interleaved sampling. Some real-time oscilloscopes use frequency interleaving techniques in order to extend bandwidth, but they do so at the cost of increasing the noise in the measurement channel.

The limitation of the frequency interleaving approach lies in how the various frequency ranges are added together to reconstruct the final waveform, a step that compromises noise performance. In traditional frequency interleaving, each analog-to-digital converter (ADC) in the signal acquisition system only “sees” part of the input spectrum. But other oscilloscopes, such as the one shown in Figure 2, use a time-based interleaving approach, where all the ADCs see the full spectrum with full signal path symmetry. This approach preserves signal fidelity and ensures the highest possible ENOB.


Some oscilloscopes, such as this one, provide signal acquisition up to 70-GHz bandwidth.

http://www.photonics.com/images/Web/Articles/2015/10/28/OMA_Oscilloscopes.png

Figure 2. Some oscilloscopes, such as this one, provide signal acquisition up to 70-GHz bandwidth. Its asynchronous time interleaving (ATI) architecture provides a low-noise, real-time signal acquisition and high effective number of bits (ENOB).


Analysis for conclusive evaluation

Any test and measurement coherent receiver comes with some sort of analysis and visualization software package. But will that software have the particular types of measurement and visualization tools needed for evaluating specific designs or research?

For example, when evaluating the quality of a new phase recovery algorithm, OMA software may be needed. This type of software can provide not only the basic building blocks for measurements but also allows the complete customization of the signal processing. Stand-alone optical analysis software packages of high quality are on the market. Some include features such as a library of analysis algorithms designed specifically for coherent optical analysis and executed in a customer-supplied MATLAB installation, with an applications programmatic interface (API) to these algorithms. Some provide a graphical user interface with optical tools that analyze complex modulated optical signals without needing to know any MATLAB, analysis algorithms or software programming, as shown in Figure 3.


The user interface of software like this, Tektronix’s OM1106 Coherent Optical Analysis system, allows the user to conduct a detailed analysis of complex modulated optical signals without requiring knowledge of MATLAB, analysis algorithms or software programming.

http://www.photonics.com/images/Web/Articles/2015/10/28/OMA_Interface.png

Figure 3. The user interface of software like this, Tektronix’s OM1106 Coherent Optical Analysis system, allows the user to conduct a detailed analysis of complex modulated optical signals without requiring knowledge of MATLAB, analysis algorithms or software programming.


Flexible measurement-taking software also is available. For instance, measurements can be made solely through the user interface, or via the programmatic interface to and from MATLAB for customized processing. Using both methods together is also an option, made possible by employing the user interface as a visualization and measurement framework, around which custom processing can be built.
Most software includes sophisticated core processing algorithms for analyzing coherent signals — estimating the signal phase, determining the signal clock frequency, performing ambiguity resolution, estimating the power spectral density, etc. — but some packages can customize the core processing algorithms. This provides an excellent method for conducting signal processing research. For instance, in order to speed up the development of signal processing routines, one user interface provides a dynamic MATLAB integration window (Figure 4).


A dynamic MATLAB integration window helps speed up the development of signal processing routines.

http://www.photonics.com/images/Web/Articles/2015/10/28/OMA_MATLAB.png

Figure 4. A dynamic MATLAB integration window helps speed up the development of signal processing routines.


Any MATLAB code typed in this window is executed on every pass through the signal processing loop. This allows the “comment out” function calls, writing of specific values into data structures, or modification of signal processing parameters on the fly without having to stop the processing loop or modify the MATLAB source code.

Future-proofing an acquisition system

While the bulk of today’s coherent optical R&D activity is focused on 100-G signals, R&D with 400-G signals is already underway at many sites. Testing at 400 G may well be needed within the lifetime of many 100-G test instruments. Therefore, it makes sense to buy equipment at the right performance and price for 100 G now, but also to ensure that future expansion into 400 G is possible.

But how? Typically, four channels of 33-GHz real-time oscilloscope acquisition are used to test 100-G signals. In order to test 400-G signals in the future, bandwidths greater than 65 GHz will be needed, especially for a full dual-polarization system. But if testing at 100 G is all that’s needed now, it could be hard to justify the additional expense. One way around this problem is to purchase a system with a flexible, modular design, and one that uses distributed processing to allow for additional capacity for the system as needed.

For example, Figure 5 shows a system with four channels of 33-GHz acquisition that are distributed across two stand-alone oscilloscopes (left). The instruments are connected by a high speed bus, which not only provides a common external trigger between the two but also includes a common 12.5-GHz sample clock. The result is that the two oscilloscopes are combined to form, in effect, a single instrument whose acquisition-to-acquisition jitter across all channels delivers the same level of measurement precision as a stand-alone, monolithic oscilloscope.


Shown here is a modular way to build coherent optical testing systems from 100 to 400 G using an oscilloscope connected by cables.

Figure 5. Shown here is a modular way to build coherent optical testing systems from 100 to 400 G using an oscilloscope connected by cables. The processing is distributed and provides a common trigger without acquisition-to-acquisition jitter.


The system shown in Figure 5 also has two 70-GHz channels (one in each unit). Therefore, by simply switching from the 33-GHz channels to the 70-GHz channels, the oscilloscope bandwidth and sample rate can both be doubled. This permits a “peek” at single-polarization 400-G signals using the 100-G test system, as shown in the middle of the illustration. When the time comes to perform full 400-G testing, a second system can be added to the first with another high speed bus, providing two more channels of 70-GHz acquisition. This creates a system that is capable of full dual-polarization coherent optical acquisition (as demonstrated on the right). As the base units are stand-alone oscilloscopes, the systems can also be scaled down and redeployed to other projects as needed when a project comes to an end.

Meet the author

Chris Loberg is a senior technical marketing manager at Tektronix Inc., responsible for oscilloscopes in the Americas region; email: christopher.j.loberg@tektronix.com.

Read Full Post »

%d bloggers like this: