Feeds:
Posts
Comments

Archive for the ‘Enzyme Induction’ Category

Carbohydrate Metabolism

Author and Curator: Larry H. Bernstein, MD, FCAP

This is the portion of the discussion in a series of articles that began with signaling and signaling pathways. There are features on the functioning of enzymes and proteins, on sequential changes in a chain reaction, and on conformational changes that we shall return to.  These are critical to developing a more complete understanding of life processes.  I have indicated that many of the protein-protein interactions or protein-membrane interactions and associated regulatory features have been referred to previously, but the focus of the discussion or points made were different.  Even though I considered placing this after the discussion of proteins and how they play out their essential role, I needed to lay out the scope of metabolic reactions and pathways, and their complementary changes. These may not appear to be adaptive, if the circumstances and the duration is not clear. The metabolic pathways map in total is in interaction with environmental conditions – light, heat, external nutrients and minerals, and toxins – all of which give direction and strength to these reactions. I shall again take from Wikipedia, as needed, and also follow mechanisms and examples from the literature, which give insight into the developments in cell metabolism. A developing goal is to discover how views introduced by molecular biology and genomics don’t clarify functional cellular dynamics that are not related to the classical view.  The work is vast.

  1. Signaling and signaling pathways
  2. Signaling transduction tutorial.
  3. Carbohydrate metabolism
  4. Lipid metabolism
  5. Protein synthesis and degradation
  6. Subcellular structure
  7. Impairments in pathological states: endocrine disorders; stress hypermetabolism; cancer.

Carbohydrate metabolism

Carbohydrate metabolism denotes the various biochemical processes responsible for the formation, breakdown and interconversion of carbohydrates in living organisms.

The most important carbohydrate is glucose, a simple sugar (monosaccharide) that is metabolized by nearly all known organisms. Glucose and other carbohydrates are part of a wide variety of metabolic pathways across species: plants synthesize carbohydrates from carbon dioxide and water by photosynthesis storing the absorbed energy internally, often in the form of starch or lipids. Plant components are consumed by animals and fungi, and used as fuel for cellular respiration. Oxidation of one gram of carbohydrate yields approximately 4 kcal of energy and from lipids about 9 kcal. Energy obtained from metabolism (e.g. oxidation of glucose) is usually stored temporarily within cells in the form of ATP.[1] Organisms capable of aerobic respiration metabolize glucose and oxygen to release energy with carbon dioxide and water as byproducts.

Complex carbohydrates contain three or more sugar units linked in a chain, with most containing hundreds to thousands of sugar units. They are digested by enzymes to release the simple sugars.
I shall not go into the digestion, breakdown and absorption of these sugar molecules. Carbohydrates are used for short-term fuel, and the most important is glucose.  Even though they are simpler to metabolize than fats or those amino acids (components of proteins) that can be used for fuel, they do not produce as effect an energy yield measured by ATP.  In animals, The concentration of glucose in the blood is linked to the pancreatic endocrine hormone, insulin.

Carbohydrates are typically stored as long polymers of glucose molecules with glycosidic bonds for structural support (e.g. chitin, cellulose) or for energy storage (e.g. glycogen, starch). However, the strong affinity of most carbohydrates for water makes storage of large quantities of carbohydrates inefficient due to the large molecular weight of the solvated water-carbohydrate complex. In most organisms, excess carbohydrates are regularly catabolised to form acetyl-CoA, which is a feed stock for the fatty acid synthesis pathway; fatty acids, triglycerides, and other lipids are commonly used for long-term energy storage. The hydrophobic character of lipids makes them a much more compact form of energy storage than hydrophilic carbohydrates. However, animals, including humans, lack the necessary enzymatic machinery and so do not synthesize glucose from lipids, though glycerol can be converted to glucose.[6]

Metabolic pathways in eukaryotes

  • Carbon fixation, or photosynthesis, in which CO2 is reduced to carbohydrate.  [omitted]
  • Glycolysis – the metabolism of glucose molecules to obtain ATP and pyruvate[7] by way of first splitting a six-carbon into two three csrbon chains, which are converted to lactic acid from pyruvate in the lactic dehydrogenase reaction. The reverse conversion is by a separate unidirectional reaction back to pyruvate after moving through pyruvate dehydrogenase complex.[8]
  • Krebs, tricarboxylic acic, or citric acid cycle
    • Typically, a breakdown of one molecule of glucose by aerobic respiration (i.e. involving both glycolysis and Kreb’s cycle) is about 33-35 ATP.[1] This is categorized as:
  • Glycogenolysis – the breakdown of glycogen into glucose, which provides a glucose supply for glucose-dependent tissues.
    • Glycogenolysis in liver provides circulating glucose short term.
    • Glycogenolysis in muscle is obligatory for muscle contraction.
    •     Anaerobic breakdown by glycolysis – yielding 8-10 ATP
    •     Aerobic respiration by kreb’s cycle – yielding 25 ATP
  • The pentose phosphate pathway (shunt) converts hexoses into pentoses and regenerates NADPH.[9] NADPH is an essential antioxidant in cells which prevents oxidative damage and acts as precursor for production of many biomolecules.
  • Glycogenesis – the conversion of excess glucose into glycogen as a cellular storage mechanism; achieving low osmotic pressure.
  • Gluconeogenesis – de novo synthesis of glucose molecules from simple organic compounds. An example in humans is the conversion of a few amino acids in cellular protein to glucose.
    Metabolic use of glucose is highly important as an energy source for muscle cells and in the brain, and red blood cells.

Glucoregulation

The hormone insulin is the primary glucose regulatory signal in animals. It mainly promotes glucose uptake by the cells,  and causes liver to store excess glucose as glycogen. Its absence turns off glucose uptake, reverses electrolyte adjustments, begins glycogen breakdown and glucose release into the circulation by some cells, begins lipid release from lipid storage cells, etc. The level of circulatory glucose (known informally as “blood sugar”) is the most important signal to the insulin-producing cells. Because the level of circulatory glucose is largely determined by the intake of dietary carbohydrates, diet controls major aspects of metabolism via insulin. In humans, insulin is made by beta cells in the pancreas, fat is stored in adipose tissue cells, and glycogen is both stored and released as needed by liver cells. Regardless of insulin levels, no glucose is released to the blood from internal glycogen stores from muscle cells.

The hormone glucagon, on the other hand, opposes that of insulin, forcing the conversion of glycogen in liver cells to glucose, and then release into the blood. Muscle cells, however, lack the ability to export glucose into the blood. The release of glucagon is precipitated by low levels of blood glucose. Other hormones, notably growth hormone, cortisol, and certain catecholamines (such as epinepherine) have glucoregulatory actions similar to glucagon.  These hormones are referred to as stress hormones because they are released under the influence of catabolic proinflammatory (stress) cytokines – interleukin-1 (IL1) and tumor necrosis factor α (TNFα).

metabolic pathways

metabolic pathways

Glycemic control in DM

Glycemic control in DM

  1. Catabolic proinflammatory cytokines. Argilés JM1, López-Soriano FJ. Curr Opin Clin Nutr Metab Care.1998 May;1(3):245-51.
  2. Tumor necrosis factor as a mediator of shock, cachexia and inflammation. Cerami A. Blood Purif. 1993; 11(2):108-17.
  3. Mediators of cytokine-induced insulin resistance in obesity and other inflammatory settings. Marette A. Curr Opin Clin Nutr Metab Care. 2002 Jul; 5(4):377-83.
  4. Inflammation: the link between insulin resistance, obesity and diabetes. Dandona P, Aljada A, Bandyopadhyay A. Trends Immunol. 2004 Jan; 25(1):4-7
  5. Proinflammatory cytokines and skeletal muscle. Späte U1, Schulze PC. Curr Opin Clin Nutr Metab Care. 2004 May;7(3):265-9.
  6. Insulin-like growth factor-1 and muscle wasting in chronic heart failure. Schulze PC, Späte U. Int J Biochem Cell Biol. 2005 Oct; 37(10):2023-35.
  7. IGF-I stimulates muscle growth by suppressing protein breakdown and expression of atrophy-related ubiquitin ligases, atrogin-1 and MuRF1. Sacheck JM, Ohtsuka A, McLary SC, Goldberg AL. Am J Physiol Endocrinol Metab. 2004 Oct; 287(4):E591-601. Epub 2004 Apr 20.

Glycolysis – Animation and Notes

By Sweety Mehta – Sept 20, 2011  in: Animations, Biochemistry Animations, Biochemistry Notes

http://pharmaxchange.info/press/2011/09/glycolysis-animation-and-notes/

Cellular respiration involves breaking the bonds of glucose to produce energy in the form of ATP (adenosine triphosphate). The total energy produced during glucose metabolism is described at Energetics of Cellular Respiration. Glycolysis is the most critical phase in glucose metabolism during cellular respiration. The term “glycolysis” literally means breakdown of glucose and sugars. Biochemically, it involves the breakdown of glucose to pyruvate (or pyruvic acid) via a series of enzymes. Glycolysis does not require molecular oxygen and is hence considered anaerobic. Therefore, it is a common pathway for all living organisms.

Glycolysis is followed by

Kreb’s cycle in the stages of cellular respiration.

Glycolysis is said to occur in two phases:

  1. The Preparatory Phase: From glucose till formation of Glyceraldehyde 3-Phosphate (GADP)
  2. The Pay-off Phase: From Glyceraldehyde-3-Phosphate (GADP) to the final product pyruvate

.

.

glycolysis

The animation below gives an outline of the entire pathway of glucose metabolism by glycolysis

Note – The animation is best played in full screen. To go forward in the animation, press the Play button. To skip the whole section press the forward button. To go back press the rewind button.

The Preparatory Phase

In this stage of the cycle, ATP or energy is actually consumed and is hence also known as the investment phase of glycolysis.

Step 1, involves the conversion of glucose to glucose-6-phosphate (G6P) with the help of the enzyme hexokinase and the consumption of 1 molecule of ATP. This reaction helps keep the concentration of glucose low in the cell, allowing for more absorption of glucose into it. Additionally, G6P is not transported out of the cell as there are no G6P transporters on the cell.

Step 2 involves the rearrangement of glucose-6-phosphate to fructose-6-phosphate (F6P) with the help of the enzyme phosphohexose isomerase in a reversible manner. Fructose can directly enter the glycolysis pathway at this point. This isomerization to a keto-sugar such as fructose is essential for carbanion stabilization required for the next step.

Step 3 involves the phosphorylation of fructose-6-phosphate to fructose-1,6-biphosphate (F1,6BP) by the use of 1 molecule of ATP and the enzyme phosphofructokinase-1 (PPK1). This phosphorylation step destabilizes the molecule and helps drive the next reaction which ensures breakdown of the molecule to a 3-carbon unit.

Step 4 involves the breakdown of fructose-1,6-biphosphate (6 carbons) to two molecules of 3-carbon units i.e. glyceralde 3-phosphate (GADP) and Dihydroxyacetone phosphate (DHAP). The GADP can be interconverted to DHAP by enzyme triose phosphate isomerase.

The Pay-Off Phase

In this stage of the cycle, ATP or energy is produced either in the form of ATP alone or in the form of NADH + H+ which can be later converted to ATP via the electron transport chain (ETS). In this since energy is restored it is known as the pay-off phase of glycolysis. All steps in this phase occur with 2 molecules of the substrates each as indicated in the brackets by the name of the molecules.

Step 1, involves the dehydrogenation of glyceraldehyde-3-phosphate (GADP) to 1,3-biphophoglycerate (1,3BPG) by the use of 2 molecules of inorganic phosphate (Pi) with the production of 2 molecules of NADH + H+ in the presence of the enzyme glyceraldehyde 3-phosphate dehydrogenase.

Step 2, in this step dephosphorylation of 1,3-biphosphoglycerate (1,3BPG) to 3-phospoglycerate (3PG) produces 2 molecules of ATP by the enzyme phosphoglycerate kinase.

Step 3, involves the isomerisation of 3-phosphoglycerate (3PG) to 2-phosphoglycerate (2PG) by the enzyme phosphoglycerate mutase in a reversible manner.

Step 4 involves the enolization of 2-phosphoglycerate (2PG) to phosphoenolpyruvate (PEP) with the loss of one molecule of water in the presence of enzyme enolase.

Step 5 is the final step of the glycolysis pathway and it involves the dephosphorylation of the phosphoenolpyruvate (PEP) to pyruvate by enzyme pyruvate kinase to produce 2 more molecules of ATP.

Net Yield of Glycolysis

  1. The preparatory phase consumes 2 ATP
  2. The pay-off phase produces 4 ATP.
  3. The gross yield of glycolysis is therefore
    4 ATP – 2 ATP = 2 ATP
  4. The pay-off phase also produces 2 molecules of NADH + H+ which can be further converted to a total of 5 molecules of ATP* by the electron transport chain (ETC) during oxidative phosphorylation.
  5. Thus the net yield during glycolysis is 7 molecules of ATP.

* This is calculated assuming one NADH molecule gives 2.5 molecules of ATP during oxidative phosphorylation.

References

  1. David L. Nelson and Michael M. Cox, Lehninger Principles of Biochemistry, 4th Ed.
  2. Jeremy M. Berg, John L. Tymockzo and Luber Stryer, Biochemistry, 7th Ed.

Tags: cellular respiration, electron transport chain, etc, glucose, glycolysis, metabolism, pay-off phase

Kreb’s Cycle or Citric Acid Cycle or Tricarboxylic Acid Cycle (with Animation)

By Sweety Mehta  – Sept 21, 2013  in: Animations, Biochemistry Animations, Biochemistry Notes
http://pharmaxchange.info/press/2013/09/krebs-cycle-citric-acid-cycle-tricarboxylic-acid-cycle-animation/

Introduction

Cellular respiration involves 3 stages for the breakdown of glucose – glycolysis, Kreb’s cycle and the electron transport system. The total energy produced during glucose metabolism is described at Energetics of Cellular Respiration. We have seen the glycolysis pathway with animation previously. The Kreb’s cycle is named after Adolf Krebs who studied the utilization of oxygen in a pigeon. It is also commonly known as the citric acid cycle or the tricarboxylic acid cycle. Kreb’s cycle is a very important step in the metabolic pathway as it produces about 60-70% of ATP for release of energy in the body. It directly or indirectly connects with all the other individual pathways in the body too. It takes place in the mitochondria as all the enzymes and co-enzymes required are present there.

The Kreb’s Cycle occurs in two stages:

1. Conversion of Pyruvate to Acetyl CoA

Glycolysis of 1 molecule of glucose produces 2 molecules of pyruvate. Each pyruvate in the presence of pyruvate dehydrogenase (PDH) complex in the mitochondria gets converted to acetyl CoA which in turn enters the Kreb’s cycle. This reaction is called as oxidative  decarboxylation as the carboxyl group is removed from the pyruvate molecule in the form of CO2 thus yielding 2-carbon acetyl group which along with the coenzyme A forms acetyl CoA.

The pyruvate dehydrogenase complex (PDH) comprises of three enzymes – pyruvate dehydrogenase, dihydrolipoyl transacetylase and dihydrolipoyl dehydrogenase each one playing an important role in the reaction as shown below. The PDH requires the sequential action of five co-factors or co-enzymes for the combined action of dehydrogenation and decarboxylation to take place. These five are TPP (thiamine phosphate), FAD (flavin adenine dinucleotide), NAD (nicotinamide adenine dinucleotide), coenzyme A (denoted as CoA-SH at times to depict role of -SH group) and lipoamide.

Conversion of pyruvate to acetyl CoA by the pyruvate dehydrogenase complex

pyruvate_dehydrogenase_complex_new2

Conversion of pyruvate to acetyl CoA by the pyruvate dehydrogenase complex

Pyruvate reacts with the TPP (Thiamine Phosphate) bound part of pyruvate dehydrogenase and undergoes decarboxylation to give hydroxyethyl-TPP.

This hydroxyethyl-TPP in turn gets oxidised to acetyl lipoamide by the same enzyme pyruvate dehydrogenase by the transfer of two electrons. These electrons then reduce the disulfide bond of the enzyme dihydrolipoyl transacetylase with the transfer of the acetyl group as highlighted in purple.

Dihydrolipoyl transacetylase catalyses the transesterification forming acetyl CoA by transfer of acetyl group to coenzyme A.

When acetyl CoA is being formed, at the same time reduced lipoamide is getting converted to oxidised lipoamide due to enzyme dihydrolipoyl dehydrogenase by the transfer of 2 hydrogen atoms to FAD.

Dihydrolipoyl dehydrogenase transfers the reduced equivalents (2 hydrogen atoms) to FAD thus forming FADH2. FADH2 in turn transfers a hydride ion to NAD+ to form NADH+H+.

2. Acetyl CoA Enters the Kreb’s Cycle

The acetyl CoA produced from the pyruvate dehydrogenase complex enters the Kreb’s cycle.

The animation below describes the Kreb’s cycle in detail followed by the discussion. A static image of the cycle can be found next to the discussion for reference. Press the play button to progress in the animation.

Discussion

Krebs1 cycle

The Kreb’s Cycle or Citric Acid Cycle or Tricarboxylic Acid Cycle in a static image version of the animation.

Acetyl CoA condenses with oxaloacetate (4C) to form a citrate (6C) by transferring its acetyl group in the presence of enzyme citrate synthase. The CoA liberated in this reaction is ready to participate in the oxidative decarboxylation of another molecule of pyruvate by PDH complex.

  • Citrate is then isomerised to Isocitrate by the enzyme aconitase through the formation of the intermediate cis-aconitate. This is a reversible reaction as aconitase has an iron-sulfur center which can promote reversible addition of H2O to the double bond of enzyme-bound cis-aconitate in 2 different ways, one forming citrate and the other isocitrate.
  • Isocitrate undergoes oxidative decarboxylation by the enzyme isocitrate dehydrogenase to form oxalosuccinate (intermediate- not shown) which in turn forms α-ketoglutarate (also known as oxoglutarate) which is a five carbon compound. CO2 and NADH are released in this step.
  • α-ketoglutarate (5C) undergoes oxidative decarboxylation once again to form succinyl CoA (4C) catalysed by the enzyme α-ketoglutarate dehydrogenase complex. α-ketoglutarate dehydrogenase complex is similar to PDH complex and is made up of 3 enzymes and is dependent on five co-enzymes TPP, FAD, NAD, bound lipoate and conenzyme A. In this step once again NADH and CO2 are liberated. So in all 2 molecules of NADH and 2 molecules of CO2 is produced till now.
  • Succinyl CoA is then converted to succinate by succinate thiokinase or succinyl coA synthetase in a reversible manner. This reaction involves an intermediate step in which the enzyme gets phosphorylated and then the phosphoryl group which has a high group transfer potential is transferred to GDP to form GTP. This GTP is converted to ATP by the enzyme nucleoside diphosphate kinase by donating its phosphoryl group to ADP. This reaction which involves the formation of GTP is a substrate level phosphorylation as it happens by using the energy formed by the oxidative decarboxylation of α-ketoglutarate.
  • Succinate then gets oxidised reversibly to fumarate by succinate dehydrogenase. The enzyme contains iron-sulfur clusters and covalently bound FAD which when undergoes electron exchange in the mitochondria causes the production of FADH2.
  • Fumarate is then by the enzyme fumarase converted to malate by hydration(addition of H2O) in a reversible manner.
  • Malate is then reversibly converted to oxaloacetate by malate dehydrogenase which is NAD linked and thus produces NADH.
  • The oxaloacetate produced is now ready to be utilized in the next cycle by the citrate synthase reaction and thus the equilibrium of the cycle shifts to the right.
Schrodingers_cat

Schrodingers_cat

Energetics of the Kreb’s Cycle

Keeping in mind that 1 molecule of glucose would produce 2 molecules of pyruvate via glycolysis. Hence the net energy produced by the Kreb’s cycle for each molecule of pyruvate is doubled for each molecule of glucose. Thus net energy yield in Kreb’s cycle can be summarized as follows for each molecule of glucose:

Reaction                                                              Number of ATP or                                        Number of ATP
reduced coenzyme formed                        ultimately formed

2 Pyruvate → 2 acetyl CoA                                  2 NADH                                                             5

2 Isocitrate → 2 α- ketoglutarate                     2 NADH                                                              5

2 α- ketoglutarate → 2 succinyl CoA             2 NADH                                                               5

2 Succinyl CoA → 2 succinate                           2 ATP                                                                  2

2 Succinate → 2 fumarate                               2 FADH2                                                               3

2 Malate → 2 oxaloacetate                            2 NADH                                                                  5

TOTAL                                                                                                                                                 25 ATP

* Note- This is calculated as 2.5 ATP per NADH and 1.5 ATP per FADH2. This is because there are multiple electron transport shuttle pathways through which these can be broken to ATP.

Regulation of Kreb’s Cycle

The amount of ADP and ATP largely control the citric acid cycle along with the activity of three key enzymes within the cycle:

Availability of ADP: ADP is a key substrate which finally gets converted to ATP that is essential for the energetics of the cell. A drop in ADP levels would result in inhibition of the electron transport system leading to accumulation of NADH and FADH2. These in turn inhibit the enzymes below.

Citrate Synthase: inhibited by ATP, acetyl CoA, NADH, and succinyl CoA.
Isocitrate Dehydrogenase: activated by ADP, and inhibited by NADH and ATP.
α-ketoglutarate dehydrogenase: inhibited by NADH and succinyl CoA.

Recommended Texts

David L. Nelson and Michael M. Cox, Lehninger Principles of Biochemistry 6th Edition
Jeremy M. Berg, John L. Tymockzo and Luber Stryer, Biochemistry 7th Edition

Tags: acetyl coA, animation, cellular respiration, citric acid cycle, energy, kreb’s cycle, pyruvate, pyruvate dehydrogenase, TCA cycle, tricarboxylic acid cycle

Energetics of Cellular Respiration (Glucose Metabolism)

By Sweety Mehta   – Oct 9, 2013 in: Biochemistry Notes, Notes
http://pharmaxchange.info/press/2013/10/energetics-of-cellular-respiration-glucose-metabolism/

energetics-of-cellular-respiration

electron transport chain in the mitochondrion energetics-of-cellular-respiration

Important Note: The NADH formed in the cytosol can yield variable amounts of ATP depending on the shuttle system utilized to transport them into the mitochondrial matrix. This NADH, formed in the cytosol, is impermeable to the mitochondrial inner-membrane where oxidative phosphorylation takes place. Thus to carry this NADH to the mitochondrial matrix there are special shuttle systems in the body. The most active shuttle is the malate-aspartate shuttle via which 2.5 molecules of ATP are generated for 1 NADH molecule. This shuttle is mainly used by the heart, liver and kidneys. The brain and skeletal muscles use the other shuttle known as glycerol 3-phosphate shuttle which synthesizes 1.5 molecules of ATP for 1 NADH.

Note: The above calculations are done considering that one NADH molecules produces 2.5 ATP and one FADH2 molecule produces 1.5 ATP in the ETS cycle (See full reasoning above). This is because the Kreb’s cycle occurs within the mitochondria and therefore does not require any shuttle pathway for the transport of the NADH into the mitochondrial matrix. Hence there is optimal conversion of NADH to ATP.

Development of the acetylation problem: a personal account

FRITZ LI P M A N N  Nobel Prize  1953

After my  apprenticeship with Otto Meyerhof, a first interest on my own became the phenomenon we call the Pasteur effect, this peculiar depression of the wasteful fermentation in the respiring cell. By looking for a chemical explanation of this economy measure on the cellular level, I was prompted into a study of the mechanism of pyruvic acid oxidation, since it is at the pyruvic stage where respiration branches off from fermentation. For this study I chose as a  promising system a relatively simple looking pyruvic acid oxidation enzyme in a certain strain of Lactobacillus delbrueckii1.

The most important event during this whole period, I now feel, was the accidental observation that in the L. delbrueckii system, pyruvic acid oxidation was completely dependent on the presence of inorganic phosphate. This observation was made in the course of attempts to replace oxygen by methylene blue. To measure the methylene blue reduction manometrically,
I had to switch to a bicarbonate buffer instead of the otherwise routinely used In bicarbonate, to my surprise, as shown in Fig. 1, pyruvate oxidation was very slow, but the addition of a little phosphate caused a remarkable increase in rate. The next figure, Fig. 2, shows the phosphate effect more drastically, using a preparation from which all phosphate was removed by washing with acetate buffer. Then it appeared that the reaction was really fully dependent on phosphate.

In spite of such a phosphate dependence, the phosphate balance measured by the ordinary Fiske-Subbarow procedure did not at first indicate any phosphorylative step. Nevertheless, the suspicion remained that phosphate in  some manner was entering into the reaction and that a phosphorylated intermediary was formed. As a first approximation, a coupling of this pyruvate oxidation with adenylic acid phosphorylation was attempted. And,indeed, addition of adenylic acid to the pyruvic oxidation system brought out a net  disappearance of inorganic phosphate, accounted for as adenosine triphosphate (Table 11).

I  now concluded that the missing link in the reaction chain was acetyl phosphate. In partial confirmation it was shown that a crude preparation of acetyl phosphate, synthesized by the old method of Kämmerer and Carius 2 would transfer phosphate to adenylic acid (Table 2). However, it still took quite some time from then on to identify acetyl phosphate definitely as the initial product of the pyruvic oxidation in this system3,4

At the time when these observations were made, about a dozen years ago,there was, to say the least, a tendency to believe that phosphorylation was rather specifically coupled with the glycolytic reaction. Here, however, we had found a coupling of phosphorylation with a respiratory system. This observation immediately suggested a rather sweeping biochemical significance, of transformations of electron transfer potential, respiratory or fermentative, to phosphate bond energy and therefrom to a wide range of biosynthetic reactions7.

There was a further unusual feature in this pyruvate oxidation system in that the product emerging from the process not only carried an energy-rich phosphoryl radical such as already known, but the acetyl phosphate was even more impressive through its energy-rich acetyl. It rather naturally became a contender for the role of “active” acetate, for the widespread existence of which the isotope experience had already furnished extensive evidence. I became, therefore, quite attracted by the possibility that acetyl phosphate could serve two rather different purposes, either to transfer its phosphoryl group into the phosphate pool, or to supply its active acetyl for biosynthesisof carbon structures. Thus acetyl phosphate should be able to serve as acetyldonor as well as phosphoryl donor, transferring, as shown in Fig. 3, on either side of the oxygen center, such as indicated by Bentley’s early experiments on cleavage7a of acetyl phosphate in H218O.

Phosphate dependence of pyruvate oxidation

Phosphate dependence of pyruvate oxidation

These two novel aspects of the energy problem, namely

(1) the emergence of an energy-rich phosphate bond from a purely
respiratory reaction; and

(2) the presumed derivation of a metabolic building-block through this same
reaction, prompted me to propose not only

  • the generalization of the phosphate bond as a versatie energy distributing system, but also to
    aim from there towards
  • a general concept of transfer of activated groupings by carrier as the fundamental reaction in
    biosynthesis8,9.

Although in the related manner the appearance of acetyl phosphate as a
metabolic intermediary first

  •  focused attention to possible mechanisms for the metabolic elaboration of  group activation,

it soon turned out that the relationship between acetyl phosphate and
acetyl transfer was much more complicated than anticipated.

Acetyl phosphate as acetyl and phosphoryl donor.

Although acetylation was found with rabbit liver homogenate, the
reaction was rather weak. In search of a more active system,   Pigeon
liver homogenate was tried and found to harbour an exceedingly potent
acetylation system (Ref. 11, cf. also Ref. 12). This finding of a particularly
active acetylation reaction in cell-free pigeon liver preparations was most
fortunate and played a quite important part in the development of the
acetylation problem.

[portion of lecture]

The pentose phosphate pathway is the major source for the NADPH
required for anabolic processes.
Pentose Phosphate Pathway

http://chemwiki.ucdavis.edu/Biological_Chemistry/Metabolism/Pentose_
Phosphate_Pathway

  • There are three distinct phases each of which has a distinct outcome.
  • Depending on the needs of the organism the metabolites of that outcome
    can be fed into many other pathways.
  • Gluconeogenesis is directly connected to the pentose phosphate pathway.
  • As the need for glucose-6-phosphate (the beginning metabolite in the pentose
    phosphate pathway) increases so does the activity of gluconeogenesis.

 pentose-phosphate-pathway

http://images.tutorvista.com/content/respiration/pentose-phosphate-pathway.jpeg

Introduction

The main molecule in the body that makes anabolic processes possible is NADPH.  Because of the structure of this molecule it readily donates hydrogen ions to metabolites thus reducing them and making them available for energy harvest at a later time. The PPP is the main source of synthesis for NADPH.  The pentose phosphate pathway (PPP) is also responsible for the production of Ribose-5-phosphate which is an important part of nucleic acids. Finally the PPP can also be used to produce glyceraldehyde-3-phosphate which can then be fed into the TCA and ETC cycles allowing for the harvest of energy. Depending on the needs of the cell certain enzymes can be regulated and thus increasing or decreasing the production of desired metabolites. The enzymes reasonable for catalyzing the steps of the PPP are found most abundantly in the liver (the major site of gluconeogenesis) more specifically in the cytosol. The cytosol is where fatty acid synthesis takes place which is a NADPH dependent process.


Oxidation Phase

  • The beginning molecule for the PPP is glucose-6-P which is the second intermediate metabolite in glycolysis. Glucose-6-P is oxidized in the presence of glucose-6-P dehydrogenase and NADP+.  This step is irreversible and is highly regulated.  NADPH and fatty acyl-CoA are strong negative inhibitors to this enzyme.  The purpose of this is to decrease production of NADPH when concentrations are high or the synthesis of fatty acids is no longer necessary.
  • The metabolic product of this step is gluconolactone which is hydrolytrically unstable.  Gluconolactonase causes gluconolactone to undergo a ring opening hydrolysis.  The product of this reaction is the more stable sugar acid, 6-phospho-D-gluconate.
  • 6-phospho-D-gluconate is oxidized by NADP+ in the presence of 6-phosphogluconate dehydrogenase which yields ribulose-5-phosphate.
  • The oxidation phase of the PPP is solely responsible for the production of the NADPH to be used in anabolic processes.

Isomerization Phase

  •  Ribulose-5-phosphate can then be isomerized by phosphopentose isomerase to produce ribose-5-phosphate.  Ribose-5-phosphate is one of the main building blocks of nucleic acids and the PPP is the primary source of production of ribose-5-phosphate.
  • If production of ribose-5-phosphate exceeds the needs of required ribose-5-phosphate in the organism, then phosphopentose epimerase catalyzes a chiralty rearrangement about the center carbon creating xylulose-5-phosphate.
  • The products of these two reactions can then be rearranged to produce many different length carbon chains.  These different length carbon chains have a variety of metabolic fates.

Rearrangement Phase 

  •  There are two main classes of enzymes responsible for the rearrangement and synthesis of the different length carbon chain molecules.  These are transketolase and transaldolase.
  • Transketolase is responsible for the cleaving of a two carbon unit from xylulose-5-P and adding that two carbon unit to ribose-5-P thus resulting in glyceraldehyde-3-P and sedoheptulose-7-P.
  • Transketolase is also responsible for the cleaving of a two carbon unit from xylulose-5-P and adding that two carbon unit to erythrose-4-P resulting in glyceraldehyde-3-P and fructose-6-P.
  • Transaldolase is responsible for cleaving the three carbon unit from sedoheptulose-7-P and adding that three carbon unit to glyceraldehyde-3-P thus resulting in erythrose-4-P and fructose-6-P.
  • The end results of the rearrangement phase is a variety of different length sugars which can be fed into many other metabolic processes.  For example, fructose-6-P is a key intermediate of glycolysis as well as glyceraldehyde-3-P.

References

  1. Garrett, H., Reginald and Charles Grisham. Biochemistry. Boston: Twayne Publishers, 2008.
  2. Raven, Peter. Biology. Boston: Twayne Publishers, 2005.

Glycogen Metabolism

Glycogen is a readily mobilized storage form of glucose. It is a very large, branched polymer of glucose residues (Figure 21.1) that can be broken down to yield glucose molecules when energy is needed. Most of the glucose residues in glycogen are linked by α-1,4-glycosidic bonds. Branches at about every tenth residue are created by α-1,6-glycosidic bonds. Recall that α-glycosidic linkages form open helical polymers, whereas β linkages produce nearly straight strands that form structural fibrils, as in cellulose (Section 11.2.3).

http://www.ncbi.nlm.nih.gov/books/NBK21190/bin/ch21f1.jpg

Figure 21.1

Glycogen Structure ch21f1

Glycogen Structure. In this structure of two outer branches of a glycogen molecule, the residues at the nonreducing ends are shown in red and residue that starts a branch is shown in green. The rest of the glycogen molecule is represented by R.

Glycogen is not as reduced as fatty acids are and consequently not as energy rich. Why do animals store any energy as glycogen? Why not convert all excess fuel into fatty acids? Glycogen is an important fuel reserve for several reasons. The controlled breakdown of glycogen and release of glucose increase the amount of glucose that is available between meals. Hence, glycogen serves as a buffer to maintain blood-glucose levels. Glycogen’s role in maintaining blood-glucose levels is especially important because glucose is virtually the only fuel used by the brain, except during prolonged starvation. Moreover, the glucose from glycogen is readily mobilized and is therefore a good source of energy for sudden, strenuous activity. Unlike fatty acids, the released glucose can provide energy in the absence of oxygen and can thus supply energy for anaerobic activity.

Gluconeogenesis
ChemWiki: The Dynamic Chemistry E-textbook > Biological Chemistry > Metabolism > Gluconeogenesis

Gluconeogenesis is much like glycolysis only the process occurs in reverse. However, there are exceptions. In glycolysis there are three highly exergonic steps (steps 1,3,10). These are also regulatory steps which include the enzymes hexokinase, phosphofructokinase, and pyruvate kinase. Biological reactions can occur in both the forward and reverse direction. If the reaction occurs in the reverse direction the energy normally released in that reaction is now required. If gluconeogenesis were to simply occur in reverse the reaction would require too much energy to be profitable to that particular organism. In order to overcome this problem, nature has evolved three other enzymes to replace the glycolysis enzymes hexokinase, phosphofructokinase, and pyruvate kinase when going through the process of gluconeogenesis:

  1. The first step in gluconeogenesis is the conversion of pyruvate to phosphoenolpyruvic acid (PEP). In order to convert pyruvate to PEP there are several steps and several enzymes required. Pyruvate carboxylase, PEP carboxykinase and malate dehydrogenase are the three enzymes responsible for this conversion. Pyruvate carboxylase is found on the mitochondria and converts pyruvate into oxaloacetate. Because oxaloacetate cannot pass through the mitochondria membranes it must be first converted into malate by malate dehydrogenase. Malate can then cross the mitochondria membrane into the cytoplasm where it is then converted back into oxaloacetate with another malate dehydrogenase. Lastly, oxaloacetate is converted into PEP via PEP carboxykinase. The next several steps are exactly the same as glycolysis only the process is in reverse.
  2. The second step that differs from glycolysis is the conversion of fructose-1,6-bP to fructose-6-P with the use of the enzyme fructose-1,6-phosphatase. The conversion of fructose-6-P to glucose-6-P uses the same enzyme as glycolysis, phosphoglucoisomerase.
  3. The last step that differs from glycolysis is the conversion of glucose-6-P to glucose with the enzyme glucose-6-phosphatase. This enzyme is located in the endoplasmic reticulum.

Glycolysis

File:Glycolysis overview.svg

Regulation

Because it is important for organisms to conserve energy, they have derived ways to regulate those metabolic pathways that require and release the most energy. In glycolysis and gluconeogenesis seven of the ten steps occur at or near equilibrium. In gluconeogenesis the conversion of pyruvate to PEP, the conversion of fructose-1,6-bP, and the conversion of glucose-6-P to glucose all occur very spontaneously which is why these processes are highly regulated. It is important for the organism to conserve as much energy as possible. When there is an excess of energy available, gluconeogenesis is inhibited. When energy is required, gluconeogenesis is activated.

  1. The conversion of pyruvate to PEP is regulated by acetyl-CoA. More specifically pyruvate carboxylase is activated by acetyl-CoA. Because acetyl-CoA is an important metabolite in the TCA cycle which produces a lot of energy, when concentrations of acetyl-CoA are high organisms use pyruvate carboxylase to channel pyruvate away from the TCA cycle. If the organism does not need more energy, then it is best to divert those metabolites towards storage or other necessary processes.
  2. The conversion of fructose-1,6-bP to fructose-6-P with the use of fructose-1,6-phosphatase is negatively regulated and inhibited by the molecules AMP and fructose-2,6-bP. These are reciprocal regulators to glycolysis’ phosphofructokinase. Phosphofructosekinase is positively regulated by AMP and fructose-2,6-bP. Once again, when the energy levels produced are higher than needed, i.e. a large ATP to AMP ratio, the organism increases gluconeogenesis and decreases glycolysis. The opposite also applies when energy levels are lower than needed, i.e. a low ATP to AMP ratio, the organism increases glycolysis and decreases gluconeogenesis.
  3. The conversion of glucose-6-P to glucose with use of glucose-6-phosphatase is controlled by substrate level regulation. The metabolite responsible for this type of regulation is glucose-6-P. As levels of glucose-6-P increase, glucose-6-phosphatase increases activity and more glucose is produced. Thus glycolysis is unable to proceed.


Read Full Post »

Signaling transduction tutorial

Larry H. Bernstein, MD, FCAP, Reporter and Curator
Leaders in Pharmaceutical Intelligence

http://pharmaceuticalintelligence.com/8-10-2014/Signaling transduction tutorial

This portion of the discussion is a series of articles on signaling and signaling pathways. Many of the protein-protein interactions or protein-membrane interactions and associated regulatory features have been referred to previously, but the focus of the discussion or points made were different.  I considered placing this after the discussion of proteins and how they play out their essential role, but this is quite a suitable place for a progression to what follows.  This is introduced by material taken from Wikipedia, which will be followed by a series of mechanisms and examples from the current literature, which give insight into the developments in cell metabolism, with the later goal of separating views introduced by molecular biology and genomics from functional cellular dynamics that are not dependent on the classic view.  The work is vast, and this discussion does not attempt to cover it in great depth.  It is the first in a series.  This discussion, in particular is a tutorial on signaling transduction that was already available, and relevant.  One may note that all of the slides used herein were also used in the previous blog, but in a different construction.  I shall tweak the contents, as I find helpful.

  1. Signaling and signaling pathways
  2. Signaling transduction tutorial.
  3. Carbohydrate metabolism
  4. Lipid metabolism
  5. Protein synthesis and degradation
  6. Subcellular structure
  7. Impairments in pathological states: endocrine disorders; stress hypermetabolism; cancer.


Signal Transduction Tutorial

The goal of this tutorial is for you to gain an understanding of how cell signaling occurs in a cell.  Upon completion of the tutorial,

  • you will have a basic understanding signal transduction and
  • the role of phosphorylation in signal transduction.

You will also have detailed knowledge of

  • the role of Tyrosine kinases and
  • G protein-coupled receptors in cell signaling.
  1. Description of Signal Transduction

As living organisms

  • we are constantly receiving and interpreting signals from our environment.

These signals can come

  • in the form of light, heat, odors, touch or sound.

The cells of our bodies are also

  • constantly receiving signals from other cells.

These signals are important to

  • keep cells alive and functioning as well as
  • to stimulate important events such as
  • cell division and differentiation.

Signals are most often chemicals that can be found

  • in the extracellular fluid around cells.

These chemicals can come

  • from distant locations in the body (endocrine signaling by hormones), from
  • nearby cells (paracrine signaling) or can even
  • be secreted by the same cell (autocrine signaling).
intercellular signaling

intercellular signaling

http://www.hartnell.edu/tutorials/biology/images/intercellularsignaling.jpg

Signaling molecules may trigger any number of cellular responses, including

  • changing the metabolism of the cell receiving the signal or
  • result in a change in gene expression (transcription) within the nucleus of the cell or both.

Overview of Cell Signaling

Cell signaling can be divided into 3 stages.

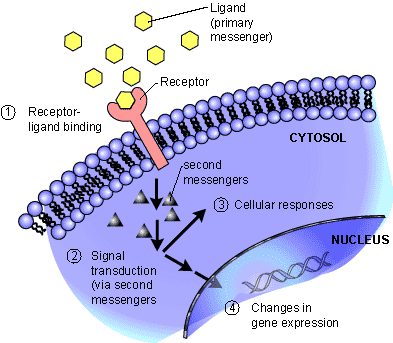
  1. Reception: A cell detects a signaling molecule from the outside of the cell. A signal is detected when the chemical signal (also known as a ligand) binds to a receptor protein on the surface of the cell or inside the cell.
  2. Transduction: When the signaling molecule binds the receptor it changes the receptor protein in some way. This change initiates the process of transduction. Signal transduction is usually a pathway of several steps. Each relay molecule in the signal transduction pathway changes the next molecule in the pathway.
  3. Response: Finally, the signal triggers a specific cellular response.
signal transduction_simple

signal transduction_simple

http://www.hartnell.edu/tutorials/biology/images/signaltransduction_simple.jpg

Reception

Signal Transduction - ligand binds to surface receptor

Signal Transduction – ligand binds to surface receptor


Membrane receptors function by binding the signal molecule (ligand) and causing the production of a second signal (also known as a second messenger) that then causes a cellular response. These types of receptors transmit information from the extracellular environment to the inside of the cell

  • by changing shape or
conformational-rearrangements

conformational-rearrangements

Enzyme_Model  allosterism

Enzyme_Model allosterism

  • by joining with another protein
  • once a specific ligand binds to it.

Examples of membrane receptors include

  • G Protein-Coupled Receptors and
membrane_receptor_g protein

membrane_receptor_g protein


  • Receptor Tyrosine Kinases.
activation of receptor Tyrosine Kinase

activation of receptor Tyrosine Kinase

http://www.hartnell.edu/tutorials/biology/images/membrane_receptor_tk.jpg

Intracellular receptors are found inside the cell, either in the cytopolasm or in the nucleus of the target cell (the cell receiving the signal).

Chemical messengers that are hydrophobic or very small (steroid hormones for example) can

  • pass through the plasma membrane without assistance and
  • bind these intracellular receptors.

Once bound and activated by the signal molecule,

  • the activated receptor can initiate a cellular response, such as a
  • change in gene expression.

Note that this is the first time that change in gene expression is stated.  Is the change in gene expression implication of a change in the genetic information – such as – mutation?  That does not have to be the case in the normal homeostatic case.  This might only be

  • a change in the rate of a transcription or a suppression of expression through RNA.
intracellular_receptor_steroid

intracellular_receptor_steroid

http://www.hartnell.edu/tutorials/biology/images/intracellular_receptor_steroid.jpg

Transduction

Since signaling systems need to be

  • responsive to small concentrations of chemical signals and act quickly,
  • cells often use a multi-step pathway that transmits the signal quickly,
  • while amplifying the signal to numerous molecules at each step.
Signal transduction cascades amplify the signal output

Signal transduction cascades amplify the signal output

Steps in the signal transduction pathway often involve

  • the addition or removal of phosphate groups which results in the activation of proteins.
  • Enzymes that transfer phosphate groups from ATP to a protein are called protein kinases.

Many of the relay molecules in a signal transduction pathway are protein kinases and

  • often act on other protein kinases in the pathway. Often
  • this creates a phosphorylation cascade, where
  • one enzyme phosphorylates another, which then phosphorylates another protein, causing a chain reaction.
phosphorylation-cascade

phosphorylation-cascade

Also important to the phosphorylation cascade are

  • a group of proteins known as protein phosphatases.

Protein phosphatases are enzymes that can rapidly remove phosphate groups from proteins (dephosphorylation) and thus inactivate protein kinases. Protein phosphatases are

  • the “off switch” in the signal transduction pathway.

Phosphorylation Dephosphorylation


Turning the signal transduction pathway off when the signal is no longer present is important

  • to ensure that the cellular response is regulated appropriately.

Dephosphorylation also makes protein kinases

  • available for reuse and
  • enables the cell to respond again when another signal is received.

Kinases are not the only tools used by cells in signal transduction. Small, nonprotein, water-soluble molecules or ions called second messengers (the ligand that binds the receptor is the first messenger) can also

  • relay signals received by receptors on the cell surface
  • to target molecules in the cytoplasm or the nucleus.
membrane protein receptor binds with hormone

membrane protein receptor binds with hormone


insulin receptor and and insulin receptor signaling pathway (IRS)

insulin receptor and and insulin receptor signaling pathway (IRS)


binding-proteins-and-bioavailable-25-hydroxyvitamin-d

binding-proteins-and-bioavailable-25-hydroxyvitamin-d


Examples of second messengers include cyclic AMP (cAMP) and calcium ions.

membrane_receptor_g protein

membrane_receptor_g protein

http://www.hartnell.edu/tutorials/biology/images/membrane_receptor_gprotein.jpg

Response

Cell signaling ultimately leads to the regulation of one or more cellular activities. Regulation of gene expression (turning transcription of specific genes on or off) is a common outcome of cell signaling. A signaling pathway may also

  • regulate the activity of a protein, for example
ion-transporters-and-channels-in-mammalian-choroidal-epithelium

ion-transporters-and-channels-in-mammalian-choroidal-epithelium

Ca(2+) and contraction

Ca(2+) and contraction


transepithelial-electrogenic-ion-transport

transepithelial-electrogenic-ion-transport


calcium release flux

calcium release flux


coupled receptors


  1. opening or closing an ion channel in the plasma membrane or
  2. promoting a change in cell metabolism such as catalyzing the breakdown of glycogen.

Signaling pathways can also lead to important cellular events such as

  • cell division or apoptosis (programmed cell death).
ubiquitylation-is-a-multistep-reaction.

ubiquitylation-is-a-multistep-reaction.


Involvement of VSMCs apoptosis in fibrous plaque rupture.

Involvement of VSMCs apoptosis in fibrous plaque rupture.


G- Protein-Coupled Receptor


membrane_receptor_g protein

membrane_receptor_g protein

Arrestin binding to active GPCR kinase (GRK)-phosphorylated GPCRs blocks G protein coupling

Arrestin binding to active GPCR kinase (GRK)-phosphorylated GPCRs blocks G protein coupling

Signal Transduction Tutorial by Dr. Katherine Harris is licensed under a Creative Commons Attribution-NonCommercial-ShareAlike 3.0 Unported License.

Funded by the U.S. Department of Education, College Cost Reduction and Access (CCRAA) grant award # P031C080096.

http://creativecommons.org/licenses/by-nc-sa/3.0/

  • NonCommercial — You may not use the material for commercial purposes.
  • ShareAlike — If you remix, transform, or build upon the material, you must distribute your contributions under the same license as the original.

Adapt — remix, transform, and build upon the material

hormone + receptor signaling

http://home.earthlink.net/~dayvdanls/SignalTrans.gif

Signal-Transduction-Pathway

http://pi-silico.hkbu.edu.hk/wp-content/uploads/2012/12/Signal-Transduction-Pathway.png

http://upload.wikimedia.org/wikipedia/commons/a/a4/1Signal_Transduction_Pathways_Model.jpg

Akt mTOR pathway

Akt mTOR pathway

http://cc.scu.edu.cn/G2S/eWebEditor/uploadfile/20120810155043970.jpg

Quia – 9AP Chapter 11 – Cell Commun

http://www.quia.com/files/quia/users/lmcgee/membranetransport/cell_communication/reception_transduction_resp.gif

http://cc.scu.edu.cn/G2S/eWebEditor/uploadfile/20120810155043970.jpg

HER2 in Breast Cancer–What Does it Mean?

http://img.medscape.com/fullsize/migrated/editorial/clinupdates/2000/681/tu02.fig2.jpg

Protease signalling: the cutting edge

http://emboj.embopress.org/content/embojnl/31/7/1630/F5.large.jpg

Quia – 9AP Chapter 11 – Cell Commun

http://www.quia.com/files/quia/users/lmcgee/membranetransport/cell_communication/phosphorylation-cascade.gif


Signal Transduction in Autism

http://www.mun.ca/biology/desmid/brian/BIOL2060/BIOL2060-14/1403.jpg

The multiple protein-dependent steps in signal transduction

http://www.nature.com/nrm/journal/v1/n2/images/nrm1100_145a_i2.gif

CONVERSING AT THE CELLULAR LEVEL: AN INTRODUCTION TO SIGNAL …

  1. scq.ubc.ca


http://www.scq.ubc.ca/wp-content/uploads/2006/07/transduction.gif


Biology 1710 > Davis > Flashcards > exam 1 | StudyBlue

  1. studyblue.com


http://classconnection.s3.amazonaws.com/602/flashcards/1005602/png/bio101332955375817.png


Read Full Post »

Signaling and Signaling Pathways

Curator: Larry H. Bernstein, MD, FCAP


http://pharmaceuticalintelligence.com/8-9-2014/Signaling and Signaling Pathways

This portion of the discussion is a series of articles on signaling and signaling pathways. Many of the protein-protein interactions or protein-membrane interactions and associated regulatory features have been referred to previously, but the focus of the discussion or points made were different.  I considered placing this after the discussion of proteins and how they play out their essential role, but this is quite a suitable place for a progression to what follows.  This is introduced by material taken from Wikipedia, which will be followed by a series of mechanisms and examples from the current literature, which give insight into the developments in cell metabolism, with the later goal of separating views introduced by molecular biology and genomics from functional cellular dynamics that are not dependent on the classic view.  The work is vast, and this discussion does not attempt to cover it in great depth.  It is the first in a series.

  1. Signaling and signaling pathways
  2. Signaling transduction tutorial.
  3. Carbohydrate metabolism
  4. Lipid metabolism
  5. Protein synthesis and degradation
  6. Subcellular structure
  7. Impairments in pathological states: endocrine disorders; stress hypermetabolism; cancer.

Signal transduction

(From Wikipedia, the free encyclopedia)
http://en.wikipedia.org/wiki/File:Signal_transduction_publications_graph.jpeg


Signal_transduction_pathways.svg

Signal_transduction_pathways.svg


Signal transduction occurs when an extracellular signaling[1] molecule activates a specific receptor located on the cell surface or inside the cell. In turn, this receptor triggers a biochemical chain of events inside the cell, creating a response.[2] Depending on the cell, the response alters the cell’s metabolism, shape, gene expression, or ability to divide.[3] The signal can be amplified at any step. Thus, one signaling molecule can cause many responses.[4]

In 1970, Martin Rodbell examined the effects of glucagon on a rat’s liver cell membrane receptor. He noted that guanosine triphosphate disassociated glucagon from this receptor and stimulated the G-protein, which strongly influenced the cell’s metabolism. Thus, he deduced that the G-protein is a transducer that accepts glucagon molecules and affects the cell.[5] For this, he shared the 1994 Nobel Prize in Physiology or Medicine with Alfred G. Gilman.

Signal_transduction_publications_graph

Signal_transduction_publications_graph

The earliest MEDLINE entry for “signal transduction” dates from 1972.[6] Some early articles used the terms signal transmission and sensory transduction.[7][8] In 2007, a total of 48,377 scientific papers—including 11,211 e review papers—were published on the subject. The term first appeared in a paper’s title in 1979.[9][10] Widespread use of the term has been traced to a 1980 review article by Rodbell:[5][11] Research papers focusing on signal transduction first appeared in large numbers in the late 1980s and early 1990s.[12]

Notch-mediated juxtacrine signal between adjacent cells.

Notch-mediated juxtacrine signal between adjacent cells.

Signal transduction involves the binding of extracellular signaling molecules and ligands to cell-surface receptors that trigger events inside the cell. The combination of messenger with receptor causes a change in the conformation of the receptor, known as receptor activation. This activation is always the initial step (the cause) leading to the cell’s ultimate responses (effect) to the messenger. Despite the myriad of these ultimate responses, they are all directly due to changes in particular cell proteins. Intracellular signaling cascades can be started through cell-substratum interactions; examples are the integrin that binds ligands in the extracellular matrix and steroids.[13] Most steroid hormones have receptors within the cytoplasm and act by stimulating the binding of their receptors to the promoter region of steroid-responsive genes.[14] Examples of signaling molecules include the hormone melatonin,[15] the neurotransmitter acetylcholine[16] and the cytokine interferon γ.[17]

Signal transduction cascades amplify the signal output

Signal transduction cascades amplify the signal output

Various environmental stimuli exist that initiate signal transmission processes in multicellular organisms; examples include photons hitting cells in the retina of the eye,[20] and odorants binding to odorant receptors in the nasal epithelium.[21] Certain microbial molecules, such as viral nucleotides and protein antigens, can elicit an immune system response against invading pathogens mediated by signal transduction processes. This may occur independent of signal transduction stimulation by other molecules, as is the case for the toll-like receptor. It may occur with help from stimulatory molecules located at the cell surface of other cells, as with T-cell receptor signaling. Unicellular organisms may respond to environmental stimuli through the activation of signal transduction pathways. For example, slime molds secrete cyclic adenosine monophosphate upon starvation, stimulating individual cells in the immediate environment to aggregate,[22] and yeast cells use mating factors to determine the mating types of other cells and to participate in sexual reproduction.[23] Receptors can be roughly divided into two major classes: intracellular receptors and extracellular receptors.

Extracellular

Extracellular receptors are integral transmembrane proteins and make up most receptors. They span the plasma membrane of the cell, with one part of the receptor on the outside of the cell and the other on the inside. Signal transduction occurs as a result of a ligand binding to the outside; the molecule does not pass through the membrane. This binding stimulates a series of events inside the cell; different types of receptor stimulate different responses and receptors typically respond to only the binding of a specific ligand. Upon binding, the ligand induces a change in the conformation of the inside part of the receptor.[24] These result in either the activation of an enzyme in the receptor or the exposure of a binding site for other intracellular signaling proteins within the cell, eventually propagating the signal through the cytoplasm.

In eukaryotic cells, most intracellular proteins activated by a ligand/receptor interaction possess an enzymatic activity; examples include tyrosine kinase and phosphatases. Some of them create second messengers such as cyclic AMP and IP3, the latter controlling the release of intracellular calcium stores into the cytoplasm. Other activated proteins interact with adaptor proteins that facilitate signalling protein interactions and coordination of signalling complexes necessary to respond to a particular stimulus. Enzymes and adaptor proteins are both responsive to various second messenger molecules.

Many adaptor proteins and enzymes activated as part of signal transduction possess specialized protein domains that bind to specific secondary messenger molecules. For example, calcium ions bind to the EF hand domains of calmodulin, allowing it to bind and activate calmodulin-dependent kinase. PIP3 and other phosphoinositides do the same thing to the Pleckstrin homology domains of proteins such as the kinase protein AKT.

G protein-coupled

G protein-coupled receptors (GPCRs) are a family of integral transmembrane proteins that possess seven transmembrane domains and are linked to a heterotrimeric G protein. Many receptors are in this family, including adrenergic receptors and chemokine receptors.

Arrestin binding to active GPCR kinase (GRK)-phosphorylated GPCRs blocks G protein coupling

Arrestin binding to active GPCR kinase (GRK)-phosphorylated GPCRs blocks G protein coupling

Signal transduction by a GPCR begins with an inactive G protein coupled to the receptor; it exists as a heterotrimer consisting of Gα, Gβ, and Gγ.[25] Once the GPCR recognizes a ligand, the conformation of the receptor changes to activate the G protein, causing Gα to bind a molecule of GTP and dissociate from the other two G-protein subunits. The dissociation exposes sites on the subunits that can interact with other molecules.[26] The activated G protein subunits detach from the receptor and initiate signaling from many downstream effector proteins such as phospholipases and ion channels, the latter permitting the release of second messenger molecules.[27] The total strength of signal amplification by a GPCR is determined by the lifetimes of the ligand-receptor complex and receptor-effector protein complex and the deactivation time of the activated receptor and effectors through intrinsic enzymatic activity.

A study was conducted where a point mutation was inserted into the gene encoding the chemokine receptor CXCR2; mutated cells underwent a malignant transformation due to the expression of CXCR2 in an active conformation despite the absence of chemokine-binding. This meant that chemokine receptors can contribute to cancer development.[28]

Tyrosine and histidine kinase

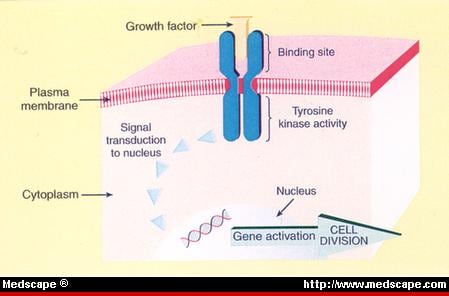
Receptor tyrosine kinases (RTKs) are transmembrane proteins with an intracellular kinase domain and an extracellular domain that binds ligands; examples include growth factor receptors such as the insulin receptor.[29] To perform signal transduction, RTKs need to form dimers in the plasma membrane;[30] the dimer is stabilized by ligands binding to the receptor. The interaction between the cytoplasmic domains stimulates the autophosphorylation of tyrosines within the domains of the RTKs, causing conformational changes. Subsequent to this, the receptors’ kinase domains are activated, initiating phosphorylation signaling cascades of downstream cytoplasmic molecules that facilitate various cellular processes such as cell differentiation and metabolism.[29]

As is the case with GPCRs, proteins that bind GTP play a major role in signal transduction from the activated RTK into the cell. In this case, the G proteins are members of the Ras, Rho, and Raf families, referred to collectively as small G proteins. They act as molecular switches usually tethered to membranes by isoprenyl groups linked to their carboxyl ends. Upon activation, they assign proteins to specific membrane subdomains where they participate in signaling. Activated RTKs in turn activate small G proteins that activate guanine nucleotide exchange factors such as SOS1. Once activated, these exchange factors can activate more small G proteins, thus amplifying the receptor’s initial signal. The mutation of certain RTK genes, as with that of GPCRs, can result in the expression of receptors that exist in a constitutively activate state; such mutated genes may act as oncogenes.[31]

Histidine-specific protein kinases are structurally distinct from other protein kinases and are found in prokaryotes, fungi, and plants as part of a two-component signal transduction mechanism: a phosphate group from ATP is first added to a histidine residue within the kinase, then transferred to an aspartate residue on a receiver domain on a different protein or the kinase itself, thus activating the aspartate residue.[32]

Integrin

integrin-mediated signal transduction

integrin-mediated signal transduction

An overview of integrin-mediated signal transduction, adapted from Hehlgens et al. (2007).[33]

Integrins are produced by a wide variety of cells; they play a role in cell attachment to other cells and the extracellular matrix and in the transduction of signals from extracellular matrix components such as fibronectin and collagen. Ligand binding to the extracellular domain of integrins changes the protein’s conformation, clustering it at the cell membrane to initiate signal transduction. Integrins lack kinase activity; hence, integrin-mediated signal transduction is achieved through a variety of intracellular protein kinases and adaptor molecules, the main coordinator being integrin-linked kinase.[33] As shown in the picture to the right, cooperative integrin-RTK signalling determines the timing of cellular survival, apoptosis, proliferation, and differentiation.

Important differences exist between integrin-signalling in circulating blood cells and non-circulating cells such as epithelial cells; integrins of circulating cells are normally inactive. For example, cell membrane integrins on circulating leukocytes are maintained in an inactive state to avoid epithelial cell attachment; they are activated only in response to stimuli such as those received at the site of an inflammatory response. In a similar manner, integrins at the cell membrane of circulating platelets are normally kept inactive to avoid thrombosis. Epithelial cells (which are non-circulating) normally have active integrins at their cell membrane, helping maintain their stable adhesion to underlying stromal cells that provide signals to maintain normal functioning.[34]

Toll gate

When activated, toll-like receptors (TLRs) take adapter molecules within the cytoplasm of cells in order to propagate a signal. Four adaptor molecules are known to be involved in signaling, which are Myd88, TIRAP, TRIF, and TRAM.[35][36][37] These adapters activate other intracellular molecules such as IRAK1, IRAK4, TBK1[disambiguation needed], and IKKi that amplify the signal, eventually leading to the induction or suppression of genes that cause certain responses. Thousands of genes are activated by TLR signaling, implying that this method constitutes an important gateway for gene modulation.

Ligand-gated ion channel

A ligand-gated ion channel, upon binding with a ligand, changes conformation to open a channel in the cell membrane through which ions relaying signals can pass. An example of this mechanism is found in the receiving cell of a neural synapse. The influx of ions that occurs in response to the opening of these channels induces action potentials, such as those that travel along nerves, by depolarizing the membrane of post-synaptic cells, resulting in the opening of voltage-gated ion channels.

An example of an ion allowed into the cell during a ligand-gated ion channel opening is Ca2+; it acts as a second messenger initiating signal transduction cascades and altering the physiology of the responding cell. This results in amplification of the synapse response between synaptic cells by remodelling the dendritic spines involved in the synapse.

Ion transporters and channels in mammalian choroidal epithelium

Ion transporters and channels in mammalian choroidal epithelium


Intracellular

Extracellular receptors are integral transmembrane proteins and make up most receptors. They span the plasma membrane of the cell, with one part of the receptor on the outside of the cell and the other on the inside. Signal transduction occurs as a result of a ligand binding to the outside; the molecule does not pass through the membrane. This binding stimulates a series of events inside the cell; different types of receptor stimulate different responses and receptors typically respond to only the binding of a specific ligand. Upon binding, the ligand induces a change in the conformation of the inside part of the receptor.[24] These result in either the activation of an enzyme in the receptor or the exposure of a binding site for other intracellular signaling proteins within the cell, eventually propagating the signal through the cytoplasm.

Understanding these receptors and identifying their ligands and the resulting signal transduction pathways represent a major conceptual advance

Understanding these receptors and identifying their ligands and the resulting signal transduction pathways represent a major conceptual advance


intercellular signaling

intercellular signaling


conformational-rearrangements

conformational-rearrangements


membrane protein receptor binds with hormone

membrane protein receptor binds with hormone


The multiple protein-dependent steps in signal transduction

The multiple protein-dependent steps in signal transduction

In eukaryotic cells, most intracellular proteins activated by a ligand/receptor interaction possess an enzymatic activity; examples include tyrosine kinase and phosphatases. Some of them create second messengers such as cyclic AMP and IP3, the latter controlling the release of intracellular calcium stores into the cytoplasm. Other activated proteins interact with adaptor proteins that facilitate signalling protein interactions and coordination of signalling complexes necessary to respond to a particular stimulus. Enzymes and adaptor proteins are both responsive to various second messenger molecules.

Ca++ exchange

Ca++ exchange

Many adaptor proteins and enzymes activated as part of signal transduction possess specialized protein domains that bind to specific secondary messenger molecules. For example, calcium ions bind to the EF hand domains of calmodulin, allowing it to bind and activate calmodulin-dependent kinase. PIP3 and other phosphoinositides do the same thing to the Pleckstrin homology domains of proteins such as the kinase protein AKT.

G protein-coupled

G protein-coupled receptors (GPCRs) are a family of integral transmembrane proteins that possess seven transmembrane domains and are linked to a heterotrimeric G protein. Many receptors are in this family, including adrenergic receptors and chemokine receptors.

membrane_receptor_g protein

membrane_receptor_g protein


intracellular_receptor_steroid

intracellular_receptor_steroid

Signal transduction by a GPCR begins with an inactive G protein coupled to the receptor; it exists as a heterotrimer consisting of Gα, Gβ, and Gγ.[25] Once the GPCR recognizes a ligand, the conformation of the receptor changes to activate the G protein, causing Gα to bind a molecule of GTP and dissociate from the other two G-protein subunits. The dissociation exposes sites on the subunits that can interact with other molecules.[26] The activated G protein subunits detach from the receptor and initiate signaling from many downstream effector proteins such as phospholipases and ion channels, the latter permitting the release of second messenger molecules.[27] The total strength of signal amplification by a GPCR is determined by the lifetimes of the ligand-receptor complex and receptor-effector protein complex and the deactivation time of the activated receptor and effectors through intrinsic enzymatic activity.

A study was conducted where a point mutation was inserted into the gene encoding the chemokine receptor CXCR2; mutated cells underwent a malignant transformation due to the expression of CXCR2 in an active conformation despite the absence of chemokine-binding. This meant that chemokine receptors can contribute to cancer development.[28]

Tyrosine and histidine kinase

Receptor tyrosine kinases (RTKs) are transmembrane proteins with an intracellular kinase domain and an extracellular domain that binds ligands; examples include growth factor receptors such as the insulin receptor.[29] To perform signal transduction, RTKs need to form dimers in the plasma membrane;[30] the dimer is stabilized by ligands binding to the receptor. The interaction between the cytoplasmic domains stimulates the autophosphorylation of tyrosines within the domains of the RTKs, causing conformational changes. Subsequent to this, the receptors’ kinase domains are activated, initiating phosphorylation signaling cascades of downstream cytoplasmic molecules that facilitate various cellular processes such as cell differentiation and metabolism.[29]

insulin-receptor-and-and-insulin-receptor-signaling-pathway-irs

insulin-receptor-and-and-insulin-receptor-signaling-pathway-irs


receptors-regulators

receptors-regulators

phosphorylation-cascade

phosphorylation-cascade


As is the case with GPCRs, proteins that bind GTP play a major role in signal transduction from the activated RTK into the cell. In this case, the G proteins are members of the Ras, Rho, and Raf families, referred to collectively as small G proteins. They act as molecular switches usually tethered to membranes by isoprenyl groups linked to their carboxyl ends. Upon activation, they assign proteins to specific membrane subdomains where they participate in signaling. Activated RTKs in turn activate small G proteins that activate guanine nucleotide exchange factors such as SOS1. Once activated, these exchange factors can activate more small G proteins, thus amplifying the receptor’s initial signal. The mutation of certain RTK genes, as with that of GPCRs, can result in the expression of receptors that exist in a constitutively activate state; such mutated genes may act as oncogenes.[31]

Histidine-specific protein kinases are structurally distinct from other protein kinases and are found in prokaryotes, fungi, and plants as part of a two-component signal transduction mechanism: a phosphate group from ATP is first added to a histidine residue within the kinase, then transferred to an aspartate residue on a receiver domain on a different protein or the kinase itself, thus activating the aspartate residue.[32]


Integrin

integrin-mediated signal transduction

integrin-mediated signal transduction

An overview of integrin-mediated signal transduction, adapted from Hehlgens et al. (2007).[33]

Integrins are produced by a wide variety of cells; they play a role in cell attachment to other cells and the extracellular matrix and in the transduction of signals from extracellular matrix components such as fibronectin and collagen. Ligand binding to the extracellular domain of integrins changes the protein’s conformation, clustering it at the cell membrane to initiate signal transduction. Integrins lack kinase activity; hence, integrin-mediated signal transduction is achieved through a variety of intracellular protein kinases and adaptor molecules, the main coordinator being integrin-linked kinase.[33] As shown in the picture to the right, cooperative integrin-RTK signalling determines the timing of cellular survival, apoptosis, proliferation, and differentiation.

Platelet signaling pathways

Platelet signaling pathways


Protein ubiquitylation

Protein ubiquitylation

ubiquitylation-is-a-multistep-reaction.

ubiquitylation-is-a-multistep-reaction.


Important differences exist between integrin-signaling in circulating blood cells and non-circulating cells such as epithelial cells; integrins of circulating cells are normally inactive. For example, cell membrane integrins on circulating leukocytes are maintained in an inactive state to avoid epithelial cell attachment; they are activated only in response to stimuli such as those received at the site of an inflammatory response. In a similar manner, integrins at the cell membrane of circulating platelets are normally kept inactive to avoid thrombosis. Epithelial cells (which are non-circulating) normally have active integrins at their cell membrane, helping maintain their stable adhesion to underlying stromal cells that provide signals to maintain normal functioning.[34]

Toll gate

When activated, toll-like receptors (TLRs) take adapter molecules within the cytoplasm of cells in order to propagate a signal. Four adaptor molecules are known to be involved in signaling, which are Myd88, TIRAP, TRIF, and TRAM.[35][36][37] These adapters activate other intracellular molecules such as IRAK1, IRAK4, TBK1[disambiguation needed], and IKKi that amplify the signal, eventually leading to the induction or suppression of genes that cause certain responses. Thousands of genes are activated by TLR signaling, implying that this method constitutes an important gateway for gene modulation.


SignalTrans

SignalTrans


Signal-Transduction-Pathway


Ligand-gated ion channel

A ligand-gated ion channel, upon binding with a ligand, changes conformation to open a channel in the cell membrane through which ions relaying signals can pass. An example of this mechanism is found in the receiving cell of a neural synapse. The influx of ions that occurs in response to the opening of these channels induces action potentials, such as those that travel along nerves, by depolarizing the membrane of post-synaptic cells, resulting in the opening of voltage-gated ion channels.

An example of an ion allowed into the cell during a ligand-gated ion channel opening is Ca2+; it acts as a second messenger initiating signal transduction cascades and altering the physiology of the responding cell. This results in amplification of the synapse response between synaptic cells by remodelling the dendritic spines involved in the synapse.

Ion transporters and channels in mammalian choroidal epithelium

Ion transporters and channels in mammalian choroidal epithelium

Intracellular

Intracellular receptors, such as nuclear receptors and cytoplasmic receptors, are soluble proteins localized within their respective areas. The typical ligands for nuclear receptors are lipophilic hormones like the steroid hormones testosterone and progesterone and derivatives of vitamins A and D. To initiate signal transduction, the ligand must pass through the plasma membrane by passive diffusion. On binding with the receptor, the ligands pass through the nuclear membrane into the nucleus, enabling gene transcription and protein production.


Signal Transduction

Signal Transduction


Activated nuclear receptors attach to the DNA at receptor-specific hormone-responsive element (HRE) sequences, located in the promoter region of the genes activated by the hormone-receptor complex. Due to their enabling gene transcription, they are alternatively called inductors of gene expression. All hormones that act by regulation of gene expression have two consequences in their mechanism of action; their effects are produced after a characteristically long period of time and their effects persist for another long period of time, even after their concentration has been reduced to zero, due to a relatively slow turnover of most enzymes and proteins that would either deactivate or terminate ligand binding onto the receptor.

Signal transduction via these receptors involves little proteins, but the details of gene regulation by this method are not well-understood. Nucleic receptors have DNA-binding domains containing zinc fingers and a ligand-binding domain; the zinc fingers stabilize DNA binding by holding its phosphate backbone. DNA sequences that match the receptor are usually hexameric repeats of any kind; the sequences are similar but their orientation and distance differentiate them. The ligand-binding domain is additionally responsible for dimerization of nucleic receptors prior to binding and providing structures for transactivation used for communication with the translational apparatus.


signal-transduction-in-protease-signaling-

signal-transduction-in-protease-signaling-


protein changes in biological mechanisms

protein changes in biological mechanisms


Steroid receptors are a subclass of nuclear receptors located primarily within the cytosol; in the absence of steroids, they cling together in an aporeceptor complex containing chaperone or heatshock proteins (HSPs). The HSPs are necessary to activate the receptor by assisting the protein to fold in a way such that the signal sequence enabling its passage into the nucleus is accessible. Steroid receptors, on the other hand, may be repressive on gene expression when their transactivation domain is hidden; activity can be enhanced by phosphorylation of serine residues at their N-terminal as a result of another signal transduction pathway, a process called crosstalk.

Structure of the N-terminal domain of the yeast Hsp90 chaperone

Structure of the N-terminal domain of the yeast Hsp90 chaperone

Pincer movement of Hsp90 coupled to the ATPase cycle. NTD = N-terminal domain, MD = middle domain, CTD = C-terminal domain.

Pincer movement of Hsp90 coupled to the ATPase cycle. NTD = N-terminal domain, MD = middle domain, CTD = C-terminal domain.

Retinoic acid receptors are another subset of nuclear receptors. They can be activated by an endocrine-synthesized ligand that entered the cell by diffusion, a ligand synthesised from a precursor like retinol brought to the cell through the bloodstream or a completely intracellularly synthesised ligand like prostaglandin. These receptors are located in the nucleus and are not accompanied by HSPs; they repress their gene by binding to their specific DNA sequence when no ligand binds to them, and vice versa.

Certain intracellular receptors of the immune system are cytoplasmic receptors; recently identified NOD-like receptors (NLRs) reside in the cytoplasm of some eukaryotic cells and interact with ligands using a leucine-rich repeat (LRR) motif similar to TLRs. Some of these molecules like NOD2 interact with RIP2 kinase that activates NF-κB signaling, whereas others like NALP3 interact with inflammatory caspases and initiate processing of particular cytokines like interleukin-1β.[38][39]


Cell signaling

signaling pathjways map

signaling pathjways map

Cell signalling is part of a complex system of communication that governs basic cellular activities and coordinates cell actions. The ability of cells to perceive and correctly respond to their microenvironment is the basis of development, tissue repair, and immunity as well as normal tissue homeostasis. Errors in cellular information processing are responsible for diseases such as cancer, autoimmunity, and diabetes. By understanding cell signalling, diseases may be treated effectively and, theoretically, artificial tissues may be created.

Traditional work in biology has focused on studying individual parts of cell signaling pathways. Systems biology research helps us to understand the underlying structure of cell signaling networks and how changes in these networks may affect the transmission and flow of information. Such networks are complex systems in their organization and may exhibit a number of emergent properties. Long-range allostery is often a significant component of cell signaling events.[1]

Enzyme_Model allosterism

Enzyme_Model allosterism

Classification

Signaling within, between, and among cells is subdivided into the following classifications:

  • Intracrine signals are produced by the target cell that stay within the target cell.
  • Autocrine signals are produced by the target cell, are secreted, and effect the target cell itself via receptors. Sometimes autocrine cells can target cells close by if they are the same type of cell as the emitting cell. An example of this are immune cells.
  • Juxtacrine signals target adjacent (touching) cells. These signals are transmitted along cell membranes via protein or lipid components integral to the membrane and are capable of affecting either the emitting cell or cells immediately adjacent.
transepithelial-electrogenic-ion-transport

transepithelial-electrogenic-ion-transport

calcium release calmodulin + ER

calcium release calmodulin + ER


Ca++ exchange

Ca++ exchange

Paracrine bidirectional cardiac fibroblast-myocyte crosstalk

Paracrine bidirectional cardiac fibroblast-myocyte crosstalk

  • Paracrine signals target cells in the vicinity of the emitting cell. Neurotransmitters represent an example.
  • Endocrine signals target distant cells. Endocrine cells produce hormones that travel through the blood to reach all parts of the body.
Notch-mediated juxtacrine signal between adjacent cells.

Notch-mediated juxtacrine signal between adjacent cells.


Notch-mediated juxtacrine signal between adjacent cells.

Some cell–cell communication requires direct cell–cell contact. Some cells can form gap junctions that connect their cytoplasm to the cytoplasm of adjacent cells. In cardiac muscle, gap junctions between adjacent cells allows for action potential propagation from the cardiac pacemaker region of the heart to spread and coordinately cause contraction of the heart.

The notch signaling mechanism is an example of juxtacrine signaling (also known as contact-dependent signaling) in which two adjacent cells must make physical contact in order to communicate. This requirement for direct contact allows for very precise control of cell differentiation during embryonic development. In the worm Caenorhabditis elegans, two cells of the developing gonad each have an equal chance of terminally differentiating or becoming a uterine precursor cell that continues to divide. The choice of which cell continues to divide is controlled by competition of cell surface signals. One cell will happen to produce more of a cell surface protein that activates the Notch receptor on the adjacent cell. This activates a feedback loop or system that reduces Notch expression in the cell that will differentiate and that increases Notch on the surface of the cell that continues as a stem cell.[5]

Many cell signals are carried by molecules that are released by one cell and move to make contact with another cell. Endocrine signals are called hormones. Hormones are produced by endocrine cells and they travel through the blood to reach all parts of the body. Specificity of signaling can be controlled if only some cells can respond to a particular hormone. Paracrine signals such as retinoic acid target only cells in the vicinity of the emitting cell.[6] Neurotransmitters represent another example of a paracrine signal. Some signaling molecules can function as both a hormone and a neurotransmitter. For example, epinephrine and norepinephrine can function as hormones when released from the adrenal gland and are transported to the heart by way of the blood stream. Norepinephrine can also be produced by neurons to function as a neurotransmitter within the brain.[7] Estrogen can be released by the ovary and function as a hormone or act locally via paracrine or autocrine signaling.[8] Active species of oxygen and nitric oxide can also act as cellular messengers. This process is dubbed redox signaling.

Signaling Pathways

Cell Signaling Biology

Michael J. Berridge

Module 2

Cell Signaling Pathways
The nine membrane-bound adenylyl cyclases (AC1–AC9) have a similar domain structure. The single polypeptide has a tandem repeat of six transmembrane domains (TM) with TM1- -TM6 in one repeat and TM7- -TM12 in the other. Each TM cassette is followed by large cytoplasmic domains (C1 and C2), which contain the catalytic regions that convert ATP into cyclic AMP. As shown in the lower panel, the C1 and C2 domains come together to form a heterodimer. The ATP-binding site is located at the interface between these two domains. The soluble AC10 isoform lacks the transmembrane regions, but it retains the C1 and C2 domains that are responsible for catalysis
www.cellsignallingbiology.org  http://www.biochemj.org/csb/002/csb002.pdf


Resources:

Elucidate Target-Specific Pathways With a Suite of Cellular Assays

DiscoveRx® offers a comprehensive collection of cell-based pathway indicator assays designed to detect activation or inhibition of complex signal transduction pathways in response to compound treatment. Based on the proven PathHunter® technology, These biosensor cell lines allow you to measure distinct events within a variety of pathways involved in compound toxicity, cholesterol metabolism, antioxidant function, DNA damage and ER stress. In combination with our biosensor cell lines with fast and simple chemiluminescent detection, DiscoveRx Pathway Signaling assays will help you generate cellular pathway selectivity profiles of your compounds without relying on reporter gene assays or complex phenotypic screens. – See more at: http://www.discoverx.com/targets/signaling-pathways?gclid=CPPrxrrli8ACFSdp7AodO2IADQ#sthash.OhK3iKl4.dpuf

  GPCR Targets ,   Kinase Targets ,   Nuclear Receptors ,   Protease Targets ,   Epigenetic Targets ,   Signaling Pathways –  See more at: http://www.discoverx.com/targets#sthash.KjwWEjjx.dpuf

DiscoveRx® offers a comprehensive collection of cell-based pathway indicator assays designed to detect activation or inhibition of complex signal transduction pathways in response to compound treatment. Based on the proven PathHunter® technology, These biosensor cell lines allow you to measure distinct events within a variety of pathways involved in compound toxicity, cholesterol metabolism, antioxidant function, DNA damage and ER stress. – See more at: http://www.discoverx.com/targets/signaling-pathways#sthash.ZTb5UXVO.dpuf


inhibitors of signal transduction pathway

inhibitors of signal transduction pathway

Inhibitors of MAPK Signaling Pathway

Inhibitors of MAPK Signaling Pathway


jak-stat

jak-stat


Nrf2 signaling in ARE-mediated coordinated activation of defensive genes

Nrf2 signaling in ARE-mediated coordinated activation of defensive genes


Regulation of AMPK

Regulation of AMPK


metabolic pathways

metabolic pathways


On these resource pages you can find signaling pathway diagrams, research overviews, relevant antibody products, publications, and other research resources organized by topic. The pathway diagrams associated with these topics have been assembled by CST scientists and outside experts to provide succinct and current overviews of selected signaling pathways. Please send suggestions for developing new pathways to info@cellsignal.com. Protein nodes in each pathway diagram are linked to specific antibody product information or, optionally, to protein-specific listings in the PhosphoSitePlus® database of post-translational modifications.

http://www.cellsignal.com/common/content/content.jsp?id=science-pathways
http://www.cellsignal.com/common/content/content.jsp?id=pathways-akt-signaling
http://www.cellsignal.com/common/content/content.jsp?id=pathways-mtor-signaling

PI3K / Akt Signaling Overview

 The serine/threonine kinase Akt/PKB exists as three isoforms in mammals. Akt1 has a wide tissue distribution, whereas Akt2 is found predominantly in muscle and fat cells and Akt3 is expressed in testes and brain. Akt regulates multiple biological processes including cell survival, proliferation, growth, and glycogen metabolism. Various growth factors, hormones, and cytokines activate Akt by binding their cognate receptor tyrosine kinase (RTK), cytokine receptor, or GPCR and triggering activation of the lipid kinase PI3K, which generates PIP3 at the plasma membrane. Akt binds PIP3 through its pleckstrin homology (PH) domain, resulting in translocation of Akt to the membrane. Akt is activated through a dual phosphorylation mechanism. PDK1, which is also brought to the membrane through its PH domain, phosphorylates Akt within its activation loop at Thr308. A second phosphorylation at Ser473 within the carboxy terminus is also required for activity and is carried out by the mTOR-rictor complex, mTORC2.

PTEN, a lipid phosphatase that catalyzes the dephosphorylation of PIP3, is a major negative regulator of Akt signaling. Loss of PTEN function has been implicated in many human cancers. Akt activity is also negatively regulated by the phosphatases PP2A and PHLPP, as well as by the chemical modulators wortmannin and LY294002, both of which are inhibitors of PI3K.

Activated Akt phosphorylates a large number of downstream substrates containing the consensus sequence RXRXXS/T. One of its primary functions is to promote cell growth and protein synthesis through regulation of the mTOR signaling pathway. Akt directly phosphorylates and activates mTOR, as well as inhibits the mTOR inhibitor proteins PRAS40 and tuberin (TSC2). Combined, these actions promote cell growth and G1 cell cycle progression through signaling via p70 S6 Kinase and inhibition of 4E-BP1.

Phosphofructokinase mechanism

Phosphofructokinase mechanism

GSK-3 is a primary target of Akt and inhibitory phosphorylation of GSK-3α (Ser21) or GSK-3β (Ser9) has numerous cellular effects such as promoting glycogen metabolism, cell cycle progression, regulation of wnt signaling, and formation of neurofibrillary tangles in Alzheimers disease. Akt promotes cell survival directly by its ability to phosphorylate and inactivate several pro-apoptotic targets, including Bad, Bim, Bax, and the forkhead (FoxO1/3a) transcription factors. Akt also plays an important role in metabolism and insulin signaling. Insulin receptor signaling through Akt promotes Glut4 translocation through activation of AS160 and TBC1D1, resulting in increased glucose uptake. Akt regulates glycolysis through phosphorylation of PFK and hexokinase, and plays a significant role in aerobic glycolysis of cancer cells, also known as the Warburg Effect.

Aberrant Akt signaling is the underlying defect found in several pathologies. Akt is one of the most frequently activated kinases in human cancer as constitutively active Akt can promote unregulated cell proliferation. Abnormalities in Akt2 signaling can result in diabetes due to defects in glucose homeostasis. Akt is also a key player in cardiovascular disease through its role in cardiac growth, angiogenesis, and hypertrophy.

References

  1. Robey RB, Hay N (2009) Is Akt the “Warburg kinase”?-Akt-energy metabolism interactions and oncogenesis. Cancer Biol. 19(1), 25–31.
  2. Zhang S, Yu D (2010) PI(3)king apart PTEN’s role in cancer. Cancer Res. 16(17), 4325–30.
  3. Zoncu R, Efeyan A, Sabatini DM (2011) mTOR: from growth signal integration to cancer, diabetes and ageing. Rev. Mol. Cell Biol. 12(1), 21–35.
  4. Zhang X, Tang N, Hadden TJ, Rishi AK (2011) Akt, FoxO and regulation of apoptosis. Biophys. Acta 1813(11), 1978–86.
  5. Kloet DE, Burgering BM (2011) The PKB/FOXO switch in aging and cancer. Biophys. Acta 1813(11), 1926–37.
  6. Hers I, Vincent EE, Tavars JM (2011) Akt signalling in health and disease. Signal. 23(10), 1515–27.
  7. Wang H, Zhang Q, Wen Q, Zheng Y, Lazarovici P, Philip L, Jiang H, Lin J, Zheng W (2012) Proline-rich Akt substrate of 40kDa (PRAS40): a novel downstream target of PI3k/Akt signaling pathway. Signal. 24(1), 17–24.
  8. Dazert E, Hall MN (2011) mTOR signaling in disease. Opin. Cell Biol. 23(6), 744–55.
  9. Bayley JP, Devilee P (2012) The Warburg effect in 2012. Curr Opin Oncol 24(1), 62–7.


mTOR Signaling Pathway

Akt mTOR pathway

Akt mTOR pathway

The mammalian target of rapamycin (mTOR) is an atypical serine/threonine kinase that is present in two distinct complexes. mTOR complex 1 (mTORC1) is composed of mTOR, Raptor, GβL (mLST8), and Deptor and is partially inhibited by rapamycin. mTORC1 integrates multiple signals reflecting the availability of growth factors, nutrients, or energy to promote either cellular growth when conditions are favorable or catabolic processes during stress or when conditions are unfavorable. Growth factors and hormones (e.g. insulin) signal to mTORC1 via Akt, which inactivates TSC2 to prevent inhibition of mTORC1. Alternatively, low ATP levels lead to the AMPK-dependent activation of TSC2 and phosphorylation of raptor to reduce mTORC1 signaling. Amino acid availability is signaled to mTORC1 via a pathway involving the Rag and Ragulator (LAMTOR1-3) proteins. Active mTORC1 has a number of downstream biological effects including translation of mRNA via the phosphorylation of downstream targets (4E-BP1 and p70 S6 Kinase), suppression of autophagy (Atg13, ULK1), ribosome biogenesis, and activation of transcription leading to mitochondrial metabolism or adipogenesis. The mTOR complex 2 (mTORC2) is composed of mTOR, Rictor, GβL, Sin1, PRR5/Protor-1, and Deptor and promotes cellular survival by activating Akt. mTORC2 also regulates cytoskeletal dynamics by activating PKCα and regulates ion transport and growth via SGK1 phosphorylation. Aberrant mTOR signaling is involved in many disease states including cancer, cardiovascular disease, and metabolic disorders.

Selected Reviews:

We would like to thank Carson Thoreen and Prof. David Sabatini, Whitehead Institute for Biomedical Research, MIT, Cambridge, MA, for reviewing this diagram. revised November 2012

Protein Folding


conformational-rearrangements

conformational-rearrangements

Pincer movement of Hsp90 coupled to the ATPase cycle. NTD = N-terminal domain, MD = middle domain, CTD = C-terminal domain.

Pincer movement of Hsp90 coupled to the ATPase cycle. NTD = N-terminal domain, MD = middle domain, CTD = C-terminal domain.


Heat Shock Proteins (HSPs) form seven families (small HSPs (sHSPs), HSP10, 40, 60, 70, 90, and 100) of molecular chaperone proteins that play a central role in the cellular resistance to stress and actin organization. They are involved in the proper folding of proteins and the recognition and refolding of misfolded proteins. HSP expression is induced by a variety of environmental stresses, including heat, hypoxia, nutrient deficiency, free radicals, toxins, ischemia, and UV radiation. HSP27 is a member of the sHSP family. It is phosphorylated at Ser15, Ser78, and Ser82 by MAPKAPK-2 as a result of the activation of the p38 MAP kinase pathway. Phosphorylation and increased concentration of HSP27 has been implicated in actin polymerization and reorganization. HSP70 and HSP90 interact with unfolded proteins to prevent irreversible aggregation and catalyze the refolding of their substrates in an ATP- and co-chaperone-dependent manner. HSP70 has a broad range of substrates including newly synthesized and denatured proteins, while HSP90 tends to have a more limited subset of substrates, most of which are signaling molecules. HSP70 and HSP90 are also essential for the maturation and inactivation of nuclear hormones and other signaling molecules.

References

  1. Stenmark H (2009) Rab GTPases as coordinators of vesicle traffic. Rev. Mol. Cell Biol. 10(8), 513–25.
  2. Horgan CP, McCaffrey MW (2009) The dynamic Rab11-FIPs. Soc. Trans. 37(Pt 5), 1032–6.
  3. Evans CG, Chang L, Gestwicki JE (2010) Heat shock protein 70 (hsp70) as an emerging drug target. Med. Chem. 53(12), 4585–602.
  4. Lanneau D, Wettstein G, Bonniaud P, Garrido C (2010) Heat shock proteins: cell protection through protein triage. ScientificWorldJournal 10, 1543–52.
  5. Ghayour-Mobarhan M, Saber H, Ferns GA (2012) The potential role of heat shock protein 27 in cardiovascular disease. Chim. Acta 413(1-2), 15–24.
  6. Horgan CP, McCaffrey MW (2011) Rab GTPases and microtubule motors. Soc. Trans. 39(5), 1202–6.
  7. Stenmark H (2009) Rab GTPases as coordinators of vesicle traffic. Rev. Mol. Cell Biol. 10(8), 513–25.
  8. Horgan CP, McCaffrey MW (2009) The dynamic Rab11-FIPs. Soc. Trans. 37(Pt 5), 1032–6.
  9. Evans CG, Chang L, Gestwicki JE (2010) Heat shock protein 70 (hsp70) as an emerging drug target. Med. Chem. 53(12), 4585–602.
  10. Lanneau D, Wettstein G, Bonniaud P, Garrido C (2010) Heat shock proteins: cell protection through protein triage. ScientificWorldJournal 10, 1543–52.
  11. Ghayour-Mobarhan M, Saber H, Ferns GA (2012) The potential role of heat shock protein 27 in cardiovascular disease. Chim. Acta 413(1-2), 15–24.
  12. Horgan CP, McCaffrey MW (2011) Rab GTPases and microtubule motors. Soc. Trans. 39(5), 1202–6

– See more at: http://www.cellsignal.com/common/content/content.jsp?id=protein-folding#sthash.xAfeElH1.dpuf


Read Full Post »

The role and importance of transcription factors

Larry H. Bernstein, MD, FCAP, Writer and Curator

http://pharmaceuticalintelligence.com/2014/8/05/The-role-and-importance-of-transcripton-factors

The following is a second in the 2nd series that is focused on the topic of the impact of genomics and transcriptomics in the evolution of 21st century of medicine, which shall have to be more efficient and more effective by the end of this decade, if the prediction for the funding of Medicare is expected to run out. Even so, Social Security was devised by none other than the Otto von Bismarck, who unified Germany, and United Kingdom has had a charity hospital care system begun to protect the widows of the ravages of war, and nursing was developed by Florence Nightengale as a result of the experience of war. It can only be concluded that the care for the elderly, the infirm, and those who have little resources to live on has a long history in western civilization, and it will not cease to exist as a public social obligation anytime soon. The 20th century saw an explosive development of physics; organic, inorganic, biochemistry, and medicinal chemistry, and the elucidation of the genetic code and its mechanism of translation in plants, microorganisms, and eukaryotes.  All of which occurred irrespective of the most horrendous wars that have reshaped the world map.

The following are the second portions of a puzzle in construction that is intended to move into deeper complexities introduced by proteomics, cell metabolism, metabolomics, and signaling.  This is the only manner by which I can begin to appreciate what a wonder it is to view and live in this world with all its imperfections.

We have already visited the transcription process, by which an RNA sequence is read.  This is essential for protein synthesis through the ordering of the amino acids in the primary structure. However, there are microRNAs and noncoding RNAs, and there are transcription factors.  The transcription factors bind to chromatin, and the RNAs also have some role in regulating the transcription process. We shall examine this further.

  1. RNA and the transcription the genetic code

Larry H. Bernstein, MD, FCAP, Writer and Curator
http://pharmaceuticalintelligence.com/2014/08/02/rna-and-the-transcription-of-the-genetic-code/

  1. The role and importance of transcription factors?
    Larry H. Bernstein, MD, FCAP, Writer and Curator
    http://pharmaceuticalintelligence.com/2014/8/05/What-is-the-meaning-of-so-many-RNAs
  2. What is the meaning of so many RNAs?

Larry H. Bernstein, MD, FCAP, Writer and Curator
http://pharmaceuticalintelligence.com/2014/8/05/What-is-the-meaning-of-so-many-RNAs

  1. Pathology Emergence in the 21st Century
    Larry Bernstein, MD, FCAP, Author and Curator
    http://pharmaceuticalintelligence.com/2014/08/03/pathology-emergence-in-the-21st-century/
  2. The Arnold Relman Challenge: US HealthCare Costs vs US HealthCare Outcomes

Larry H. Bernstein, MD, FCAP, Reviewer and Curator; and
Aviva Lev-Ari, PhD, RN, Curator
http://pharmaceuticalintelligence.com/2014/08/05/the-relman-challenge/


Quantifying transcription factor kinetics: At work or at play?

Posted online on September 11, 2013. (doi:10.3109/10409238.2013.833891)

Florian Mueller1,2, Timothy J. Stasevich3, Davide Mazza4, and James G. McNally5
1Institut Pasteur, Computational Imaging and Modeling Unit, CNRS, Paris, Fr
2Functional Imaging of Transcription, Institut de Biologie de l’Ecole Normale Supérieure, Paris, Fr
3Graduate School of Frontier Biosciences, Osaka University, Osaka, Jp
4Istituto Scientifico Ospedale San Raffaele, Centro di Imaging Sperimentale e Università Vita-Salute
San Raffaele, Milano, It, and
5Fluorescence Imaging Group, National Cancer Institute, NIH, Bethesda, MD, USA

Read More: http://informahealthcare.com/doi/abs/10.3109/10409238.2013.833891?goback=%2Egde_3795224_member_273907669#%2EUjYZ8jMt8mo%2Elinkedin

Abstract

Transcription factors (TFs) interact dynamically in vivo with chromatin binding sites. Here we summarize and compare the four different techniques that are currently used to measure these kinetics in live cells, namely fluorescence recovery after photobleaching (FRAP), fluorescence correlation spectroscopy (FCS), single molecule tracking (SMT) and competition ChIP (CC). We highlight the principles underlying each of these approaches as well as their advantages and disadvantages. A comparison of data from each of these techniques raises an important question: do measured transcription kinetics reflect biologically functional interactions at specific sites (i.e. working TFs) or do they reflect non-specific interactions (i.e. playing TFs)? To help resolve this dilemma we discuss five key unresolved biological questions related to the functionality of transient and prolonged binding events at both specific promoter response elements as well as non-specific sites. In support of functionality, we review data suggesting that TF residence times are tightly regulated, and that this regulation modulates transcriptional output at single genes. We argue that in addition to this site-specific regulatory role, TF residence times also determine the fraction of promoter targets occupied within a cell thereby impacting the functional status of cellular gene networks. Thus, TF residence times are key parameters that could influence transcription in multiple ways.

Keywords: Competition-ChIP, kinetic modeling, live-cell imaging, non-specific binding, specific binding, transcription, transcription factor dynamics http://informahealthcare.com/doi/abs/10.3109/10409238.2013.833891?goback=%2Egde_3795224_member_273907669#%2EUjYZ8jMt8mo%2Elinkedin

The Transcription Factor Titration Effect Dictates Level of Gene ExpressionCalifornia Institute of Technology

Robert C. Brewster, Franz M. Weinert, Hernan G. Garcia, Dan Song, Mattias Rydenfelt, and Rob Phillips  CalTech
 Cell Mar 13, 2014; 156:1312–1323,.

Models of transcription are often built around a picture of RNA polymerase and transcription factors (TFs) acting on a single copy of a promoter. However, most TFs are shared between multiple genes with varying binding affinities. Beyond that, genes often exist at high copy number—in multiple identical copies on the chromosome or on plasmids or viral vectors with copy numbers in the hundreds. Using a thermodynamic model, we characterize the interplay between TF copy number and the demand for that TF. We demonstrate the parameter-free predictive power of this model as a function of the copy number of the TF and the number and affinities of the available specific binding sites; such predictive control is important for the understanding of transcription and the desire to quantitatively design the output of genetic circuits. Finally, we use these experiments to dynamically measure plasmid copy number through the cell cycle.


Optimal reference genes for normalization of qRT-PCR data from archival formalin-fixed, paraffin-embedded breast tumors controlling for tumor cell content and decay of mRNA.

Tramm T, Sørensen BS, Overgaard J, Alsner J.

Diagn Mol Pathol. 2013 Sep;22(3):181-7. http://dx.doi.org:/10.1097/PDM.0b013e318285651e

Gene-expression analysis is increasingly performed on degraded mRNA from formalin-fixed, paraffin-embedded tissue (FFPE), giving the option of examining retrospective cohorts. The aim of this study was to select robust reference genes showing stable expression over time in FFPE, controlling for various content of tumor tissue and decay of mRNA because of variable length of storage of the tissue.

Sixteen reference genes were quantified by qRT-PCR in 40 FFPE breast tumor samples, stored for 1 to 29 years. Samples included 2 benign lesions and 38 carcinomas with varying tumor content. Stability of the reference genes were determined by the geNorm algorithm. mRNA was successfully extracted from all samples, and the 16 genes quantified in the majority of samples.

Results showed 14% loss of amplifiable mRNA per year, corresponding to a half-life of 4.6 years. The 4 most stable expressed genes were CALM2, RPL37A, ACTB, and RPLP0. Several of the other examined genes showed considerably instability over time (GAPDH, PSMC4, OAZ1, IPO8).

In conclusion, we identified 4 genes robustly expressed over time and independent of neoplastic tissue content in the FFPE block.   PMID:23846446


Structures of Cas9 Endonucleases Reveal RNA-Mediated Conformational Activation

Martin Jinek1,*,†, Fuguo Jiang2,*, David W. Taylor3,4,*, Samuel H. Sternberg5,*, Emine Kaya2, et al.


1Department of Biochemistry, University of Zurich, CH-8057 Zurich, Switzerland. 2Department of Molecular and Cell Biology,3Howard Hughes Medical Institute, 4California Institute for Quantitative Biosciences, 5Department of Chemistry, 6Physical Biosciences Division, Lawrence Berkeley National Laboratory, Berkeley, CA 94720,. 7The Laboratory for Molecular Infection Medicine Sweden, Umeå University, Umeå S-90187, Sweden. 8Helmholtz Centre for Infection Research, Department of Regulation in Infection Biology, D-38124 Braunschweig, Germany. 9Hannover Medical School, D-30625 Hannover, Germany. 10Life Sciences Division, Lawrence Berkeley National Laboratory, Berkeley, CA 94720.

↵‡ Present address: Friedrich Miescher Institute for Biomedical Research, Maulbeerstrasse 66 CH-4058 Basel, Switzerland.

↵§ Present address: Department of Agricultural and Biological Engineering, University of Florida, Gainesville, FL 32611, USA.


Science  http://dx.doi.org:/10.1126/science.1247997


Type II CRISPR-Cas systems use an RNA-guided DNA endonuclease, Cas9,

  • to generate double-strand breaks in invasive DNA during an adaptive bacterial immune response.

Cas9 has been harnessed as a powerful tool for genome editing and gene regulation in many eukaryotic organisms.

Here, we report 2.6 and 2.2 Å resolution crystal structures of two major Cas9 enzymes subtypes,

  • revealing the structural core shared by all Cas9 family members.

The architectures of Cas9 enzymes define nucleic acid binding clefts, and

single-particle electron microscopy reconstructions show that the two structural lobes harboring these clefts undergo guide

  • RNA-induced reorientation to form a central channel where DNA substrates are bound.

The observation that extensive structural rearrangements occur before target DNA duplex binding

  • implicates guide RNA loading as a key step in Cas9 activation.

MicroRNA function in endothelial cells
Dr. Virginie Mattot
Angiogenesis, endothelium activation
Solving the mystery of an unknown target gene using microRNA Target Site Blockers

Dr. Virgine Mattot works in the team “Angiogenesis, endothelium activation and Cancer” directed by Dr. Fabrice Soncin at the Institut de Biologie de Lille in France where she studies the roles played by microRNAs in endothelial cells during physiological and pathological processes such as angiogenesis or endothelium activation. She has been using Target Site Blockers to investigate the role of microRNAs on putative targets which functions are yet unknown.

What is the main focus of the research conducted in your lab?

We are studying endothelial cell functions with a particular interest in angiogenesis and endothelium activation during physiological and tumoral vascular development.

How did your research lead to the study of microRNAs?

A few years ago, we identified

  • an endothelial cell-specific gene which
  • harbors a microRNA in its intronic sequence.

We have since been working on understanding the functions of

  • both this new gene and its intronic microRNA in endothelial cells.

What is the aim of your current project?

While we were searching for the functions of the intronic microRNA,

  • we identified an unknown gene as a putative target.

The aim of my project was to investigate if this unknown gene was actually a genuine target and if regulation of this gene by the microRNA was involved in endothelial cell function. We had already characterized the endothelial cell phenotype associated with the inhibition of our intronic microRNA. We then used miRCURY LNA™ Target Site Blockers to demonstrate

  • the expression of this unknown gene is actually controlled by this microRNA.
  • the microRNA regulates specific endothelial cell properties through regulation of this unknown gene.

How did you perform the experiments and analyze the results?

LNA™ enhanced target site blockers (TSB) for our microRNA were designed by Exiqon. We

  • transfected the TSBs into endothelial cells using our standard procedure and
  • analysed the induced phenotype.

As a control for these experiments, a mutated version of the TSB was designed by Exiqon and transfected into endothelial cells. We first verified that this TSB was functional by analyzing

  • the expression of the miRNA target against which the TSB was directed
  • we then showed the TSB induced similar phenotypes as those when we inhibited the microRNA in the same cells.

What do you find to be the main benefits/advantage of the LNA™ microRNA target site blockers from Exiqon?

Target Site Blockers are efficient tools to demonstrate the specific involvement of

  • putative microRNA targets in the function played by this microRNA.

What would be your advice to colleagues about getting started with microRNA functional analysis?

  • it is essential to perform both gain and loss of functions experiments.

 Changing the core of transcription

Different members of the TAF family of proteins work in differentiated cells, such as motor neurons or brown fat cells, to control the expression of genes that are specific to each cell type.

Katherine A Jones
Jones. eLife 2014;3:e03575. http://dx.doi.org:/10.7554/eLife.03575


Related research articles: Herrera FJ, Yamaguchi T, Roelink H, Tjian R. 2014. Core promoter factor TAF9B regulates neuronal gene expression. eLife 3:e02559. http://dx.doi.org:/10.7554eLife.02559

Zhou H, Wan B, Grubisic I, Kaplan T, Tjian R. 2014. TAF7L modulates brown adipose tissue formation. eLife 3:e02811. Http://dx.doi.org:/10.7554/eLife.02811


Motor neurons (green) being grown in vitro

Motor neurons (green) being grown in vitro

Image Motor neurons (green) being grown in vitro


In a developing organism, different genes are expressed at different times


  • the pattern of gene expression can often change abruptly.


Expressing a gene involves multiple steps:


  • the DNA must be transcribed into a molecule of messenger RNA,
  • which is then trans­lated into a protein.


The mechanisms that start the transcription of protein-coding genes in rap­idly growing cells are reasonably well understood: two types of proteins—


  • DNA-binding activators and general transcription factors—


cooperate to recruit an enzyme called RNA polymerase, which then transcribes the gene (Kadonaga, 2012).


These proteins bind to a region of the gene called the promoter, which is


  • upstream from the protein-coding region of the gene.


TATA-binding protein is a general transcrip­tion factor that

  • binds to certain sequences of DNA bases found within promoters

14 TATA-binding protein associated factors (TAFs) are included into two different protein complexes called TFIID and SAGA (Müller et al., 2010). which, in budding yeast, can recruit TATA-binding protein to gene promoters (Basehoar et al., 2004), but not all genes require all of the general transcription factors, and some genes require both TFIID and SAGA complexes.

Although the steps that are required to switch on genes when cells are rapidly dividing are fairly well known,

  • the same is not true for cells that are differentiating into specialised cell types.

In these cells, many transcription factors are downregulated and

  • the entire pattern of gene expression changes dramatically.

Moreover, certain TAFs are strongly up-regulated during differentiation. The core transcriptional machinery is essentially rebuilt at the genes that are expressed in differentiated cells.

Over the years Robert Tjian of the University of California Berkeley and co-workers have illu­minated how individual TAFs can affect how a cell differentiates in different contexts (Figure 1). Now, in eLife, Francisco Herrera of UC Berkeley and co-workers—including Teppei Yamaguchi, Henk Roelink and Tjian—have identified a critical role for a TAF called TAF9B in the expression of genes in motor neurons (Herrera et al., 2014).

Herrera et al. found that TAF9B predominantly associates with the SAGA complex, rather than the TFIID complex, in the motor neuron cells. Mice in which the gene for TAF9B had been deleted had less neuronal tissue in the developing spinal cord. Moreover, the genes that are involved in forming the branches of neurons were not properly regu¬lated in these mice.

Recently, in another eLife paper, Tjian and co-workers at Berkeley, Fudan University and the Hebrew University of Jerusalem—including Haiying Zhou as first author, Bo Wan, Ivan Grubisic and Tommy Kaplan—reported that another TAF protein, called TAF7L, works as part of the TFIID complex to up-regulate genes that direct cells to become brown adipose tissue (Zhou et al., 2014).


TATA-binding protein associated factors

TATA-binding protein associated factors

Figure 1. TATA-binding protein associated factors (TAFs) regulate transcription in specific cell types. TAF3, for example, works with another transcription factor to regulate the expression of genes that are critical for the differentiation of the endoderm in the early embryo (Liu et al., 2011). TAF3 also forms a complex with the TATA-related factor, TRF3, to regulate Myogenin and other muscle-specific genes to form myotubes (Deato et al., 2008). TAF7L interacts with another transcription factor to activate genes involved in the formation of adipocytes (‘fat cells’) and adipose tissue (Zhou et al., 2013; Zhou et al., 2014). Finally, TAF9B is a key regulator of transcription in motor neurons (Herrera et al., 2014). The names of some of the genes regulated by the TAFs are shown in brackets.

TAF9B

Deleting the gene for TAF9B in mouse embryonic stem cells revealed that this TAF

  • is not needed for the growth of stem cells, or
  • required for the expression of genes that prevent differentiation:

both of these processes are known to be highly-dependent upon the TFIID complex
(Pijnappel et al., 2013). However,

  • genes that would normally be expressed specifically in neurons were not
  • up-regulated when cells without the TAF9B gene started to specialise.

Herrera et al. identified numerous genes that can only be switched on when the TAF9B protein is present, which means that it joins a growing list of TAF proteins that are dedicated to controllingthe expression of genes in specialised cell types.

TAF9B activates neuron-specific genes by binding to sites that

  • reside outside of these genes’ core promoters.

Further, many of these sites were also bound by a master regulator of motor neuron-specific genes.

TAF7L


Whilst most of the fat tissue in humans is white adipose tissue, which contains cells that store fatty molecules, some is brown adipose tissue, or ‘brown fat’, that instead generates heat. When TAF7L promotes the differentiation of brown fat, it up-regulates genes that are targeted by a tran­scription

factor called PPAR-γ; last year it was shown that this transcription factor also promotes the differentiation of white adipose tissue (Zhou et al., 2013).
Mice without the TAF7L gene had 40% less brown fat than wild-type mice, and also grew too much skeletal muscle tissue. TAF7L was specifi­cally required to activate genes that control how brown fat develops and functions. Thus TAF7L expression appears to shift the fate of a stem cell towards brown adipose tissue, potentially at the expense of skeletal muscle, as both cell types develop from the same group of stem cells.

When stem cells with less TAF7L than normal are differentiated in vitro, they yield more muscle than fat cells. Conversely, cells with an excess of TAF7L express brown fat-specific genes and switch off muscle-specific genes.

The work of Herrera et al. and Zhou et al. reinforces the idea that different TAFs

  • provide the flexibility needed to control gene expression in a tissue-specific manner, and
  • enable differenti­ating cells to change which genes they express rapidly.

However many interesting questions remain:

Which signals lead to the destruction of core transcription factors?
Are core promoter ele­ments at tissue-specific genes designed to rec­ognise variant TAFs?
What determines whether variant TAFs are incorporated within TFIID, SAGA, or other complexes?

Shortly after RNA polymerase II starts to tran­scribe a gene, it briefly pauses. Interestingly, a DNA sequence associated with this pausing, called the pause button, closely matches the sequences that bind to two subunits of TFIID (TAF6 and TAF9; Kadonaga, 2012). Consequently, TAF6 and TAF9 might be involved in pausing transcription, and if so, the variant TAF9B could play a similar role at motor neuron genes.

Molecular basis of transcription pausing

Jeffrey W. Roberts
Science 344, 1226 (2014);  http://dx.doi.org:/10.1126/science.1255712
http://www.sciencemag.org/content/344/6189/1226.full.html

During RNA synthesis, RNA polymerase moves erratically along DNA, frequently
resting as it produces an RNA copy of the DNA sequence. Such pausing helps coordinate the appearance of a transcript with its utilization by cellular processes; to this end,

  • the movement of RNA polymerase is modulated by mechanisms that determine its rate. For example,
  • pausing is critical to regulatory activities of the enzyme such as the termination of transcription. It is also
  • essential during early modifications of eukaryotic RNA polymerase II that activate the enzyme for elongation.


Two reports analyzing transcription pausing on a global scale in Escherichia coli, by Larson et al. ( 1) and by Vvedenskaya et al. ( 2) on page 1285 of this issue, suggest


  • new functions of pausing and important aspects of its molecular basis.


The studies of Larson et al. and Vvedenskaya et al. follow decades of analysis of

bacterial transcription that has illuminated the molecular basis of polymerase pausing

events that serve critical regulatory functions.


A transcription pause specified by the DNA sequence synchronizes the translation of RNA into protein


  • with the transcription of leader regions of operons (groups of genes transcribed together) for amino acid biosynthesis;


  • this coordination controls amino acid synthesis in response to amino acid availability ( 3).

A protein induced pause occurs when the E. coli initiation factor σ70 restrains RNA polymerase by binding a second occurrence of the “–10” promoter element.


This paused polymerase provides a structure for engaging a transcription antiterminator (the bacteriophage λ Q protein) ( 4) that, in turn, inhibits transcription

pauses, including those essential for transcription termination.


Biochemical and structural analyses have identified an endpoint of the pausing process called the “elemental pause” in which the catalytic structure in the active site is distorted,


  • preventing further nucleotide addition ( 7).


The elemental paused state also involves distinct


  • conformational changes in the polymerase that may favor transcription termination
  • and allow the his and related pauses to be stabilized by RNA hairpins ( 8).

A consensus sequence for ubiquitous pauses was identified, with two important elements:


  • a preference for pyrimidine [mostly cytosine (C)] at the newly formed RNA end
  • followed by G to be incorporated next—just as found for the his pause; and a preference for G at position –10 of the RNA (10 nucleotides before the 3’ end)


Polymerase, paused

Polymerase, paused

Polymerase, paused. During transcription, RNA exists in two states as RNA polymerase progresses: pretranslocated, just after the addition of the last nucleotide [here, cytosine (C)];

and posttranslocated, after all nucleic acids have shifted in register by one nucleotide relative

to the enzyme, exposing the active site for binding of the next substrate molecule [here, guanine (G)]. The pretranslocated state is dominant in the pause. The critical G-C base (RNA-DNA) pair at position –10 in the pretranslocated state and the nontemplate DNA strand G bound in the

polymerase in the posttranslocated state are marked with an asterisk.
Binding of G at position 􀀀1 to CRE only occurs in the posttranslocated state, which would thus

be favored over the pretranslocated state. Hence, if G binding inhibits pausing, then the rate-limiting paused structure must be in the pretranslocated state (a conclusion also made by Larson et al. from biochemical experiments).
This is an important insight into the sequence of protein–nucleic acid interactions that occur in pausing. Vvedenskaya et al. suggest that the actual role of the G binding site is to promote translocation and thus

inhibit pausing, to smooth out adventitious pauses in genomic DNA.
The studies by Larson et al. and Vvedenskaya et al. provide a refined and detailed analysis of DNA sequence–induced transcription pausing.
Processive Antitermination

Robert A. Weisberg1* and Max E. Gottesman2

Section on Microbial Genetics, Laboratory of Molecular Genetics, National Institute of Child Health and

Human Development, National Institutes of Health, Bethesda, Maryland 20892-2785,1 and

Institute of Cancer Research, Columbia University, New York, New York 100322

Journal Of Bacteriology, Jan. 1999; 181(2): 359–367.
After initiating synthesis of RNA at a promoter, RNA polymerase (RNAP) normally continues to elongate the transcript until it reaches a termination site. Important elements of termination sites are transcribed before polymerase translocation stops, and the resulting RNA is an active element of the termination pathway. Nascent transcripts of intrinsic sites can halt transcription without the assistance of additional factors, and

those of Rho-dependent sites recruit the Rho termination protein to the elongation complex. In both cases, RNAP, the transcript, and the template dissociate (reviewed in references 76 and 80).


Termination is rarely, if ever, completely efficient, and the expression of downstream genes can be controlled by altering the efficiency of terminator readthrough. Two distinct mechanisms of elongation control have been reported for bacterial RNA polymerases. In one, exemplified by attenuation of the his and trp operons of Salmonella typhimurium and Escherichia coli, respectively,

  • a single terminator is inactivated by interaction with an upstream sequence in the transcript, with a terminator-specific protein, or with a translating ribosome that follows closely behind RNAP (reviewed in references 35 and 104).

In a second, whose prototype is antitermination of phage l early transcription,

  • polymerase is stably modified to a terminator-resistant form after it leaves the promoter.

In this case, the modified enzyme not only transcribes through sequential downstream terminators,

  • but also it is less sensitive to the pause sites that normally delay transcript elongation.

Both pathways are widespread in nature, but in this minireview we consider only the second,

  • known as processive antitermination
    (for previous reviews, see references 22, 23, 27, and 32).

The recent explosive growth in our understanding of transcription elongation (reviewed in references 57, 96, and 99) make this an especially appropriate time to survey regulatory elements that target the transcription elongation complex.

Antitermination in l is induced by two quite distinct mechanisms.

  • the result of interaction between l N protein and its targets in the early phage transcripts,
  • an interaction between the l Q protein and its target in the late phage promoter.

We describe the N mechanism first. Lambda N, a small basic protein of the arginine- rich motif (ARM) (Fig. 1) family of RNA binding proteins, binds to a 15-nucleotide (nt) stem-loop called BOXB (17) (Fig. 2).


FIG. 1. [not shown] (A) Alignment of phage N proteins and the HK022 Nun protein. The color groupings reflect the frequency of amino acid substitutions in evolutionarily related protein domains: an amino acid is more likely to be replaced by one in the same color group than by one in a different color group in related proteins (34).

The amino-proximal ARM regions were aligned by eye and according to the structures of the P22 and l ARMs complexed to their cognate nut sites (see text and Fig. 2), and the remainder of the proteins was aligned by ClustalW (38). The dots indicate gaps introduced to improve the alignment. Aside from the ARM regions, the

proteins fall into three very distantly related (or unrelated) families: (i) l and phage 21; (ii) P22, phage L, and HK97; and (iii) HK022 Nun.


FIG. 2. [not shown] BOXA and BOXB RNAs and their interaction with the ARM of their cognate N proteins. The amino acid-nucleotide interactions are shown to the left except for BOXB of phage 21, for which the structure of the complex is unknown. The sequences of BOXA and BOXA-BOXB spacer are shown to the right. The dots

to the left and right of the spacer sequences are for alignment. (A) l N-ARM-BOXB complex (adapted from reference 48 with permission of the publisher). Open circles, pentagons, and rectangles represent phosphates, riboses, and bases, respectively. Watson-Crick base pairs (????) are indicated. The zigzag line denotes a sheared

G z A base pair. Open circles, open rectangles, and arrowheads depict ionic, hydrophobic, and hydrogen-bonding interactions, respectively. Guanine-11, indicated by a bold rectangle, is extruded from the BOXB loop (see text). (B) P22 N-ARM-BOXB complex (adapted from reference 15 with permission of the publisher). Open

circles, pentagons, rectangles, and ovals represent phosphates, riboses, bases, and amino acids, respectively. The solid pentagons indicate riboses with a C29-endo pucker.

Base stacking ( ), intermolecular hydrogen bonding or electrostatic interactions (,—–), intermolecular hydrophobic or van der Waals interactions (4), intramolecular hydrogen bonds (– – – –) and Watson-Crick base pairs (?????) are indicated. Cytosine-11 is extruded from the loop (see text). Note that the amino-terminal amino acid

residue in the complex corresponds to Asn-14 in the complete protein (Fig. 1), and the displayed amino acids are numbered accordingly. (C) NUTL site of phage 21. The arrows indicate the inverted sequence repeats of BOXB.


FIG. 3. [not skown] HK022 put sites and folded PUT RNAs. (A) Alignment of putL and putR (43). The numbers give distances from the start sites of the PL and PR promoters, respectively, and the pairs of arrows indicate inverted sequence repeats. (B) Folded PUTL and PUTR RNAs. The structures, which were generated by energy

minimization as described (43), have been partially confirmed by genetic and biochemical studies (7, 43).
The active bacterial elongation complex consists of

  • core RNAP,
  • template, and
  • RNA product.

The 39 end of the RNA

  • is engaged in the active site of the enzyme,
  • The following ;8 nt are hybridized to the template strand of the DNA, and
  • the next ;9 nt remain closely associated with RNAP (64).
  • About 17 nt of the nontemplate DNA strand are separated from the template strand in the transcription bubble.

Elongation complexes can also contain NusA and/or NusG. These proteins, which

  • increase the stability of the N-mediated antitermination complex (see above),
  • have different effects on elongation.
  • NusA decreases and NusG increases the elongation rate, and
  • both proteins alter termination efficiency in a terminator-specific manner (13, 14, 86; see reference 76).

An elongation complex, unless located at a terminator, is extraordinarily stable,

  • even when translocation is prevented by removal of substrates.

Recent observations suggest that this stability depends mainly on

  • interactions between RNAP and the RNA-DNA hybrid as well as
  • between polymerase and the downstream duplex DNA template (63, 87).

Nascent RNA emerging from the hybrid region and upstream duplex DNA

  • do not appear to be required.

The strength of the RNA-DNA hybrid is believed to

  • assure the lateral stability of the complex.


Reducing the strength of the RNA-DNA bonds, for example

  • by incorporation of nucleotide analogs,
  • favors backsliding of RNAP on the template, with consequent
  • disengagement of the 39 RNA end from the active site, and
  • concerted retreat of the RNA-DNA hybrid region from the 39 end (65).

Such a disengaged complex retains its resistance to dissociation and

  • is capable of resuming elongation if the original or a newly created 39 end reengages with the active site (10, 44, 45, 65, 71, 95).

Intrinsic terminators consist of a guanine- and cytosine-rich RNA hairpin stem

  • immediately followed by a short uracil-rich segment
  • within which termination can occur.


If termination does not occur at this point,

  • polymerase continues to elongate the transcript with normal processivity
  • until it reaches the next terminator.

Neither the stem nor the uracil-rich segment

  • is sufficient for termination, although
  • either can transiently slow elongation.

The weakness of base pairing between rU and dA

  • destabilizes the RNA-DNA hybrid in the uracil-rich segment, and
  • this probably contributes to termination.

Formation of the hairpin stem as nascent terminator RNA emerges from polymerase

  • destabilizes the RNA-DNA hybrid and
  • interrupts contacts between the emerging nascent RNA and RNAP (62a).

It might also interfere with the stabilizing interactions between

  • RNAP and the hybrid or those between RNAP and
  • the downstream region of the template.

Cross-linking of nucleic acid to RNAP suggests that

  • both the downstream DNA and the nascent RNA
  • that emerges from the hybrid region, and
  • within which the terminator hairpin might form,
  • are located close to the same regions of the enzyme (64).

Conversely, modifications that render RNAP termination resistant

  • could prevent the terminator stem from destabilizing one or more of these targets,
  • at least while the 39 end of the RNA is within the uracil rich segment of the terminator.

The l N and Q proteins and HK022 PUT RNA

  • also suppress Rho-dependent terminators (43a, 79, 103) which,
  • in contrast to intrinsic terminators, lack a precisely determined termination point.

Rho is an RNA-dependent ATPase that binds to cytosine-rich, unstructured regions in nascent RNA and acts preferentially

  • to terminate elongation complexes that are paused at nearby downstream sites
    (19, 29, 46, 47, 59, 60).

Rho possesses RNA-DNA helicase activity, and this activity is directional,

  • unwinding DNA paired to the 39 end of the RNA molecule (11, 90).
  • This corresponds to the location of the hybrid and of RNAP
    in an active ternary elongation complex.

The ability of antiterminators to suppress Rho-dependent and -independent terminators

  • suggests that they prevent a step that is common to both classes.

Given the helicase activity of Rho, a likely candidate for this step is disruption of the RNA-DNA

hybrid. However, other candidates, such as destabilization of RNAP-template or RNAP-hybrid interactions, are also plausible.

Alternatively, the ability of N, Q, and PUT to suppress RNAP pausing (31, 43, 54, 74)

  • suggests that they prevent Rho-dependent termination
  • by accelerating polymerase away from Rho bound at upstream RNA sites.

This explanation raises the problem of why NusG,

  • which also accelerates polymerase,
  • enhances rather than suppresses Rho-dependent termination (see above).

Clearly, the molecular details of processive antitermination remain poorly understood despite the 30 years that have elapsed since its discovery.


System wide analyses have underestimated protein abundances and the importance of transcription in mammals

OPEN ACCESS

Jingyi Jessica Li1, 2, Peter J Bickel1 and Mark D Biggin3

1Department of Statistics, University of California, Berkeley, CA, USA

2Departments of Statistics and Human Genetics, University of California, Los Angeles, CA, USA

3Genomics Division, Lawrence Berkeley National Laboratory, Berkeley, CA, USA

Academic editor – Barbara Engelhardt   http://dx.doi.org:/10.7717/peerj.270

Distributed under Creative-Commons CC-0

ABSTRACT

Large scale surveys in mammalian tissue culture cells suggest that the protein ex-

pressed at the median abundance is present at 8,000_16,000 molecules per cell and

that differences in mRNA expression between genes explain only 10_40% of the dif-

ferences in protein levels. We find, however, that these surveys have significantly un-

derestimated protein abundances and the relative importance of transcription.

Using individual measurements for 61 housekeeping proteins to rescale whole proteome

data from Schwanhausser et al. (2011), we find that the median protein detected is

expressed at 170,000 molecules per cell and that our corrected protein abundance

estimates show a higher correlation with mRNA abundances than do the uncorrected

protein data. In addition, we estimated the impact of further errors in mRNA and

protein abundances using direct experimental measurements of these errors.

The resulting analysis suggests that mRNA levels explain at least

  • 56% of the differences in protein abundance for the 4,212 genes

detected by Schwanhausser et al. (2011), though because one major source of error

could not be estimated the true percent contribution should be higher.
We also employed a second, independent strategy to

  • determine the contribution of mRNA levels to protein expression.

The variance in translation rates directly measured by ribosome profiling is only 12%

of that inferred by Schwanhausser et al. (2011), and

  • the measured and inferred translation rates correlate poorly (R2 D 13).

Based on this, our second strategy suggests that

  • mRNA levels explain _81% of the variance in protein levels.

We also determined the percent contributions of

  • transcription,
  • RNA degradation,
  • translation
  • and protein degradation

to the variance in protein abundances using both of our strategies.

While the magnitudes of the two estimates vary, they both suggest that

  • transcription plays a more important role than the earlier studies implied and
  • translation a much smaller role.

Finally, the above estimates only apply to those genes whose mRNA and protein expression was detected. Based on a detailed analysis by Hebenstreit et al. (2012), we estimate that approximately

  • 40% of genes in a given cell within a population express no mRNA.

Since there can be no translation in the absence of mRNA, we argue that

  • differences in translation rates can play no role in determining the expression levels for the _40% of genes that are non-expressed.

Subjects Bioinformatics, Computational Biology

Keywords Transcription, Translation, Mass spectrometry, Gene expression, Protein abundance

How to cite this article Li et al. (2014), System wide analyses have underestimated protein abundances and the importance of transcription in mammals. PeerJ 2:e270; 

http://dx.doi.org:/10.7717/peerj.270


Assessing quality and completeness of human transcriptional regulatory pathways on a genome-wide scale

Evgeny Shmelkov1,2, Zuojian Tang2, Iannis Aifantis3, Alexander Statnikov2,4

Shmelkov et al. Biology Direct 2011, 6:15  http://www.biology-direct.com/content/6/1/15


Background: Pathway databases are becoming increasingly important and almost omnipresent in most types of biological and translational research. However, little is known about the quality and completeness of pathways stored in these databases. The present study conducts a comprehensive assessment of transcriptional regulatory pathways in humans for seven well-studied transcription factors: MYC, NOTCH1, BCL6, TP53, AR, STAT1, and RELA.

The employed benchmarking methodology first

  • involves integrating genome-wide binding with functional gene expression data to derive direct targets of transcription factors.
  • Then the lists of experimentally obtained direct targets are compared with relevant lists of transcriptional targets from 10 commonly used pathway databases.

Results: The results of this study show that for the majority of pathway databases,

  • the overlap between experimentally obtained target genes and targets reported in transcriptional regulatory pathway databases is surprisingly small and often is not statistically significant.

The only exception is MetaCore pathway database which yields statistically significant intersection with experimental results in 84% cases. Additionally, we suggest that

  • the lists of experimentally derived direct targets obtained in this study can be used to reveal new biological insight in transcriptional regulation and
  • suggest novel putative therapeutic targets in cancer.

Conclusions: Our study opens a debate on validity of using many popular pathway databases to obtain transcriptional regulatory targets. We conclude that the choice of pathway databases should be informed by solid scientific evidence and rigorous empirical evaluation.


Illustration of statistical methodology

Illustration of statistical methodology


Figure 2 Illustration of statistical methodology for comparison

between a gold-standard and a pathway database


Additional material

Additional file 1: Supplementary Information. Table S1: Functional gene expression data. Table 2: Transcription factor-DNA binding data. Table S3: Most confident direct transcriptional targets of each of the four transcription factors. These targets were obtained by overlapping several gold-standards obtained with different datasets for the same transcription factor. Table S4: Genes directly regulated by two or more of the three transcription factors: MYC, NOTCH1, and RELA. Figure S1: Comparison of gene sets of transcriptional targets derived from ten different pathway databases by Jaccard index. In case, where Jaccard index of an overlap could not be determined due to comparison of two empty gene lists, we assigned value 0. Cells are colored according to the Jaccard index, from white (Jaccard index equal to 0) to dark-orange (Jaccard index equal to 1). Each sub-figure gives results for a different transcription factor: (a) AR, (b) BCL6, (c) MYC, (d) NOTCH1, (e) RELA, (f) STAT1, (g) TP53


http://dx.doi.org:/10.1186/1745-6150-6-15


Cite this article as: Shmelkov et al.: Assessing quality and completeness of human transcriptional regulatory pathways on a genome-wide scale. Biology Direct 2011 6:15


The Functional Consequences of Variation in Transcription Factor Binding
Darren A. Cusanovich1, Bryan Pavlovic1,2, Jonathan K. Pritchard1,2,3*, Yoav Gilad1*

1 Department of Human Genetics, University of Chicago, 2 Howard Hughes Medical Institute, University of Chicago, Chicago,

Illinois, 3 Departments of Genetics and Biology and Howard Hughes Medical Institute, Stanford University, Stanford, California,


One goal of human genetics is to understand how the information for precise and dynamic gene expression programs is encoded in the genome. The interactions of transcription factors (TFs) with DNA regulatory elements clearly play an important role in determining gene expression outputs, yet the regulatory logic underlying functional transcription factor binding is poorly understood. Many studies have focused on characterizing the genomic locations of TF binding, yet it is unclear to what extent TF binding at any specific locus has functional consequences with respect to gene expression output.

To evaluate the context of functional TF binding we knocked down

  • 59 TFs and chromatin modifiers in one HapMap lymphoblastoid cell line.
  • We identified genes whose expression was affected by the knockdowns.
  • We intersected the gene expression data with transcription factor binding data
    (based on ChIP-seq and DNase-seq) within 10 kb of the transcription start sites

This combination of data allowed us to infer functional TF binding.

  • we found that only a small subset of genes bound by a factor were differentially expressed following the knockdown of that factor, suggesting that
  • most interactions between TF and chromatin do not result in measurable changes in gene expression levels of putative target genes.
  • functional TF binding is enriched in regulatory elements that harbor
    • a large number of TF binding sites,
    • at sites with predicted higher binding affinity, and
    • at sites that are enriched in genomic regions annotated as ‘‘active enhancers.’’

Author Summary

An important question in genomics is to understand how a class of proteins called ‘‘transcription factors’’ controls the expression level of other genes in the genome in a cell type-specific manner – a process that is essential to human development. One major approach to this problem is to

study where these transcription factors bind in the genome, but this does not tell us about the effect of that binding on gene expression levels and it is generally accepted that much of the binding does not strongly influence gene expression. To address this issue, we artificially reduced the concentration of 59 different transcription factors in the cell and then examined which genes were impacted by the reduced transcription factor level. Our results implicate some attributes that might

influence what binding is functional, but they also suggest that a simple model of functional vs. non-functional binding may not suffice.

Citation: Cusanovich DA, Pavlovic B, Pritchard JK, Gilad Y (2014) The Functional Consequences of Variation in Transcription Factor Binding. PLoS Genet 10(3):e1004226. http://dx.doi.org:/10.1371/journal.pgen.1004226

Editor: Yitzhak Pilpel, Weizmann Institute of Science, Israel


Effect sizes for differentially expressed genes

Effect sizes for differentially expressed genes

Figure 2. Effect sizes for differentially expressed genes.

Boxplots of absolute Log2(fold-change) between knockdown arrays

and control arrays for all genes identified as differentially expressed in

each experiment. Outliers are not plotted. The gray bar indicates the

interquartile range across all genes differentially expressed in all

knockdowns. Boxplots are ordered by the number of genes differentially

expressed in each experiment. Outliers were not plotted.

http://dx.doi.org:/10.1371/journal.pgen.1004226.g002


Intersecting binding data and expression data for each knockdown

Intersecting binding data and expression data for each knockdown


Figure 3. Intersecting binding data and expression data for each knockdown. (a) Example Venn diagrams showing the overlap of binding and differential expression for the knockdowns of HCST and IRF4 (the same genes as in Figure 1). (b) Boxplot summarizing the distribution of the fraction of all expressed genes that are bound by the targeted gene or downstream factors. (c) Boxplot summarizing the distribution of the fraction of

bound genes that are classified as differentially expressed, using an FDR of either 5% or 20%.

http://dx.doi.org:/10.1371/journal.pgen.1004226.g003


Degree of binding correlated with function

Degree of binding correlated with function


Figure 4. Degree of binding correlated with function. Boxplots comparing (a) the number of sites bound, and (b) the number of differentially expressed transcription factors binding events near functionally or non-functionally bound genes. We considered binding for siRNA-targeted factor and any factor differentially expressed in the knockdown. (c) Focusing only on genes differentially expressed in common between each pairwise set of knockdowns we tested for enrichments of functional binding (y-axis). Pairwise comparisons between knock-down experiments were binned by the fraction of differentially expressed transcription factors in common between the two experiments. For these boxplots, outliers were not plotted.

http://dx.doi.org:/10.1371/journal.pgen.1004226.g004


Distribution of functional binding about the TSS

Distribution of functional binding about the TSS


Figure 5. Distribution of functional binding about the TSS. (a) A density plot of the distribution of bound sites within 10 kb of the TSS for both functional and non-functional genes. Inset is a zoom-in of the region +/21 kb from the TSS (b) Boxplots comparing the distances from the TSS to the binding sites for functionally bound genes and non-functionally bound genes. For the boxplots, 0.001 was added before log10 transforming

the distances and outliers were not plotted.

http://dx.doi.org:/10.1371/journal.pgen.1004226.g005


Magnitude and direction of differential expression after knockdown

Magnitude and direction of differential expression after knockdown


Figure 6. Magnitude and direction of differential expression after knockdown. (a) Density plot of all Log2(fold-changes) between the knockdown arrays and controls for genes that are differentially expressed at 5% FDR in one of the knockdown experiments as well as bound by the targeted transcription factor. (b) Plot of the fraction of differentially expressed putative direct targets that were up-regulated in each of the knockdown experiments.

http://dx.doi.org:/10.1371/journal.pgen.1004226.g006


To test whether the number of paralogs or the degree of similarity with the closest paralog for each transcription factor knocked down might influence the number of genes differentially expressed in our experiments, we obtained definitions of paralogy and the calculations of percent identity for 29 different factors from Ensembl’s BioMart (http://useast.ensembl.org/biomart/martview/) [31]. We used genome build GRCh37.p13.

For each gene, we counted the number of paralogs classified as a ‘‘within_species_paralog’’. After selecting only genes considered a ‘‘within_species_paralog’’, we also assigned the maximum percent identity as the closest paralog.

To evaluate the effect that an independent assignment of target genes to regulatory regions might have on our analyses, we used the definition of target genes defined by Thurman et al. (ftp://ftp.ebi.ac.uk/pub/databases/…)

which use correlations in DNase hypersensitivity between distal and proximal regulatory regions across different cell types to link distal elements to putative target genes [38].

We intersected the midpoints of our called binding events (defined above) with these regulatory elements in order to assign our binding events to specific target genes and then re-analyzed the overlap between

binding and differential expression in our experiments.

PLOS Genetics 6 Mar 2014; 10 (3), e1004226


The essential biology of the endoplasmic reticulum stress response

for structural and computational biologists

Sadao Wakabayashia, Hiderou Yoshidaa,*

aDepartment of Molecular Biochemistry, Graduate School of Life Science,

University of Hyogo, Hyogo 678-1297, Japan

CSBJ Mar 2013; 6(7), e201303010, http://dx.doi.org/10.5936/csbj.201303010


Abstract: The endoplasmic reticulum (ER) stress response is a cytoprotective mechanism that maintains homeostasis of the ER by

  • upregulating the capacity of the ER in accordance with cellular demands.

If the ER stress response cannot function correctly, because of reasons such as aging, genetic mutation or environmental stress,

  • unfolded proteins accumulate in the ER and cause ER stress-induced apoptosis,
  • resulting in the onset of folding diseases,
    • including Alzheimer’s disease and diabetes mellitus.

Although the mechanism of the ER stress response has been analyzed extensively by biochemists, cell biologists and molecular biologists, many aspects remain to be elucidated. For example,

  • it is unclear how sensor molecules detect ER stress, or
  • how cells choose the two opposite cell fates
    (survival or apoptosis) during the ER stress response.

To resolve these critical issues, structural and computational approaches will be indispensable, although the mechanism of the ER stress response is complicated and difficult to understand holistically at a glance. Here, we provide a concise introduction to the mammalian ER stress response for structural and computational biologists.

The basic mechanism of the mammalian ER stress response

The mammalian ER stress response consists of three pathways: the ATF6, IRE1 and PERK pathways, of which the main functions are

  • augmentation of folding and ERAD capacity, and
  • translational attenuation, respectively.

Although these response pathways cross-talk with each other and have several branched subpathways, we focus on the main pathways in this section.

  • The ATF6 pathway regulates the transcriptional induction of ER chaperone genes
  • pATF6(P) is a sensor molecule comprising a type II transmembrane protein residing on the ER membrane (Figure 2).

When pATF6(P) detects ER stress,

  • the protein is transported to the Golgi apparatus through vesicular transport in a COP-II vesicle
  • and is sequentially cleaved by two proteases residing in the Golgi,
    • namely site 1 protease (S1P) and site 2 protease (S2P)

The cytoplasmic portion of pATF6(P) (pATF6(N)) is

  1. released from the Golgi membrane,
  2. translocates into the nucleus,
  3. binds to an enhancer element called the ER stress response element (ERSE),
  4. and activates the transcription of ER chaperone genes,
  • including BiP, GRP94, calreticulin and protein disulfide isomerase (PDI)

The consensus nucleotide sequence of ERSE is CCAAT(N9)CCACG, and pATF6(N) recognizes both the CCACG portion and another transcription factor NF-Y,

  • which binds to the CCAAT portion

NF-Y is a general transcription factor required for

  • the transcription of various human genes


Figure 2. The ATF6 pathway. The sensor molecule pATF6(P) located on the ER membrane is transported to the Golgi apparatus by transport vesicles in response to ER stress. In the Golgi apparatus, pATF6(P) is sequentially cleaved by two proteases, S1P and S2P, resulting in release of the cytoplasmic portion pATF6(N) from the ER membrane. pATF6(N) translocates into the nucleus and activates transcription of ER chaperone genes through binding to the cis-acting enhancer ERSE.


Figure 3. The IRE1 pathway. In normal growth conditions, the sensor molecule IRE1 is an inactive monomer, whereas IRE1 forms an active oligomer in response to ER stress. Activated IRE1 converts unspliced XBP1 mRNA to mature mRNA by the cytoplasmic mRNA splicing. From mature XBP1 mRNA, an active transcription factor pXBP1(S) is translated and activates the transcription of ERAD genes through binding to the enhancer UPRE.


Figure 4. The PERK pathway. When PERK detects unfolded proteins in the ER, PERK phosphorylates eIF2α, resulting in translational attenuation and translational induction of ATF4. ATF4 activates the transcription of target genes encoding translation factors, anti-oxidation factors and a transcription factor CHOP. Other kinases such as PKR, GCN2 and HRI also phosphorylate eIF2α, and phosphorylated eIF2α is dephosphorylated by CReP, PP1C-GADD34 and p58IPK


Figure 7. Three functions of pXBP1(U). pXBP1(U) translated from XBP1(U) mRNA binds to pXBP1(S) and enhances its degradation. The CTR region of pXBP1(U) interacts with the ribosome tunnel and slows translation, while the HR2 region anchors XBP1(U) mRNA to the ER membrane, in order to enhance splicing of XBP1(U) mRNA by IRE1.


Figure 8. Major pathways of ER stress-induced apoptosis. ER stress induces apoptosis through various pathways, including transcriptional induction of CHOP by the PERK and ATF6 pathways, the IRE1-TRAF2 pathway and the caspase-12 pathway.

If cells are damaged by strong and sustained ER stress that they cannot deal with and ER stress still persists and hampers the survival of the organism, the ER stress response activates the apoptotic pathways and disposes of damaged cells from the body.

Computational simulation of response pathways to analyze the decision mechanism that determines cell fate (survival or apoptosis) provides a valuable analysis tool, although there have been few such studies to date.

Read Full Post »

Larry H. Bernstein, MD, FCAP, Author and Curator

http://pharmaceuticalintelligence.com/7/17/2014/Genes, proteomes, and their interaction


This is the third discussion of a several part series leading from the genome, to protein synthesis (1), posttranslational modification of proteins (2), examples of protein effects on metabolism and signaling pathways (3), and leading to disruption of signaling pathways in disease (4), and effects leading to mutagenesis.


1.  A Primer on DNAand DNA Replication


Dna triplex pic

Epigenetic_mechanisms


2. Overview of translational medicine

3. Genes, proteomes, and their interaction

4. Regulation of somatic stem cell Function

5.  Proteomics – The Pathway to Understanding and Decision-making in Medicine

6.  Genomics, Proteomics and standards

7.  Long Non-coding RNAs Can Encode Proteins After All

8.  Proteins and cellular adaptation to stress

9.  Loss of normal growth regulation


This discussion is the beginning of a diversion away from the routine discussion of a specific sequence and pairing of nucleotides in the classic model, to explore the interaction between proteins, or folded proteins and RNA or hidtones that reside in the nucleus and contribute to induction or inactivation of gene expression.  The basic text document is rigid, inflexible, and resides in all cells.  Yet, in bacteria, yeast, and eukaryotic cells, there are models of gene expression, and in eukaryotes, there is the development of expressed organ systems.  These systems have similar proteins or enzymes that are functionally identical, but they have isoforms that bind with proteins, membranes, lipopolysaccharides, and lipoproteins – which has an impact on the catabolic and anabolic activity of the cells, and they are affected by oxidative stress, and they are often dependent on the energy of binding with metal ions,i.e., Mn, Cu, Cd, Zn,..,Fe, and in other cases anionic ligands, such as I, and they may transiently act through a nucleotide or influenced by a hormone.


This will be presented as a group of predetermined articles to follow:

1.   Scientists discover a broad spectrum of alternatively spliced human protein variants within a well-studied family of genes.  

2.  Thyroid Hormone Key to Lipid Kinase Regulation

3.  Mammalian Target of Rapamycin Complex 1 Orchestrates Invariant NKT Cell Differentiation and Effector Function

4   The E3 ligase PARC mediates the degradation of cytosolic cytochrome c to promote survival in neurons and cancer cells

5.  Nf k-beta signaling pathway

6.  P181 cAMP-mediated Rac1 activation regulates the re-establishment of endothelial adherens junctions and barrier restoration during inflammation.

7.  Structure of the DDB1–CRBN E3 ubiquitin ligase in complex with thalidomide

8.  Protein misfolding, congophilia, oligomerization, and defective amyloid processing in preeclampsia

9.  Removing parts of shape-shifting protein explains how blood clots


1.  Added Layers of Proteome Complexity

Scientists discover a broad spectrum of alternatively spliced human protein variants within a well-studied family of genes.  

By Anna Azvolinsky | July 17, 2014

added layers of proteome

added layers of proteome


There may be more to the human proteome than previously thought. Some genes are known to have several different alternatively spliced protein variants, but the Scripps Research Institute’s Paul Schimmel and his colleagues have now uncovered almost 250 protein splice variants of an essential, evolutionarily conserved family of human genes. The results were published today (July 17) in Science.

Focusing on the 20-gene family of aminoacyl tRNA synthetases (AARSs), the team captured AARS transcripts from human tissues—some fetal, some adult—and showed that many of these messenger RNAs (mRNAs) were translated into proteins. Previous studies have identified several splice variants of these enzymes that have novel functions, but uncovering so many more variants was unexpected, Schimmel said. Most of these new protein products lack the catalytic domain but retain other AARS non-catalytic functional domains.

“The main point is that a vast new area of biology, previously missed, has been uncovered,” said Schimmel.

“This is an incredible study that fundamentally changes how we look at the protein-synthesis machinery,” Michael Ibba, a protein translation researcher at Ohio State University who was not involved in the work, told The Scientist in an e-mail. “The unexpected and potentially vast expanded functional networks that emerge from this study have the potential to influence virtually any aspect of cell growth.”

The team—including researchers at the Hong Kong University of Science and Technology, Stanford University, and aTyr Pharma, a San Diego-based biotech company that Schimmel co-founded—comprehensively captured and sequenced the AARS mRNAs from six human tissue types using high-throughput deep sequencing. While many of the transcripts were expressed in each of the tissues, there was also some tissue specificity.

Next, the team showed that a proportion of these transcripts, including those missing the catalytic domain, indeed resulted in stable protein products: 48 of these splice variants associated with polysomes. In vitro translation assays and the expression of more than 100 of these variants in cells confirmed that many of these variants could be made into stable protein products.

The AARS enzymes—of which there’s one for each of the 20 amino acids—bring together an amino acid with its appropriate transfer RNA (tRNA) molecule. This reaction allows a ribosome to add the amino acid to a growing peptide chain during protein translation. AARS enzymes can be found in all living organisms and are thought to be among the first proteins to have originated on Earth.

To understand whether these non-catalytic proteins had unique biological activities, the researchers expressed and purified recombinant AARS fragments, testing them in cell-based assays for proliferation, cell differentiation, and transcriptional regulation, among other phenotypes. “We screened through dozens of biological assays and found that these variants operate in many signaling pathways,” said Schimmel.

“This is an interesting finding and fits into the existing paradigm that, in many cases, a single gene is processed in various ways [in the cell] to have alternative functions,” said­ Steven Brenner, a computational genomics researcher at the University of California, Berkeley.

The team is now investigating the potentially unique roles of these protein splice variants in greater detail—in both human tissue as well as in model organisms. For example, it is not yet clear whether any of these variants directly bind tRNAs.

“I do think [these proteins] will play some biological roles,” said Tao Pan, who studies the functional roles of tRNAs at the University of Chicago. “I am very optimistic that interesting biological functions will come out of future studies on these variants.”

Brenner agreed. “There could be very different biological roles [for some of these proteins]. Biology is very creative that way, [it’s] able to generate highly diverse new functions using combinations of existing protein domains.” However, the low abundance of these variants is likely to constrain their potential cellular functions, he noted.

Because AARSs are among the oldest proteins, these ancient enzymes were likely subject to plenty of change over time, said Karin Musier-Forsyth, who studies protein translational at the Ohio State University. According to Musier-Forsyth, synthetases are already known to have non-translational functions and differential localizations. “Like the addition of post-translational modifications, splicing variation has evolved as another way to repurpose protein function,” she said.

One of the protein variants was able to stimulate skeletal muscle fiber formation ex vivo and upregulate genes involved in muscle cell differentiation and metabolism in primary human skeletal myoblasts. “This was really striking,” said Musier-Forsyth. “This suggests that, perhaps, peptides derived from these splice variants could be used as protein-based therapeutics for a variety of diseases.”

W.S. Lo et al., “Human tRNA synthetase catalytic nulls with diverse functions,” Science,  http://dx.doi.org:/10.1126/science.1252943, 2014.

Tags  tRNA, proteomics, protein synthesis and human proteome project


2. Thyroid Hormone Key to Lipid Kinase Regulation

Published: Jul 16, 2014 | Updated: Jul 17, 2014
By Salynn Boyles, Contributing Writer, MedPage Today
Reviewed by Zalman S. Agus, MD; Emeritus Professor, Perelman School of Medicine at the University of Pennsylvania and
Dorothy Caputo, MA, BSN, RN, Nurse Planner

Action Points

  • Thyroid hormone is an essential regulator of human growth, brain maturation, and adult cognition and metabolism.
  • This study provides evidence that cytoplasmic thyroid hormone signaling through phosphatidylinositol 3-kinase appears to be an essential mechanism underlying normal synaptic maturation and plasticity in the postnatal mouse hippocampus

Thyroid hormones are key for brain development and synaptic maturation, and researchers have identified a specific molecular mechanism for rapid lipid kinase activation by the thyroid hormone receptor beta (TR-beta) that involves a cytoplasmic complex of the gene.

Many effects of the thyroid hormone on mammalian cells in vitro have been shown to be mediated by the phosphatidylinositol 3-kinase (PI3K), but the molecular mechanism of PI3K regulation and its relevance to brain development have not been clear, according to David L. Armstrong, PhD, of the National Institute of Environmental Health and Development in Research Triangle, N.C., and colleagues.

They identified a specific molecular mechanism for rapid PI3 kinase activation by TR-beta which involves a cytoplasmic complex of TR-beta, the p85 regulatory subunit of PI3 kinase and the Src family kinase, Lyn, they wrote in Endocrinology.Armstrong’s co-authors are from Duke University and Loyola University in Chicago.

This complex provides a unique mechanism for integrating growth signals through thyroid hormone and receptor tyrosine kinases, they explained.

“Most everyone agrees that thyroid hormones are essential for brain development and synaptic maturation, but we didn’t know how exactly,” Armstrong told MedPage Today. “We show that nongenomic signaling in TR-beta through PI3 kinase is essential for one of its physiological actions.”

The Role of T3 Hormone

The recognition that many hormones regulate gene expression through receptor proteins that bind to DNA is a major biological discovery over the past 50 years, the researchers noted.

“More recently, it has become clear that in many cases the same hormones produce rapid effects on cell physiology though the same receptors signaling in the cytoplasm,” they wrote. “However, testing the relative importance of the genomic and nongenomic mechanisms in vivo has been prevented by the absence of specific molecular mechanisms for the nongenomic effects that could be blocked by mutation of the receptor without disrupting its direct effects on gene expression.”

The thyroid hormone T3 has been shown to be a regulator of many physiological effects, including human growth, brain maturation, and adult cognition and metabolism.

Many of these effects have been found to be mediated through the regulation of gene expression by zinc-finger nuclear receptor proteins that are encoded by the THRA and THRB genes. But many in vitro effects of T3 are too rapid to be explained by transcriptional regulation, Armstrong and colleagues noted.

In earlier work, they identified PI3 kinase as a key player in these rapid effects. Like thyroid hormone, PI3 kinase activity has been identified as essential for growth, metabolism, and brain development.

PI3 kinase is regulated primarily by receptor tyrosine kinases, and an integrin receptor has been identified that mediates some of the PI3 kinase-dependent effects of thyroxine (T4), the widely circulated precursor of T3.

Both TR-alpha and TR-beta have also been reported to associate with PI3 kinase and stimulate its activity in many cell types. In a 2006 study in the Proceedings of the National Academy of Sciences, Armstrong and colleagues demonstrated that TRis required to reconstitute T3 and PI3 kinase-dependent regulation of Kv11.1 channels in cell-free membrane patches from Chinese hamster ovary (CHO) cells.

Based on that research, they concluded that TR-beta signaling through PI3K “provides a molecular explanation for the essential role of thyroid hormone in human brain development and adult lipid metabolism.”

Measuring PIP3 Production

In the newly reported series of experiments, the researchers used fluorescent PIP3 indicator to directly measure PIP3 production in response to thyroid hormone on the same time scale as the electrophysiological measurements in the CHO cells expressing recombinant human thyroid hormone receptors.

The research revealed that, in the absence of hormone, the nuclear receptor TR-beta forms a cytoplasmic complex with the p85 subunit of PI3 kinase and the Src family tyrosine kinase, Lyn, which depends on two canonical phosphotyrosine motifs in the second zinc finger of TR that are not conserved in  TR-beta

“When hormone is added, [TR-beta] dissociates and moves to the nucleus, and PIP3production goes up rapidly,” the researchers wrote. “Mutating either tyrosine to a phenylalanine prevents rapid signaling through PI3 kinase but does not prevent hormone-dependent transcription of genes with a thyroid hormone response element.”

“It is only when you have both thyroid hormone and phosphotyrosine signaling that you get maximal stimulation of PI3 kinase,” Armstrong said, adding that the novel methodology of the study, which involved serum from thyroidectomized animals, led to the finding.

These experiments led to in vivo research to test the physiological relevance of thyroid hormone signaling through PI3 kinase for brain development in a novel mouse line created by the researchers.

“We reasoned that blocking binding of TR-beta to p85 by mutating Y171 might eliminate any dominant negative effect of the mutant, in much the same way that receptor knockdown proved much less deleterious to the organism than hormone withdrawal, presumably because many of the effects of the receptor on gene expression are mediated by binding of the unliganded receptor,” they wrote.

They created a novel mouse line with a targeted mutation knocked into the THRB gene to substitute phenylalanine for tyrosine at residue 147 of TR-beta-1, which prevents Lyn binding to the mutant receptor.

They confirmed that the mutation did not alter total circulating levels of thyroxine (T4) or T3 by mass spectrometry of serum samples from 4-month-old mice.

“When the rapid signaling mechanism was blocked chronically throughout development in mice by a targeted point mutation in both alleles of THRB, circulating hormone levels, TR-betaexpression, and direct gene regulation by TR-beta in the brain and liver were all unaffected,” the researchers wrote. “The mutation did significantly impair maturation and plasticity of the Schaffer collateral synapses on CA1 pyramidal neurons in the postnatal hippocampus. Thus, phosphotyrosine-dependent association of TR-betawith PI3K provides a potential mechanism for integrating regulation of development and metabolism by thyroid hormone and receptor tyrosine kinases.”

A Novel Finding

The finding that thyroid hormone signaling through PI3 kinase appears to be an essential mechanism underlying normal synaptic maturation and plasticity in the postnatal mouse hippocampus is novel.

The researchers noted that they could not formally exclude some more subtle effects of the mutation on the regulation of an unknown gene that plays as central a role in synaptic development as PI3K, but the added that “our results do categorically rule out a role for other thyroid hormone receptors in this particular aspect of synaptic maturation in the mouse hippocampus.

“In either case, given the importance of thyroid hormone signaling for human brain development and adult metabolism, future studies will need to investigate whether PI3 kinase stimulation by thyroid hormone is also susceptible to disruption by environmental toxicants,” they wrote.

Armstrong also pointed out that the tyrosine motifs in TR-beta, which were shown to be essential for signaling through PI3 kinase, are present in all mammals, but not in other species with known genome data, with the exception of the gecko and the axolotl (Mexican salamander).

“Mammals evolved from reptiles, and the thinking is that they survived by adopting a nocturnal niche,” he said. “This is exactly what thyroid hormone does, so it may be that this mutation contributed to the (evolutionary) success of mammals.”

Primary source: Endocrinology
Source reference: Martin NP, et al “A rapid cytoplasmic mechanism for PI3 kinase regulation by the nuclear thyroid hormone receptor, TR beta, and genetic evidence for its role in the maturation of mouse hippocampal synapses in vivo”

Endocrinology 2014;         http://dx.doi.org:/10.1210/en.2013-2058.


3.  Mammalian Target of Rapamycin Complex 1 Orchestrates Invariant NKT Cell Differentiation and Effector Function.

Lianjun Zhang, Benjamin O Tschumi, Stéphanie Corgnac, Markus A Rüegg,Michael N Hall, Jean-Pierre Mach, Pedro Romero, Alena Donda

Journal of immunology (Baltimore, Md. : 1950) 07/2014;     http://dx.doi.org:/10.4049/jimmunol.1400769

Source: PubMed

ABSTRACT Invariant NKT (iNKT) cells play critical roles in bridging innate and adaptive immunity. The Raptor containing mTOR complex 1 (mTORC1) has been well documented to control peripheral CD4 or CD8 T cell effector or memory differentiation. However, the role of mTORC1 in iNKT cell development and function remains largely unknown. By using mice with T cell-restricted deletion of Raptor, we show that mTORC1 is selectively required for iNKT but not for conventional T cell development. Indeed, Raptor-deficient iNKT cells are mostly blocked at thymic stage 1-2, resulting in a dramatic decrease of terminal differentiation into stage 3 and severe reduction of peripheral iNKT cells. Moreover, residual iNKT cells in Raptor knockout mice are impaired in their rapid cytokine production upon αGalcer challenge. Bone marrow chimera studies demonstrate that mTORC1 controls iNKT differentiation in a cell-intrinsic manner. Collectively, our data provide the genetic evidence that iNKT cell development and effector functions are under the control of mTORC1 signaling.


4.  PARC

The E3 ligase PARC mediates the degradation of cytosolic cytochrome c to promote survival in neurons and cancer cells

Vivian Gama1,2, Vijay Swahari1,2, Johanna Schafer1*, Adam J. Kole2, Allyson Evans2, Yolanda Huang2, Anna Cliffe1,2, Brian Golitz3,4, Noah Sciaky3,4, Xin-Hai Pei5,6, Yue Xiong5,6, and Mohanish Deshmukh1,2,5

1 Neuroscience Center, 2 Department of Cell Biology and Physiology, 3 UNC RNAi Screening Facility,4 Department of Pharmacology, 5 Lineberger Comprehensive Cancer Center, 6 Department of Biochemistry and Biophysics, University of North Carolina, Chapel Hill, NC 27599, USA.* Present address: Vanderbilt University, Nashville, TN 37232, USA.  Present address: Cell Press, Cambridge, MA 02139, USA.  Present address: Department of Anesthesiology, Columbia University Medical Center, New York, NY 10032, USA.

Abstract: The ability to withstand mitochondrial damage is especially critical for the survival of postmitotic cells, such as neurons. Likewise, cancer cells can also survive mitochondrial stress. We found that cytochrome c (Cyt c), which induces apoptosis upon its release from damaged mitochondria, is targeted for proteasome-mediated degradation in mouse neurons, cardiomyocytes, and myotubes and in human glioma and neuroblastoma cells, but not in proliferating human fibroblasts. In mouse neurons, apoptotic protease-activating factor 1 (Apaf-1) prevented the proteasome-dependent degradation of Cyt c in response to induced mitochondrial stress. An RNA interference screen in U-87 MG glioma cells identified p53-associated Parkin-like cytoplasmic protein (PARC, also known as CUL9) as an E3 ligase that targets Cyt c for degradation. The abundance of PARC positively correlated with differentiation in mouse neurons, and overexpression of PARC reduced the abundance of mitochondrially-released cytosolic Cyt c in various cancer cell lines and in mouse embryonic fibroblasts. Conversely, neurons from Parc-deficient mice had increased sensitivity to mitochondrial damage, and neuroblastoma or glioma cells in which PARC or ubiquitin was knocked down had increased abundance of mitochondrially-released cytosolic Cyt c and decreased viability in response to stress. These findings suggest that PARC-mediated ubiquitination and degradation of Cyt c is a strategy engaged by both neurons and cancer cells to prevent apoptosis during conditions of mitochondrial stress.
Sci. Signal., 15 July 2014   Vol. 7, Issue 334, p. ra67
http://dx.doi.org:/10.1126/scisignal.2005309

Citation: V. Gama, V. Swahari, J. Schafer, A. J. Kole, A. Evans, Y. Huang, A. Cliffe, B. Golitz, N. Sciaky, X.-H. Pei, Y. Xiong, M. Deshmukh, The E3 ligase PARC mediates the degradation of cytosolic cytochrome c to promote survival in neurons and cancer cells. Sci. Signal. 7, ra67 (2014).

Killing the Killer: PARC/CUL9 Promotes Cell Survival by Destroying Cytochrome c

Jonathan Lopez and Stephen W. G. Tait*
Cancer Research UK Beatson Institute, Institute of Cancer Sciences, University of Glasgow, Garscube Estate, Switchback Road, Glasgow G61 1BD, UK.

Abstract: Balanced amounts of apoptotic cell death are essential for health; its deregulation plays key roles in neurodegeneration, autoimmunity, and cancer. Mitochondria orchestrate apoptosis through a process called mitochondrial outer-membrane permeabilization (MOMP). After MOMP, mitochondrial cytochrome c is released into the cytoplasm, where it binds the adaptor molecule APAF1, triggering caspase protease activation and cell death. In this issue of Science Signaling, Deshmukh and colleagues define a new survival mechanism downstream of mitochondrial permeabilization. Specifically, they identify proteasomal degradation of cytochrome c as a major determinant of cell survival. In an unbiased approach, PARC (also known as CUL9) was found to be the ubiquitin ligase responsible for the ubiquitination and proteasomal degradation of cytochrome c. The consequences of this survival process may be double-edged because both cancer cells and postmitotic cells use PARC/CUL9–mediated cytochrome c degradation to ensure cell survival. Ultimately, differential targeting of this process may promote survival of postmitotic tissue or enhance tumor-specific killing.

Citation: J. Lopez, S. W. G. Tait, Killing the Killer: PARC/CUL9 Promotes Cell Survival by Destroying Cytochrome c. Sci. Signal. 7, pe17 (2014).

Sci. Signal., 15 July 2014  Vol. 7, Issue 334, p. pe17
http://dx.doi.org:/10.1126/scisignal.2005619


4. The WNK-SPAK/OSR1 pathway: Master regulator of cation-chloride cotransporters

Dario R. Alessi1, Jinwei Zhang1, Arjun Khanna2, Thomas Hochdörfer1, Yuze Shang3, and Kristopher T. Kahle2,3*
1 MRC Protein Phosphorylation and Ubiquitylation Unit, College of Life Sciences, University of Dundee, Dundee DD1 5EH, Scotland.
2 Department of Neurosurgery, Massachusetts General Hospital, and Harvard Medical School, 3 Manton Center for Orphan Disease Research, Boston Children’s Hospital, Boston, MA 02115, USA.

Abstract: The WNK-SPAK/OSR1 kinase complex is composed of the kinases WNK (with no lysine) and SPAK (SPS1-related proline/alanine-rich kinase) or the SPAK homolog OSR1 (oxidative stress–responsive kinase 1). The WNK family senses changes in intracellular Cl– concentration, extracellular osmolarity, and cell volume and transduces this information to sodium (Na+), potassium (K+), and chloride (Cl–) cotransporters [collectively referred to as CCCs (cation-chloride cotransporters)] and ion channels to maintain cellular and organismal homeostasis and affect cellular morphology and behavior. Several genes encoding proteins in this pathway are mutated in human disease, and the cotransporters are targets of commonly used drugs. WNKs stimulate the kinases SPAK and OSR1, which directly phosphorylate and stimulate Cl–-importing, Na+-driven CCCs or inhibit the Cl–-extruding, K+-driven CCCs. These coordinated and reciprocal actions on the CCCs are triggered by an interaction between RFXV/I motifs within the WNKs and CCCs and a conserved carboxyl-terminal docking domain in SPAK and OSR1. This interaction site represents a potentially druggable node that could be more effective than targeting the cotransporters directly. In the kidney, WNK-SPAK/OSR1 inhibition decreases epithelial NaCl reabsorption and K+ secretion to lower blood pressure while maintaining serum K+. In neurons, WNK-SPAK/OSR1 inhibition could facilitate Cl–extrusion and promote -aminobutyric acidergic (GABAergic) inhibition. Such drugs could have efficacy as K+-sparing blood pressure–lowering agents in essential hypertension, nonaddictive analgesics in neuropathic pain, and promoters of GABAergic inhibition in diseases associated with neuronal hyperactivity, such as epilepsy, spasticity, neuropathic pain, schizophrenia, and autism.
Citation: D. R. Alessi, J. Zhang, A. Khanna, T. Hochdörfer, Y. Shang, K. T. Kahle, The WNK-SPAK/OSR1 pathway: Master regulator of cation-chloride cotransporters. Sci. Signal. 7, re3 (2014).

Sci. Signal., 15 July 2014  Vol. 7, Issue 334, p. re3
http://dx.doi.org:/10.1126/scisignal.2005365


5. Nf k-beta signaling pathway

Cracking the NF-B Code

Karen E. Tkach, Jennifer E. Oyler, and Grégoire Altan-Bonnet*
ImmunoDynamics Group, Memorial Sloan Kettering Cancer Center, New York, NY 10065, USA.

Abstract: The discovery of feedback loops between signaling and gene expression is ushering in new quantitative models of cellular regulation. In a recent issue of Science Signaling, Sung et al. showed how positive feedback downstream of nuclear factor B (NF-B) signaling enhances the capacity of macrophages to scale their antimicrobial responses to the dose of pathogen-associated molecular cues. This finding stemmed from analysis of cell-to-cell variability and computational modeling of time integration between signaling and transcriptional responses. Ultimately, such quantitative approaches challenge the oft-assumed time separation of “fast” signal transduction followed by “slow” gene expression, and they provide a better understanding of complex biological regulation over long time scales.

Citation: K. E. Tkach, J. E. Oyler, G. Altan-Bonnet, Cracking the NF-B Code. Sci. Signal. 7, pe5 (2014).

Sci. Signal., 18 February 2014  Vol. 7, Issue 313, p. pe5
http://dx.doi.org:/10.1126/scisignal.2005108


Switching of the Relative Dominance Between Feedback Mechanisms in Lipopolysaccharide-Induced Nfk-B Signaling

Myong-Hee Sung1*, Ning Li2, Qizong Lao1, Rachel A. Gottschalk2, Gordon L. Hager1*, and Iain D. C. Fraser2*
1 Laboratory of Receptor Biology and Gene Expression, National Cancer Institute, 2 Laboratory of Systems Biology, National Institute of Allergy and Infectious Diseases, National Institutes of Health, Bethesda, MD 20892, USA.

Abstract: A fundamental goal in biology is to gain a quantitative understanding of how appropriate cell responses are achieved amid conflicting signals that work in parallel. Through live, single-cell imaging, we monitored both the dynamics of nuclear factor B (NF-B) signaling and inflammatory cytokine transcription in macrophages exposed to the bacterial product lipopolysaccharide (LPS). Our analysis revealed a previously uncharacterized positive feedback loop involving induction of the expression of Rela, which encodes the RelA (p65) NF-B subunit. This positive feedback loop rewired the regulatory network when cells were exposed to LPS above a distinct concentration. Paradoxically, this rewiring of NF-B signaling in macrophages (a myeloid cell type) required the transcription factor Ikaros, which promotes the development of lymphoid cells. Mathematical modeling and experimental validation showed that the RelA positive feedback overcame existing negative feedback loops and enabled cells to discriminate between different concentrations of LPS to mount an effective innate immune response only at higher concentrations. We suggest that this switching in the relative dominance of feedback loops (“feedback dominance switching”) may be a general mechanism in immune cells to integrate opposing feedback on a key transcriptional regulator and to set a response threshold for the host.

Citation: M.-H. Sung, N. Li, Q. Lao, R. A. Gottschalk, G. L. Hager, I. D. C. Fraser, Switching of the Relative Dominance Between Feedback Mechanisms in Lipopolysaccharide-Induced NF-B Signaling. Sci. Signal. 7, ra6 (2014).

Sci. Signal., 14 January 2014  Vol. 7, Issue 308, p. ra6
http://dx.doi.org:/10.1126/scisignal.2004764

Drug development in the Alzheimer’s field has been riddled with failures, and most research efforts have focused on pinpointing genetic and environmental factors responsible for causing or accelerating the progression of the disease.

Now, researchers from Montreal’s Douglas Mental Health Institute and McGill University have identified a relatively frequent genetic variant that may provide protection against the devastating neurodegenerative disease.

“We found that specific genetic variants in a gene called HMG CoA reductase which normally regulates cholesterol production and mobilization in the brain can interfere with, and delay the onset of Alzheimer’s disease by nearly four years. This is an exciting breakthrough in a field where successes have been scarce these past few years,” said Dr. Judes Poirier, whose previous research led to the discovery that a genetic variant was formally associated with the common form of Alzheimer’s disease.

This variant may explain why some people who are carriers of predisposing genetic factors for the common form of Alzheimer’s do not develop the disease, living long lives without memory problems until their nineties.


6.  P181 cAMP-mediated Rac1 activation regulates the re-establishment of endothelial adherens junctions and barrier restoration during inflammation.

M Aslam, H Nef, C Troidl, R Schulz, T Noll, C Hamm, D Guenduez

Cardiovascular research 07/2014; 103(suppl 1):S32.
http://dx.doi.org:/10.1093/cvr/cvu082.117
Source: PubMed

ABSTRACT Inflammatory mediators like thrombin and TNFα disrupt endothelial junctions and barrier integrity, leading to edema formation. This increase in endothelial permeability is followed by slow restoration of the endothelial barrier, which is critical for the maintenance of basal endothelial permeability. However, the molecular mechanism of recovery of the endothelial barrier in response to inflammatory mediators has not yet been well delineated. The aim of the present study was to explore the mechanism of this barrier restoration. Specific emphasis was given to the role of Rac1 GTPase activation, which is an important regulator of endothelial adherens junction (AJ) integrity.


7.  Thalidomide

Structure of the DDB1–CRBN E3 ubiquitin ligase in complex with thalidomide

Eric S. Fischer, Kerstin Böhm, John R. Lydeard, Haidi Yang, Michael B. Stadler, et al.
Nature (2014)     http://dx.doi.org:/10.1038/nature13527

In the 1950s, the drug thalidomide, administered as a sedative to pregnant women, led to the birth of thousands of children with multiple defects. Despite the teratogenicity of thalidomide and its derivatives lenalidomide and pomalidomide, these immunomodulatory drugs (IMiDs) recently emerged as effective treatments for multiple myeloma and 5q-deletion-associated dysplasia. IMiDs target the E3 ubiquitin ligase CUL4–RBX1–DDB1–CRBN (known as CRL4CRBN) and promote the ubiquitination of the IKAROS family transcription factors IKZF1 and IKZF3 by CRL4CRBN. Here we present crystal structures of the DDB1–CRBN complex bound to thalidomide, lenalidomide and pomalidomide. The structure establishes that CRBN is a substrate receptor within CRL4CRBN and enantioselectively binds IMiDs. Using an unbiased screen, we identified the homeobox transcription factor MEIS2 as an endogenous substrate of CRL4CRBN. Our studies suggest that IMiDs block endogenous substrates (MEIS2) from binding to CRL4CRBN while the ligase complex is recruiting IKZF1 or IKZF3 for degradation. This dual activity implies that small molecules can modulate an E3 ubiquitin ligase and thereby upregulate or downregulate the ubiquitination of proteins.

Figure 1: The overall structure of the DDB1–CRBN complex.

http://www.nature.com/nature/journal/vaop/ncurrent/carousel/nature13527-f1.jpg

a, Cartoon representation of the structure of the complex of human DDB1, G. gallus CRBN and thalidomide: DDB1, highlighting the domains BPA (red), BPB (magenta), BPC (orange) and DDB1-CTD (grey); G. gallus CRBN, highlighting the domain…

Figure 2: IMiD binding to CRBN.

http://www.nature.com/nature/journal/vaop/ncurrent/carousel/nature13527-f2.jpg

a, Chemical structure of lenalidomide. b, Chemical structure of pomalidomide. c, Sketch of thalidomide and its interactions with G. gallus CRBN. Hydrogen bonds are shown as dashed lines, and hydrophobic interactions are indicated as gr

Figure 3: CRBN is a substrate receptor in the ligase CRL4CRBN.

http://www.nature.com/nature/journal/vaop/ncurrent/carousel/nature13527-f3.jpg

a, Architecture of the CRL4DDB2 complex bound to DNA (PDB ID 4A0K). b, Model of CRL4CRBN bound to thalidomide. c, Firefly luciferase (Fluc) to Renillaluciferase (Rluc) ratios (Fluc:Rluc) of IKZF1-reporter-plasmid-transfected HEK 293T…


Figure 5: Molecular model of IMiD function.

http://www.nature.com/nature/journal/vaop/ncurrent/carousel/nature13527-f5.jpg

a, Thalidomide binds to CRBN at the canonical substrate-binding site. b, The potent anti-myeloma drug thalidomide and its derivatives lenalidomide and pomalidomide occupy the same site but with different solvent-exposed moieties. c, Bi…


8. Preeclampsia of pregnancyand protein misfolding

Protein misfolding, congophilia, oligomerization, and defective amyloid processing in preeclampsia

Irina A. Buhimschi1,2,*, Unzila A. Nayeri2, Guomao Zhao1, Lydia L. Shook2, Anna Pensalfini3, et al.
1Center for Perinatal Research, The Research Institute at Nationwide Children’s Hospital and Department of Pediatrics, 4Depart of ObGyn, The Ohio State University College of Medicine, Columbus, OH
2Depart of ObGyn and Reproductive Sciences, Yale University School of Medicine, New Haven, CT

3Center for Dementia Research, Nathan Kline Institute for Psychiatric Research and Department of Psychiatry, New York University School of Medicine, New York, NY
5Depart of ObGyn and Reproductive Sciences, University of Vermont College of Medicine, Burlington, VT .
6Department of Molecular Biology and Biochemistry, University of California, Irvine, Irvine, CA 92617, USA.
7Department of Biochemistry and Experimental Biochemistry Unit, King Abdulaziz Univ, Jeddah , Saudi Arabia.

Preeclampsia is a pregnancy-specific disorder of unknown etiology and a leading contributor to maternal and perinatal morbidity and mortality worldwide. Because there is no cure other than delivery, preeclampsia is the leading cause of iatrogenic preterm birth. We show that preeclampsia shares pathophysiologic features with recognized protein misfolding disorders. These features include urine congophilia (affinity for the amyloidophilic dye Congo red), affinity for conformational state–dependent antibodies, and dysregulation of prototype proteolytic enzymes involved in amyloid precursor protein (APP) processing. Assessment of global protein misfolding load in pregnancy based on urine congophilia (Congo red dot test) carries diagnostic and prognostic potential for preeclampsia. We used conformational state–dependent antibodies to demonstrate the presence of generic supramolecular assemblies (prefibrillar oligomers and annular protofibrils), which vary in quantitative and qualitative representation with preeclampsia severity. In the first attempt to characterize the preeclampsia misfoldome, we report that the urine congophilic material includes proteoforms of ceruloplasmin, immunoglobulin free light chains, SERPINA1, albumin, interferon-inducible protein 6-16, and Alzheimer’s β-amyloid. The human placenta abundantly expresses APP along with prototype APP-processing enzymes, of which the α-secretase ADAM10, the β-secretases BACE1 and BACE2, and the γ-secretase presenilin-1 were all up-regulated in preeclampsia. The presence of β-amyloid aggregates in placentas of women with preeclampsia and fetal growth restriction further supports the notion that this condition should join the growing list of protein conformational disorders. If these aggregates play a pathophysiologic role, our findings may lead to treatment for preeclampsia.

Citation: I. A. Buhimschi, U. A. Nayeri, G. Zhao, L. L. Shook, A. Pensalfini, E. F. Funai, I. M. Bernstein, C. G. Glabe, C. S. Buhimschi,Protein misfolding, congophilia, oligomerization, and defective amyloid processing in preeclampsia. Sci. Transl. Med. 6, 245ra92 (2014).


9. Blood Clotting

Removing parts of shape-shifting protein explains how blood clots

prothrombin (FII)

prothrombin (FII)


Using x-ray crystallography, SLU researchers published the first image of the important blood-clotting protein prothrombin (coagulation factor II). The protein’s flexible structure is key to the development of blood-clotting.In results recently published in Proceedings of the National Academy of Sciences (PNAS), Saint Louis University scientists have discovered that removal of disordered sections of a protein’s structure reveals the molecular mechanism of a key reaction that initiates blood clotting.

Enrico Di Cera, M.D., chair of the Edward A. Doisy department of biochemistry and molecular biology at Saint Louis University, studies thrombin, a key vitamin K-dependent blood-clotting protein, and its inactive precursor prothrombin (or coagulation factor II).

“Prothrombin is essential for life and is the most important clotting factor,” Di Cera said. “We are proud to report that our lab here at SLU has finally succeeded in crystallizing prothrombin for the first time.”

Blood-clotting has long ensured our survival, stopping blood loss after an injury. However, when triggered in the wrong circumstances, clotting can lead to debilitating or fatal conditions such as a heart attack, stroke or deep vein thrombosis.

Before thrombin becomes active, it circulates throughout the blood in the inactive (zymogen) form called prothrombin. When the active enzyme is needed (after a vascular injury, for example), the coagulation cascade is initiated and prothrombin is converted into the active enzyme thrombin that causes blood to clot.

X-ray crystallography is one tool in scientists’ toolbox for understanding processes at the molecular level. It offers a way to obtain a “snap shot” of a protein’s structure.

In this technique, scientists grow crystals of the protein they want to study, shoot x-rays at them and record data about the way the rays are scattered by crystals. Then they use computer programs to create an image of the protein based on that data.

Once scientists can visualize the three dimensional structure of a molecule, they can begin to piece together the way in which the protein functions and interacts with other molecules in the body, or with drugs.

Last year, Di Cera and colleagues published the first structure of prothrombin. This first structure lacked a domain responsible for interaction with membranes and certain other sections were not detected by x-ray analysis. Though the scientists were able to crystallize the protein, there were disordered regions in the structure that they could not see.

Within prothrombin there are two kringle domains (looped sections of a protein named after the Scandinavian pastry) connected by a “linker” region that intrigued the SLU investigators because of its intrinsic disorder.

“We deleted this linker and crystals grew in a few days instead of months, revealing for the first time the full architecture of prothrombin,” Di Cera said.

In addition to this remarkable discovery, Di Cera and colleagues found that the deleted version of prothrombin is activated to thrombin much faster than the intact prothrombin. The structure without the disordered linker is in fact optimized for conversion to thrombin and reveals key information on the mechanism of prothrombin activation.

For over four decades, scientists have tried to crystallize prothrombin but without success.

“It took us almost two years to discover that the disordered linker was the key,” Di Cera said.  “Finally, prothrombin revealed its secrets and with that the molecular mechanism of a key reaction of blood clotting finally becomes amenable to rational drug design for therapeutic intervention.”

SLU researchers Nicola Pozzi, Ph.D., Zhiwei Chen, Leslie Pelc and Daniel Shropshire also are authors on the paper.

Read Full Post »

Larry H Bernstein, MD, FCAP, Reporter and Curator

http://pharmaceyticalinnovation.com/7/10/2014/A new relationship identified in preterm stress and development of autism or schizophrenia/


This is a fascinating study.  It is of considerable interest because it deals with several items that need to be addressed with respect to neurodevelopmental disruptive disorders.  It leaves open some aspects that are known, but not subject to investigation in the experiments.  Then there is also no reporting of some associations that are known at the time of deveopment of these disorders – autism spectrum, and schizophrenia.  Of course, I don’t know how it would be possible to also look at prediction of a possible relationship to later development of mood disorders.

  1. The placenta functions as an endocrine organ in the conversion of androsteinedione to testosterone during pregnancy, which is delivered to the fetus.
  2. The conversion is by a known enzymatic pathway – and there is a sex difference in the depression of testosterone in males, females not affected.
  3. There is a greater susceptibility of males to autism and schizophrenia than of females, which I as reader, had not known, but if this is true, it would lend some credence to a biological advantage to protect the females of animal species, and might raise some interest into what relationship it has to protecting multitasking for females.
  4. It is well known that the twin studies that have been carried out determined that in identical twins, there is discordance as a rule.  Those studies are old, and they did not examine whether the other identical twin might be anywhere on the autism spectrum disorder (not then termed “spectrum”.
  5. However, there is a clear effect of stress on “gene expression”, and in this case we are looking at enzymation suppression at the placental level affecting trascriptional activity in the male fetus.  The same genetic signature exists in the male genetic profile, so we are not looking at a clear somatic mutation in this study.
  6. There is also much less specific an association with the MTHFR gene mutation at either one or two loci. This would have to be looked at as a possible separate post translational somatic mutation.
  7. Whether there is another component expressed later in the function of the zinc metalloproteinase under stress in the affected subject is worth considering, but can’t be commented on with respect to the study.

Penn Team Links Placental Marker of Prenatal Stress to Neurodevelopmental Problems 

By Ilene Schneider          July 8, 2014

When a woman experiences a stressful event early in pregnancy, the risk that her child will develop autism spectrum disorders or schizophrenia increases. The way in which maternal stress is transmitted to the brain of the developing fetus, leading to these problems in neurodevelopment, is poorly understood.

New findings by University of Pennsylvania School of Veterinary Medicine scientists suggest that an enzyme found in the placenta is likely playing an important role. This enzyme, O-linked-N-acetylglucosamine transferase, or OGT, translates maternal stress into a reprogramming signal for the brain before birth. The study was supported by the National Institute of Mental Health.

“By manipulating this one gene, we were able to recapitulate many aspects of early prenatal stress,” said Tracy L. Bale, senior author on the paper and a professor in the Department of Animal Biology at Penn Vet. “OGT seems to be serving a role as the ‘canary in the coal mine,’ offering a readout of mom’s stress to change the baby’s developing brain. Bale, who also holds an appointment in the Department of Psychiatry, co-authored tha paper with postdoctoral researcher Christopher L. Howerton, for PNAS.

OGT is known to play a role in gene expression through chromatin remodeling, a process that makes some genes more or less available to be converted into proteins. In a study published last year in PNAS, Bale’s lab found that placentas from male mice pups had lower levels of OGT than those from female pups, and placentas from mothers that had been exposed to stress early in gestation had lower overall levels of OGT than placentas from the mothers’ unstressed counterparts.

“People think that the placenta only serves to promote blood flow between a mom and her baby, but that’s really not all it’s doing,” Bale said. “It’s a very dynamic endocrine tissue and it’s sex-specific, and we’ve shown that tampering with it can dramatically affect a baby’s developing brain.”

To elucidate how reduced levels of OGT might be transmitting signals through the placenta to a fetus, Bale and Howerton bred mice that partially or fully lacked OGT in the placenta. They then compared these transgenic mice to animals that had been subjected to mild stressors during early gestation, such as predator odor, unfamiliar objects or unusual noises, during the first week of their pregnancies.

The researchers performed a genome-wide search for genes that were affected by the altered levels of OGT and were also affected by exposure to early prenatal stress using a specific activational histone mark and found a broad swath of common gene expression patterns.

They chose to focus on one particular differentially regulated gene called Hsd17b3, which encodes an enzyme that converts androstenedione, a steroid hormone, to testosterone. The researchers found this gene to be particularly interesting in part because neurodevelopmental disorders such as autism and schizophrenia have strong gender biases, where they either predominantly affect males or present earlier in males.

Placentas associated with male mice pups born to stressed mothers had reduced levels of the enzyme Hsd17b3, and, as a result, had higher levels of androstenedione and lower levels of testosterone than normal mice.

“This could mean that, with early prenatal stress, males have less masculinization,” Bale said. “This is important because autism tends to be thought of as the brain in a hypermasculinized state, and schizophrenia is thought of as a hypomasculinized state. It makes sense that there is something about this process of testosterone synthesis that is being disrupted.”

Furthermore, the mice born to mothers with disrupted OGT looked like the offspring of stressed mothers in other ways. Although they were born at a normal weight, their growth slowed at weaning. Their body weight as adults was 10 to 20 percent lower than control mice.

Because of the key role that that the hypothalamus plays in controlling growth and many other critical survival functions, the Penn Vet researchers then screened the mouse genome for genes with differential expression in the hypothalamus, comparing normal mice, mice with reduced OGT and mice born to stressed mothers.

They identified several gene sets related to the structure and function of mitochrondria, the powerhouses of cells that are responsible for producing energy. And indeed, when compared by an enzymatic assay that examines mitochondria biogenesis, both the mice born to stressed mothers and mice born to mothers with reduced OGT had dramatically reduced mitochondrial function in their hypothalamus compared to normal mice. These studies were done in collaboration with Narayan Avadhani’s lab at Penn Vet. Such reduced function could explain why the growth patterns of mice appeared similar until weaning, at which point energy demands go up.

“If you have a really bad furnace you might be okay if temperatures are mild,” Bale said. “But, if it’s very cold, it can’t meet demand. It could be the same for these mice. If you’re in a litter close to your siblings and mom, you don’t need to produce a lot of heat, but once you wean you have an extra demand for producing heat. They’re just not keeping up.”

Bale points out that mitochondrial dysfunction in the brain has been reported in both schizophrenia and autism patients. In future work, Bale hopes to identify a suite of maternal plasma stress biomarkers that could signal an increased risk of neurodevelopmental disease for the baby.

“With that kind of a signature, we’d have a way to detect at-risk pregnancies and think about ways to intervene much earlier than waiting to look at the term placenta,” she said.


Read Full Post »

« Newer Posts