Development Of Super-Resolved Fluorescence Microscopy
Author and Curator: Larry H. Bernstein, MD, FCAP
CSO, Leaders in Pharmaceutical Business Intelligence

Article ID #153: Development Of Super-Resolved Fluorescence Microscopy. Published on 10/12/2014
WordCloud Image Produced by Adam Tubman
Development Of Super-Resolved Fluorescence Microscopy
Part I. Nobel Prize For Chemistry 2014: Eric Betzig, Stefan W. Hell
and William E. Moerner Honored For Development Of Super-
Resolved Fluorescence Microscopy
The 2014 Nobel Prize in Chemistry was awarded on 10/08/2014 to
Eric Betzig, Stefan W. Hell and William E. Moerner for
“the development of super-resolved fluorescence microscopy.”
The invention of the electron microscope by Max Knoll and Ernst Ruska at the
Berlin Technische Hochschule in 1931 finally overcame the barrier to higher
resolution that had been imposed by the limitations of visible light. Since then
resolution has defined the progress of the technology.
The ultimate goal was atomic resolution – the ability to see atoms – but this would
have to be approached incrementally over the course of decades. The earliest microscopes merely proved the concept: electron beams could, indeed, be tamed
to provide visible images of matter. By the late 1930s electron microscopes with theoretical resolutions of 10 nm were being designed and produced, and by 1944
this was further reduced to 2 nm. (The theoretical resolution of a an optical light microscope is 200 nm.)
Increases in the accelerating voltage of the electron beam accounted for much of
the improvement in resolution. But voltage was not everything. Improvements in electron lens technology minimized aberrations and provided a clearer picture,
which also contributed to improved resolution, as did better vacuum systems and brighter electron guns. So increasing the resolution of electron microscopes was a main driving force throughout the instrument’s development.
With nanoscopy, scientists could observe viruses, proteins and molecules there
are smaller than 0.0000002 metres.
Three researchers won the 2014 Nobel Prize in Chemistry on Wednesday,
October 8, for giving microscopes much sharper vision than was thought possible, letting scientists peer into living cells with unprecedented detail to seek the roots
of disease. It was awarded to U.S. researchers Eric Betzig and William Moerner
and German scientist Stefan Hell. They found ways to use molecules that glow on demand to overcome what was considered a fundamental limitation for optical microscopes.
Hell, 52, of Germany, is the director at the Max Planck Institute for Biophysical Chemistry and the division head at the German Cancer Research Center in
Heidelberg. He was honored for his work on fluorescence microscopy, a kind
of nano-flashlight where scientists use fluorescent molecules to see parts of a
cell. Later in his career, he developed the STED microscope, which collects light
from “a multitude of small volumes to create a whole.”
Moerner, a 61-year-old professor in chemistry and applied physics at Stanford University in California, is the recipient of the 2008 Wolf Prize in Chemistry, the
2009 Irving Langmuir Award and the 2013 Peter Debye Award. In 1989, he
was the first scientist to be able to measure the light absorption of a single molecule.
This inspired many chemists to begin focusing on single molecules, including Betzig.
Betzig, 54, the group leader at Janelia Farm Research campus at the Howard
Hughes Medical Institute in Virginia, developed new optical imaging tools for
biology. His work involved taking images of the same area multiple times, and illuminating just a few molecules each time. These images were then
superimposed to create a dense super image at the nano level,
The limitation of optical microscopy was thought to have been determined in a calculation published in 1873 that defined the limit of how tiny a detail could be revealed by optical microscopes. Based on experimental evidence and basic principles of physics, Ernst Abbe and Lord Rayleigh defined and formulated
this diffraction-limited resolution in the late 19th century (Abbe, 1873; Rayleigh,
1896). However, only cellular structure and objects that were at least 200 to
350 nm apart could be resolved by light microscopy because, the optical resolution
of light microscopy was limited to approximately half of the wavelength of the light used. Later key innovations—including fluorescence and confocal laser scanning microscopy (CLSM)—made optical microscopy one of the most powerful and
versatile diagnostic tools in modern cell biology. Using highly specific fluorescent labeling techniques such as immunocytochemistry, in situ hybridization, or
fluorescent protein tags, the spatial distribution and dynamics of virtually every subcellular structure, protein, or genomic sequence of interest can be analyzed in chemically fixed or living samples (Conchello and Lichtman, 2005; Giepmans et al., 2006).
The result of their advance is “really a window into the cell which we didn’t have before,” said Catherine Lewis, director of the cell biology and biophysics division
of the National Institute of General Medical Sciences in Bethesda, Maryland.
“You can observe the behavior of individual molecules in living cells in real time.
You can see … molecules moving around inside the cell. You can see them interacting with each other.”
The research of the three men has let scientists study diseases such as
Parkinson’s, Alzheimer’s and Huntington’s at a molecular level, the Royal
Swedish Academy of Sciences said.
Part II. Electron microscopy limitations
Manfred Von Ardenne in Berlin produced the earliest scanning-transmission
electron microscope in 1937. At the University of Toronto in Canada, Cecil Hall, James Hillier, and Albert Prebus, working under the direction of Eli Burton,
produced an advanced 1938 Toronto Model electron microscope that would
later become the basis for Radio Corporation of America’s Model B, the first commercial electron microscope in North America. Ruska at Siemens in
Germany produced the first commercial electron microscope in the world in 938.
Starting in 1939, scientists in Japan gathered to decide on the best way to build
an electron microscope. This group evolved into the Japan Electron Optics Laboratory (JEOL) that would eventually produce more models and varieties
of electron microscopes than any other company. Hitachi and Toshiba in Japan
also played a major role in the early development process.
The 1960s through the 1990s produced many innovative instruments and trends.
The introduction of the first commercial scanning electron microscopes (SEMs)
in 1965 opened up a new world of analysis for materials scientists. Ultrahigh
voltage TEM instruments (up to 3 MeV at CEMES-LOE/CNRS in Toulouse,
France, and at Hitachi in Tokyo, Japan), in the 1960s and 1970s gave electrons higher energy to penetrate more deeply into thick samples. The evolution and incorporation of other detectors (electron microprobes, electron energy loss spectroscopy (EELS), etc.) made the SEM into a true analytical electron
microscope (AEM) beginning in the 1970s. The development of brighter
electron sources, such as the lanthanum hexaboride filament (LAB6) and the
field emission gun in the 1960s, and their commercialization in the 1970s
brought researchers a brighter source of electrons and with it better imaging
and resolution. Tilting specimen stages permitting examination of the specimen
from different angles aided significantly in the determination of crystal structure.
In the late 1980s and throughout the 1990s, the environmental electron
microscopes that allow scientists to examine samples under more natural
conditions of temperature and pressure have dramatically expanded the
types of samples that can be examined.
In medicine, the EM made a unique contribution to diagnostic anatomic
pathology in renal biopsy analysis. However, the small sample had to be
embedded, and in the early days one cut the specimen by breaking glass
for the cutting of the specimen. But even though EM ushered in a new era of molecular pathology, the contribution was limited, despite incremental
improvements.
In the past, the use of microscopes was limited by a physical restriction;
scientists could only see items that were larger than roughly half the
wavelength of light (.2 micrometers). However, the groundbreaking work
of the Nobel laureates bypassed the maximum resolution of traditional
microscopes and launched optical microscopy into the nanodimension.
Part III. Super resolution fluorescence microscopy
Bo Huang,1,2 Mark Bates,3 and Xiaowei Zhuang1,2,4
Author information ► Copyright and License information ►
Annu Rev Biochem. 2009; 78: 993–1016.
http://dx.doi.org:/10.1146/annurev.biochem.77.061906.092014
PMCID: PMC2835776 NIHMSID: NIHMS179491
Achieving a spatial resolution that is not limited by the diffraction of
light, recent developments of super-resolution fluorescence microscopy
techniques allow the observation of many biological structures not
resolvable in conventional fluorescence microscopy. New advances
in these techniques now give them the ability to image three-dimensional
(3D) structures, measure interactions by multicolor colocalization, and
record dynamic processes in living cells at the nanometer scale. It is
anticipated that super-resolution fluorescence microscopy will become
a widely used tool for cell and tissue imaging to provide previously
unobserved details of biological structures and processes.
Keywords: Sub-diffraction limit, single-molecule, multicolor imaging,
three-dimensional imaging, live cell imaging, single-particle tracking,
photoswitchable probe
Among the various microscopy techniques, fluorescence microscopy is
one of the most widely used because of its two principal advantages:
Specific cellular components may be observed through molecule-specific
labeling, and light microscopy allows the observation of structures inside
a live sample in real time. Compared to other imaging techniques such
as electron microscopy (EM), however, conventional fluorescence
microscopy is limited by relatively low spatial resolution because of the
diffraction of light. This diffraction limit, about 200–300 nm in the lateral
direction and 500–700 nm in the axial direction, is comparable to or larger
than many subcellular structures, leaving them too small to be observed in
detail. In recent years, a number of “super-resolution” fluorescence microscopy techniques have been invented to overcome the diffraction barrier, including techniques that employ nonlinear effects to sharpen the point-spread function
of the microscope, such as stimulated emission depletion (STED) microscopy
(1, 2), related methods using other reversible saturable optically linear
fluorescence transitions (RESOLFTs) (3), and saturated structured-illumination microscopy (SSIM) (4), as well as techniques that are based on the localization
of individual fluorescent molecules, such as stochastic optical reconstruction microscopy (STORM) (5), photoactivated localization microscopy (PALM) (6),
and fluorescence photoactivation localization microscopy (FPALM) (7). These methods have yielded an order of magnitude improvement in spatial resolution
in all three dimensions over conventional light microscopy.
THE RESOLUTION LIMIT IN OPTICAL MICROSCOPY
Microscopes can be used to visualize fine structures in a sample by providing
a magnified image. However, even an arbitrarily high magnification does not
translate into the ability to see infinitely small details. Instead, the resolution
of light microscopy is limited because light is a wave and is subject to diffraction.
The diffraction limit
An optical microscope can be thought of as a lens system that produces a
magnified image of a small object. In this imaging process, light rays from
each point on the object converge to a single point at the image plane. However,
the diffraction of light prevents exact convergence of the rays, causing a sharp
point on the object to blur into a finite-sized spot in the image. The three-
dimensional (3D) intensity distribution of the image of a point object is called
the point spread function (PSF). The size of the PSF determines the resolution
of the microscope: Two points closer than the full width at half-maximum
(FWHM) of the PSF will be difficult to resolve because their images overlap substantially.
The FWHM of the PSF in the lateral directions (the x–y directions perpendicular
to the optical axis) can be approximated as Δxy ≈ 0.61λ / NA, where λ is the wavelength of the light, and NA is the numerical aperture of the objective
defined as NA = n sinα, with n being the refractive index of the medium and
α being the half-cone angle of the focused light produced by the objective.
The axial width of the PSF is about 2–3 times as large as the lateral width
for ordinary high NA objectives. When imaging with visible light (λ ≈ 550 nm),
the commonly used oil immersion objective with NA = 1.40 yields a PSF with
a lateral size of ~200 nm and an axial size of ~500 nm in a refractive index-
matched medium (Figure 1) (8).
Figure 1
The PSF of a common oil immersion objective with NA = 1.40, showing the
focal spot of 550 nm light in a medium with refractive index n = 1.515. The
intensity distribution in the x-z plane of the focus spot is computed numerically.

PFS of oil immersion microscope
Because the loss of high-frequency spatial information in optical microscopy
results from the diffraction of light when it propagates through a distance larger
than the wavelength of the light (far field), near-field microscopy is one of the
earliest approaches sought to achieve high spatial resolution. By exciting the fluorophores or detecting the signal through the nonpropagating light near the fluorophore, high-resolution information be retained. Near-field scanning optical microscopy (NSOM) acquires an image by scanning a sharp probe tip across
the sample, typically providing a resolution of 20–50 nm (9–11). Wide-field
imaging has also been recently demonstrated in the near-field regime using
a super lens with negative refractive index (12, 13). However, the short range
of the near-field region (tens of nanometers) compromises the ability of light microscopy to look into a sample, limiting the application of near-field microscopy
to near-surface features only. This limit highlights the need to develop far-field
high-resolution imaging methods.
Among far-field fluorescence microscopy techniques, confocal and multiphoton microscopy are among the most widely used to moderately enhance the spatial resolution (14, 15). By combining a focused laser for excitation and a pinhole for detection, confocal microscopy can, in principle, have a factor of √2 improvement
in the spatial resolution. In multiphoton microscopy, nonlinear absorption processes reduce the effective size of the excitation PSF. However, this gain in the PSF size
is counteracted by the increased wavelength of the excitation light. Thus, instead
of improving the resolution, the main advantage of confocal and multi-photon microscopy over wide-field microscopy is the reduction of out-of-focus fluorescence background, allowing optical sectioning in 3D imaging.
Two techniques, 4Pi and I5M microscopy, approach this ideal situation by using
two opposing objectives for excitation and/or detection (16, 17). By acquiring
multiple images with illumination patterns of different phases and orientations,
a high-resolution image can be reconstructed. Because the illumination pattern
itself is also limited by the diffraction of light, structured illumination microscopy
(SIM) is only capable of doubling the spatial resolution by combining two diffraction-limited sources of information. The best achievable result using these methods
would be an isotropic PSF with an additional factor of 2 in resolution improvement. This would correspond to ~100-nm image resolution in all three dimensions, as
has been demonstrated by the I5S technique, which combines I5M and SIM (22). Albeit a significant improvement, this resolution is still fundamentally limited by
the diffraction of light.
SUPER RESOLUTION FLUORESCENCE MICROSCOPY BY SPATIALLY PATTERNED EXCITATION
One approach to attain a resolution far beyond the limit of diffraction, i.e., to
realize super-resolution microscopy, is to introduce sub-diffraction-limit features
in the excitation pattern so that small-length-scale information can be read out.
We refer to this approach, including STED, RESOLFT, and SSIM, as super-
resolution microscopy by spatially patterned excitation or the “patterned excitation” approach.
The concept of STED microscopy was first proposed in 1994 (1) and subsequently demonstrated experimentally (2). Simply speaking, it uses a second laser (STED laser) to suppress the fluorescence emission from the fluorophores located off the center of the excitation. This suppression is achieved through stimulated emission: When an excited-state fluorophores encounters a photon that matches the energy difference between the excited and the ground state, it can be brought back to
the ground state through stimulated emission before spontaneous fluorescence emission occurs. This process effectively depletes excited-state fluorophores
capable of fluorescence emission (Figure 2a,b).
Figure 2
The principle of STED microscopy. (a) The process of stimulated emission. A
ground state (S0) fluorophore can absorb a photon from the excitation light and
jump to the excited state (S1).

STED microsopy
The pattern of the STED laser is typically generated by inserting a phase mask
into the light path to modulate its phase-spatial distribution (Figure 2b). One such phase mask generates a donut-shaped STED pattern in the xy plane (Figure 2c)
and has provided an xy resolution of ~30 nm (24). STED can also be employed
in 4Pi microscopy (STED-4Pi), resulting in an axial resolution of 30–40 nm (25). STED has been applied to biological samples either immuno-stained with
fluorophore labeled antibodies (26) or genetically tagged with fluorescent
proteins (FPs) (27). Dyes with high photostability under STED conditions and
large stimulated emission cross sections in the visible to near infrared (IR) range
are preferred. Atto 532 and Atto 647N are among the most often used dyes for
STED microscopy.
Stimulated emission is not the only mechanism capable of suppressing
undesired fluorescence emission. A more general scheme using saturable
depletion to achieve super resolution has been formalized with the name
RESOLFT microscopy (3). This scheme employs fluorescent probes that
can be reversibly photoswitched between a fluorescent on state and a dark
off state. The off state can be the ground state of a fluorophores as in the
case of STED, the triplet state as in ground-state-depletion microscopy
(28, 29), or the dark state of a reversibly photoswitchable fluorophore (30). RESOLFT has been demonstrated using a reversibly photoswitchable
fluorescent protein as FP595 which leads to a resolution better than 100 nm
at a depletion laser intensity of 600 W/cm2(30).
The same concept of employing saturable processes can also be applied
to SIM by introducing sub-diffraction-limit spatial features into the excitation
pattern. SSIM has been demonstrated using the saturation of fluorescence
emission, which occurs when a fluorophore is illuminated by a very high
intensity of excitation light (4). Under this strong excitation, it is immediately
pumped to the excited state each time it returns to the ground state. In SSIM,
where the sample is illuminated with a sinusoidal pattern of strong excitation
light, the peaks of the excitation pattern can be clipped by fluorescence
saturation and become flat, whereas fluorescence emission is still absent
from the zero points in the valleys (Figure 3a). These effects add higher order
spatial frequencies to the excitation pattern. Mixing this excitation pattern with
the high-frequency spatial features in the sample can effectively bring the sub-diffraction-limit spatial features into the detection range of the microscopy
(Figure 3b).
Figure 3
The principle of SSIM. (a) The generation of the illumination pattern. A
diffractive grating in the excitation path splits the light into two beams. Their interference after emerging from the objective and reaching the sample creates
a sinusoidal illumination

SSIM
Although the image of a single fluorophore, which resembles the PSF, is a
finite-sized spot, the precision of determining the fluorophores position from
its image can be much higher than the diffraction limit, as long as the image
results from multiple photons emitted from the fluorophore. Fitting an image
consisting of N photons can be viewed as N measurements of the fluorophore position, each with an uncertainty determined by the PSF (8), thus leading to
a localization precision approximated by:
Δloc≈ΔN−−√
where Δloc is the localization precision and Δ is the size of the PSF. This
scaling of the localization precision with the photon number allows super-
resolution microscopy with a resolution not limited by the diffraction of light.
High-precision localization of bright light has reached a precision as high
as ~1 Å (33). Taking advantage of single-molecule detection and imaging
(34, 35), nanometer localization precision has been achieved for single
fluorescent molecules (36).
Using fluorescent probes that can switch between a fluorescent and a dark
state, a recent invention overcomes this barrier by separating in the time
domain the otherwise spatially overlapping fluorescent images. In this approach, molecules within a diffraction limited region can be activated at different time
points so that they can be individually imaged, localized, and subsequently deactivated (Figure 4). Massively parallel localization is achieved through
wide-field imaging, so that the coordinates of many fluorophores can be
mapped and a super-resolution images subsequently reconstructed. This
concept has been independently conceived and implemented by three labs,
and it was given the names STORM (5), PALM (6), and FPALM (7), respectively.
Iterating the activation and imaging process allows the locations of many
fluorophores to be mapped and a super-resolution image to be constructed
from these fluorophore locations. In the following, we refer to this approach
as super-resolution microscopy by single-molecule localization.
Figure 4
The principle of stochastic optical reconstruction microscopy (STORM), photoactivated localization microscopy (PALM), and fluorescence photo-
activation localization microscopy (FPALM). Different fluorescent probes
marking the sample structure are activated.

STORM
After capturing the images with a digital camera, the point-spread functions
of the individual molecules are localized with high precision based on the
photon output before the probes spontaneously photo-bleach or switch to
a dark state. The positions of localized molecular centers are indicated with
black crosses. The process is repeated in Figures (c) through (e) until all of
the fluorescent probes are exhausted due to photo-bleaching or because the background fluorescence becomes too high. The final super-resolution image
(Figure (f)) is constructed by plotting the measured positions of the fluorescent probes.
http://microscopyu.com/tutorials/flash/superresolution/storm/index.html
The resolution of this technique is limited by the number of photons detected
per photoactivation event, which varies from several hundred for FPs (6) to
several thousand for cyanine dyes such as Cy5 (5, 46). These numbers
theoretically allow more than an order of magnitude improvement in spatial
resolution according to the √N scaling rule. In practice, a lateral resolution
of ~20 nm has been established experimentally using the photoswitchable
cyanine dyes (5, 46). Super-resolution images of biological samples have
been reported with directly labeled DNA structures and immunostained DNA-
protein complexes in vitro (5) as well as with FPtagged or immunostained
cellular structures (6, 44, 46).
Table 1 Photoswitchable fluorophores used in super resolution
fluorescence microscopy

Photoswitchable fluorophores
Recent advances in super-resolution fluorescence microscopy
(including the capability for 3D, multicolor, live-cell imaging) enable
new applications in biological samples. These technical advances
were made possible through the development of both imaging optics
and fluorescent probes.
- 3D imaging using the single-molecule localization approach
- 3D imaging using the patterned excitation approach
- Multicolor imaging
- Multicolor imaging using the patterned excitation approach
- Multicolor imaging using the single-molecule localization approach
Fluorescence imaging of a live cell has two requirements: specific labeling
of the cell and a time resolution that is high enough to record relevant
dynamics in the cell. Many fluorescent proteins and organic dyes, including
cyanine dyes (46) and caged dyes, have been shown switchable in live cells.
Because STED has a much smaller PSF than scanning confocal microscopy,
STED would inherently take more time to scan though the same size of image
field. By increasing the scanning speed and limiting the field of view to a few µm, Westphal and coworkers have observed Brownian motion of a dense suspension
of nanoparticles with an impressive rate of 80 frames per second (fps) using
STED microscopy (63). More recently, they have demonstrated video-rate
(28 fps) imaging of live hippocampal neurons and observed the movement of individual synaptic vesicles with 60–80-nm resolution (64).
Sub-diffraction-limit imaging of focal adhesion proteins in live cells has recently
been demonstrated (65). Photoswitchable fluorescent protein, EosFP, was used
to label the focal adhesion protein paxillin. A time resolution of ~25–60 seconds
per frame was obtained, and during this time interval, approximately 103
fluorophores were activated and localized per square micrometer, providing
an effective resolution of 60–70 nm by the Nyquist criterion (65). More recently, super-resolution imaging has also been demonstrated in live bacteria with photoswitchable enhanced yellow fluorescent protein (EYFP), allowing the
MreB structure in the cell to be traced (66).
The optical resolution
Optical resolution is the intrinsic ability of a given method to resolve a structure
and can be defined as the ability to distinguish two point sources in proximity.
For the patterned excitation approaches, such as STED, SSIM, and RESOLFT,
the optical resolution is represented by the size of the effective PSF. For the
single-molecule localization approach, such as STORM/PALM/FPALM, the
precision of determining the positions of individual fluorescent probes is the
principal measure of optical resolution.
By using a spatially patterned excitation profile, this approach achieves super resolution by generating an effective excitation volume with dimensions far
below the diffraction limit. Taking STED as an example, the sharpness of the
PSF results from the saturation of depletion of excited-state fluorophores in
the region neighboring the zero point of the STED laser (which coincide with
the focal point of the excitation laser). With an increasing STED laser power,
the saturated region expands toward the zero point, but fluorophores at the
zero point are not affected by the STED laser if the zero point is strictly kept
at zero intensity. Therefore, a theoretically unlimited gain in spatial resolution
may be achieved if the zero point in the depletion pattern is ideal.
The single-molecule localization approach achieves super resolution through
high precision localization of individual fluorophores. The number of photons
collected from a fluorophore is a principal factor limiting the localization
precision and hence the resolution of the final image.
Several photoswitchable fluorophores have been reported to give thousands
of photons detected per activation event [e.g., 6000 from Cy5 (46)].With the
PSF fitting procedure and the mechanical stability of the system optimized,
the background signal suppressed, and the nonuniformity of camera pixels
corrected, optical resolution of just a few nanometers could potentially be
achieved, reaching the molecular scale. As in the case of the patterned
excitation approach, the optical resolution here is also unlimited, in principle,
given a sufficient number of photons detected from the fluorescent probes.
Part III. A guide to super-resolution fluorescence microscopy
L Schermelleh1, R Heintzmann2,3,4, and H Leonhardt1
JCB Jul 19, 2010 // 190(2): 165-175
The Rockefeller University Press,
http://dx.doi.org:/10.1083/jcb.201002018
Based on experimental evidence and basic principles of physics, Ernst Abbe
and Lord Rayleigh defined and formulated this diffraction-limited resolution in
the late 19th century (Abbe, 1873; Rayleigh, 1896). Later key innovations—including fluorescence and confocal laser scanning microscopy (CLSM)—made optical microscopy one of the most powerful and versatile diagnostic
tools in modern cell biology.
The optical resolution defines the physical limit of the smallest structure it
can resolve. When imaging a biological sample, the effective resolution is
also affected by several sample-specific factors, including the labeling density,
probe size, and how well the ultrastructures are preserved during sample
preparation.
The diffraction (Abbe) limit of detection
Resolution is often defined as the largest distance at which the image of
two point-like objects seems to amalgamate. Thus, most resolution criteria
(Rayleigh limit,Sparrow limit, full width at half maximum of the PSF) directly
relate to properties of the PSF. These are useful resolution criteria for visible
observation of specimen, but there are several shortcomings of such a definition
of resolution: (1) Knowing that the image is an image of two particles, these
can in fact be discriminated with the help of a computer down to arbitrary
smaller distances. Determining the positions of two adjacent particles thus
becomes a question of experimental precision and most notably photon statistics
rather than being described by the Rayleigh limit. (2) These limits do not
necessarily correspond well to what level of detail can be seen in images or
real world objects; e.g., the Rayleigh limit is defined as the distance from the
center to the first minimum of the point spread function, which can be made
arbitrarily small with the help of ordinary linear optics (e.g., Toraldo-filters),
albeit at the expense of the side lobes becoming much higher than the central
maximum. (3)
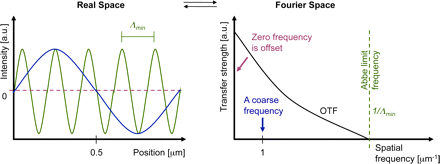
Abbe’s formulation of a resolution limit avoids all of the above shortcomings
at the expense of a less direct interpretation. The process of imaging can be
described by a convolution operation. With the help of a Fourier transformation,
every object (whether periodic or not) can uniquely be described as a sum of
sinusoidal curves with different spatial frequencies (where higher frequencies
represent fine object details and lower frequencies represent coarse details).
The rather complex process of convolution can be greatly simplified by looking
at the equivalent operation in Fourier space: The Fourier-transformed object
just needs to be multiplied with the
Fourier-transformed PSF to yield the Fourier-transformed ideal image (without
the noise). Because the Fourier-transformed PSF now describes how well each
spatial frequency of the Fourier-transformed object gets transferred to appear in the
image, this Fourier-transformed PSF is called the optical transfer function, OTF
(right panel). Its strength at each spatial frequency (e.g., measured in oscillations
per meter) conveniently describes the contrast that a sinusoidal object would
achieve in an image.

Abbe limit
Interestingly, the detection OTF of a microscope has a fixed frequency
border (Abbe limit frequency, right panel). The maximum-to-maximum
distance Λmin of the corresponding sine curve is commonly referred to
as Abbe’s limit (left panel). In other words: The Abbe limit is the smallest
periodicity in a structure, which can be discriminated in its image. As a
point object contains all spatial frequencies, this Abbe limit sine curve
needs to also be present in the PSF. A standard wide-field microscope
creates an image of a point object (e.g., an emitting molecule) by capturing
the light from that molecule at various places of the objective lens, and
processing it with further lenses to then interfere at the image plane.
Conveniently due to the reciprocity principle in optics, the Abbe limit Λmin
along an in-plane direction in fluorescence imaging corresponds to the
maximum-to-maximum distance of the intensity structure one would get by
interfering two waves at extreme angles captured by the objective lens:
where λ/n is the wavelength of light in the medium of refractive index n.
The term NA = n sin(α) conveniently combines the half opening angle α
of the objective and the refractive index n of the embedding medium.
Abbe’s famous resolution limit is so attractive because it simply depends
on the maximal relative angle between different waves leaving the
object and being captured by the objective lens to be sent to the image.
It describes the smallest level of detail that can possibly be imaged with
this PSF “brush”. No periodic object detail smaller than this shortest
wavelength can possibly be transferred to the image.
Confocal laser scanning microscopy employs a redesigned optical
path and specialized hardware. A tightly focused spot of laser light is
used to scan the sample and a small aperture (or pinhole) in the
confocal image plane of the light path allows only light originating
from the nominal focus to pass (Cremer and Cremer, 1978; Sheppard
and Wilson, 1981; Brakenhoff et al., 1985). The emitted light is
detected by a photomultiplier tube (PMT) or an avalanche photodiode
(APD) and the image is then constructed by mapping the detected
light in dependence of the position of the scanning spot. CLSM can
achieve a better resolution than wide-field fluorescence microscopy
but, to obtain a significant practical advantage, the pinhole needs to
be closed to an extent where most of the light is discarded
(Heintzmann et al., 2003).
Wide-field deconvolution and CLSM have long been the gold standards
in optical bioimaging, but we are now witnessing a revolution in light
microscopy that will fundamentally expand our perception of the cell.
Recently, several new technologies,collectively termed super-resolution
microscopy or nanoscopy, have been developed that break or bypass
the classical diffraction limit and shift the optical resolution down to
macromolecular or even molecular levels (Table I).
Super-resolution light microscopy methods

super resolution microscopy
http://zeiss-campus.magnet.fsu.edu/articles/superresolution/introduction.html
Conceptually, one can discern near-field from far-field methods and
whether the subdiffraction resolution is based on a linear or nonlinear
response of the sample to its locally illuminating (exciting or depleting) irradiance. The required nonlinearity is currently achieved by using reversible saturable optical fluorescence transitions (RESOLFT) between molecular states (Hofmann et al., 2005; Hell, 2007).
Besides these saturable optical fluorescence transitions also other
approaches, e.g., Rabi oscillations, could be used to generate the
required nonlinear response.
Note that each of the novel imaging modes has its individual signal-
to-noise consideration depending on various factors. A full
discussion of this issue is beyond the scope of this review, but as a
general rule, single-point scanning systems, albeit fundamentally limited
in speed by fluorescence saturation effects, can have better signal-
to-noise performance for thicker samples.
With three-dimensional SIM (3D-SIM), an additional twofold increase
in the axial resolution can be achieved by generating an excitation
light modulation along the z-axis using three-beam interference
(Gustafsson et al., 2008; Schermelleh et al.,2008) and processing a
z-stack of images accordingly. Thus, with 3D-SIM an approximately eightfold smaller volume can be resolved in comparison to conventional microscopy (Fig. 2). To computationally reconstruct a three-dimensional dataset of a typical mammalian cell of 8-µm height with a
z-spacing of 125 nm, roughly 1,000 raw images (512 × 512 pixels) are
recorded. Because no special photophysics is needed, virtually all modern fluorescent labels can be used provided they are sufficiently photostable
to accommodate the additional exposure cycles.
Resolvable volumes obtained with current commercial super-resolution microscopes.
A schematic 3D representation of focal volumes is shown for the indicated
emission maxima. The approximate lateral (x,y) and axial (z) resolution
and resolvable volumes are listed. Note that STED/CW-STED and 3D-SIM
can reach up to 20 µm into the sample, whereas PALM/STORM is usually
confined to the evanescent wave field near the sample bottom. It should be
noted that deconvolution approaches can further improve STED resolution.
For comparison the “focal volume” for PALM/STORM was estimated based
on the localization precision in combination with the z-range of TIRF.

Resolvable volumes obtained
Super-resolution microscopy of biological samples.
(A) Conventional wide-field image (left) and 3D-SIM image of a mouse
C2C12 prometaphase cell stained with primary antibodies against
lamin B and tubulin, and secondary antibodies conjugated to Alexa 488
(green) and Alexa 594 (red), respectively. Nuclear chromatin was stained
with DAPI (blue). 3D image stacks were acquired with a DeltaVision OMX
prototype system (Applied Precision). The bottom panel shows the
respective orthogonal cross sections. (B) HeLa cell stained with primary
antibodies against the nuclear pore complex protein Nup153 and
secondary antibodies conjugated with ATTO647N. The image was
acquired with a TCS STED confocal microscope (Leica). (C) TdEosFP-
paxillin expressed in a Hep G2 cell to label adhesion complexes at
the lower surface. The image was acquired on an ELYRA P.1
prototype system (Carl Zeiss, Inc.) using TIRF illumination. Single
molecule positional information was projected from 10,000 frames
recorded at 30 frames per second. On the left, signals were summed
up to generate a TIRF image with conventional wide-field lateral
resolution. Bars: 5 µm (insets, 0.5 µm).

biological images
APPLICATIONS IN BIOLOGICAL SYSTEMS
The cytoskeleton of mammalian cells, especially microtubules
(Figure 5a) (29, 44, 46, 52), is the most commonly used benchmark
structure for super-resolution imaging. Other cytoskeletal structures
imaged so far include actin filaments in the lamellipodium (6),
keratin intermediate filaments (59), neurofilaments (26, 83) and
MreB in Caulobacter (66).
Figure 5

cytoskeleton. f5.
Examples of super-resolution images of biological samples.
(a) Two-color STORM imaging of immunostained microtubule (green)
and clathrin-coated pits (red) (From Reference 46. Reprinted with
permission from AAAS).
Organelles, such as the endoplasmic reticulum (27), lysosome (6),
endocytic and exocytic vesicles (46, 52, 64), and mitochondria
(6, 53, 56), have also been imaged. For example, using the single-molecule localization approach, 3D STORM imaging has clearly
resolved the ~150-nm diameter, hemispherical cage shape of clathrin-coated pits (46, 52), which only appear as diffraction-limited spots
without any feature in conventional fluorescence microscopy (Figure 5a,b).
Two-color 3D STED has resolved the hollow shape of the mitochondrial
outer membrane (marked by the translocase protein Tom20), enclosing
a matrix protein Hsp60 (56), even though the diameter of mitochondria is
only about 300–500 nm (Figure 5c). The outer membrane structure of
mitochondria and their interactions with microtubules have been resolved
by two-color 3D STORM (53). The transport of synaptic vesicles
has been recorded at video rate using 2D STED (Figure 5d ) (64).
Many plasma membrane proteins or membrane associated protein
complexes have also been studied by super-resolution fluorescence
microscopy. For example, synaptotagmin clusters after exocytosis in
primary cultured hippocampal neurons (84), the donut-shaped
clusters of Drosophila protein Bruchpilot at the neuromuscular
synaptic active zone (85), and the size distribution of syntaxin clusters
have all been imaged (86, 87). Photoactivation has enabled the tracking
of the influenza protein hemagglutinin and the retroviral protein Gag in
live cells, revealing the membrane microdomains (67) and the spatial
heterogeneity of membrane diffusion (68). The morphology and transport
of the focal adhension complex has also been observed using live-cell
PALM (Figure 5e) (65).
Summary points
- Super resolution fluorescence microscopy with a spatial resolution not limited by the diffraction of
light has been implemented using saturated depletion/excitation or single-molecule localization
of switchable fluorophores.
- Three-dimensional imaging with an optical resolution as high as ~20 nm in the lateral direction
and 40–50 nm in axial dimension has been achieved.
- The resolution of these super-resolution fluorescence microscopy techniques can in principle
reach molecular scale.
- In practice, the resolution of the images are not only limited by the intrinsic optical resolution,
but also by sample specific factors including the labeling density, probe size and sample preservation.
- Multicolor super resolution imaging has been implemented, allowing colocalization measurements
to be performed at nanometer scale resolution and molecular interaction to be more précisely
identified in cells.
- Super-resolution fluorescence imaging allows dynamic processes to be investigated at the tens of
nanometer resolution in living cells.
- Many cellular structures have been imaged at sub-diffraction-limit resolution.
Future issues
- Achieving molecular scale resolution (a few nanometers or less).
- Fast super resolution imaging of a large view field by multi-point scanning or high-speed single-molecule switching/localization.
- Developing new fluorescent probes that are brighter, more photostable and switchable fluorophores
that have high on-off contrast and fast switching rate.
- Developing fluorescent labeling methods that can stain the target with small molecules at high specificity,
high density and good ultrastructure preservation.
- Application of super resolution microscopy to provide novel biological insights
Acronyms
FP
Fluorescent Protein
FPALM
Fluorescence PhotoActivation Localization Microscopy
I5M
Combination of I2M (Illumination Interference Microscopy) and I3M
(Incoherent Imaging Interference Microscopy)
PALM
PhotoActivated Localization Microscopy
PSF
Point Spread Function
RESOLFT
REversible Saturable Optically Linear Fluorescence Transition
SIM
Structured Illumination Microscopy
SSIM
Saturated Structured Illumination Microscopy
STED
STimulated Emission Depletion
STORM
STochastic Optical Reconstruction Microscopy
glossary
Numerical aperture (NA)
The numerical aperture of an objective characterizes the solid angle
of light collected from a point light source at the focus of the objective.
Stimulated emission
The process that an excited state molecule or atom jumps to the
ground state by emitting another photon that is identical to the incoming
photon. It is the basis of laser.
Fluorescence saturation
At high excitation intensity, the fluorescence lifetime instead of the excitation
rate becomes the rate limiting step of fluorescence emission, causing the
fluorescence signal not to increase proportionally with the excitation intensity.
Nyquist criterion
To determine a structure, the sampling interval needs to be no larger than
half of the feature size.
Mitochondria
Organelles in eukaryotic cells for APT generation, consisting of two
membrane (inner and outer) enclosing the inter membrane space and
the matrix inside the inner membrane.
Clathrin-coated pit
Vesicle forming machinery involved in endocytosis and intracellular
vesicle transport, consisting of clathrin coats, adapter proteins, and
other regulatory proteins.
Focal adhesion
The macromolecular complex serving as the mechanical connection
and signaling hub between a cell and the extracellular matrix or other cells.
Selected references with abstract
Near-Field Optics: Microscopy, Spectroscopy, and Surface
Modification Beyond the Diffraction Limit
Eric Betzig, Jay K. Trautman
AT&T Bell Laboratories, Murray Hill, NJ 07974
Science 10 Jul 1992; 257(5067) pp. 189-195
http://dx.doi.org:/0.1126/science.257.5067.189
The near-field optical interaction between a sharp probe and a sample
of interest can be exploited to image, spectroscopically probe, or modify
surfaces at a resolution (down to ∼12 nm) inaccessible by traditional far-field
techniques. Many of the attractive features of conventional optics are
retained, including noninvasiveness, reliability, and low cost. In addition, most
optical contrast mechanisms can be extended to the near-field regime,
resulting in a technique of considerable versatility. This versatility
is demonstrated by several examples, such as the imaging of nanometric-scale features in mammalian tissue sections and the creation of ultrasmall,
magneto-optic domains having implications for high density data storage.
Although the technique may find uses in many diverse fields, two of the
most exciting possibilities are localized optical spectroscopy of semiconductors
and the fluorescence imaging of living cells.
Imaging Intracellular Fluorescent Proteins at Nanometer Resolution
E Betzig1,2,*,†, GH. Patterson3, R Sougrat3, O.W Lindwasser3,
S Olenych4, JS. Bonifacino3, MW. Davidson4, JL Schwartz3, HF. Hess5,* 1 Howard Hughes Medical Institute, Janelia Farm Research Campus,
Ashburn, VA 2 New Millennium Research, LLC, Okemos, MI. 3 Cell Biology and Metabolism Branch, National Institute of Child Health
and Human Development (NICHD), Bethesda, MD. 4 National High
Magnetic Field Laboratory, Florida State University, Tallahassee, FL.
5 NuQuest Research, LLC, La Jolla, CA.
Science 15 Sep 2006; 313(5793): pp. 1642-1645
http://dx.doi.org:/10.1126/science.1127344
We introduce a method for optically imaging intracellular proteins at
nanometer spatial resolution. Numerous sparse subsets of photo-activatable fluorescent protein molecules were activated, localized
(to ∼2 to 25 nanometers), and then bleached. The
aggregate position information from all subsets was then assembled
into a super-resolution image. We used this method—termed photo-
activated localization microscopy to image specific target proteins
in thin sections of lysosomes and mitochondria; in fixed whole cells,
we imaged vinculin at focal adhesions, actin within a lamellipodium,
and the distribution of the retroviral protein Gag at the plasma
membrane.
Toward fluorescence nanoscopy.
Hell SW. Author information
Nat Biotechnol. 2003 Nov; 21(11):1347-55.
http://www.ncbi.nlm.nih.gov/pubmed/14595362
For more than a century, the resolution of focusing light microscopy
has been limited by diffraction to 180 nm in the focal plane and to
500 nm along the optic axis. Recently, microscopes have been
reported that provide three- to seven-fold improved axial
resolution in live cells. Moreover, a family of concepts has emerged
that overcomes the diffraction barrier altogether. Its first exponent,
stimulated emission depletion microscopy, has so far displayed a
resolution down to 28 nm. Relying on saturated optical transitions,
these concepts are limited only by the attainable saturation level.
As strong saturation should be feasible at low light intensities,
nanoscale imaging with focused light may be closer than ever.
PMID: 14595362
Far-field optical nanoscopy.
Hell SW. Author information
Science. 2007 May 25;316(5828):1153-8.
http://www.ncbi.nlm.nih.gov/pubmed/17525330
In 1873, Ernst Abbe discovered what was to become a well-known
paradigm: the inability of a lens-based optical microscope to
discern details that are closer together than half of the wavelength
for its most popular imaging mode, fluorescence microscopy, the
diffraction barrier is crumbling. Here, I discuss the physical concepts
that have pushed fluorescence microscopy to the nanoscale, once
the prerogative of electron and scanning probe microscopes. Initial
applications indicate that emergent far-field optical nanoscopy will
have a strong impact in the life sciences and in other areas benefiting
from nanoscale visualization.
PMID: 17525330
Imaging intracellular fluorescent proteins at nanometer resolution.
Betzig E1, Patterson GH, Sougrat R, Lindwasser OW, Olenych S,
Bonifacino JS, Davidson MW, Lippincott-Schwartz J, Hess HF.
Author information
Science. 2006 Sep 15;313(5793):1642-5. Epub 2006 Aug 10
http://www.ncbi.nlm.nih.gov/pubmed/16902090
We introduce a method for optically imaging intracellular proteins at
nanometer spatial resolution. Numerous sparse subsets of photo-ctivatable fluorescent protein molecules were activated, localized
(to approximately 2 to 25 nanometers), and then bleached. The
aggregate position information from all subsets was then assembled
into a super-resolution image. We used this method–termed photo-activated localization microscopy–to image specific target proteins in
thin sections of lysosomes and mitochondria; in fixed whole cells,
we imaged vinculin at focal adhesions, actin within a lamellipodium,
and the distribution of the retroviral protein Gag at the plasma
membrane.
Comment in
PMID: 16902090 [PubMed – indexed for MEDLINE]
Illuminating single molecules in condensed matter.
Moerner WE1, Orrit M. Author information
Science. 1999 Mar 12;283(5408):1670-6.
http://www.ncbi.nlm.nih.gov/pubmed/10073924
Efficient collection and detection of fluorescence coupled with careful
minimization of background from impurities and Raman scattering
now enable routine optical microscopy and study of single molecules
in complex condensed matter environments. This ultimate method
for unraveling ensemble averages leads to the observation of
new effects and to direct measurements of stochastic fluctuations.
Experiments at cryogenic temperatures open new directions in
molecular spectroscopy, quantum optics, and solid-state dynamics.
Room-emperature investigations apply several techniques
(polarization microscopy, single-molecule imaging, emission time
dependence, energy transfer, lifetime studies, and the like) to a
growing array of biophysical problems where new insight may be
gained from direct observations of hidden static and dynamic
inhomogeneity. PMID: 10073924
Fluorescence microscopy with super-resolved optical sections.
Egner A1, Hell SW. Author information
Trends Cell Biol. 2005 Apr;15(4):207-15.
http://www.ncbi.nlm.nih.gov/pubmed/15817377
The fluorescence microscope, especially its confocal variant, has
become a standard tool in cell biology research for delivering
3D-images of intact cells. However, the resolution of any standard
optical microscope is atleast 3 times poorer along the axis of the
lens that in its focal plane. Here, we review principles and applications
of an emerging family of fluorescence microscopes, such as 4Pi
microscopes, which improve axial resolution by a factor of seven by
employing two opposing lenses. Noninvasive axial sections of 80-160 nm
thickness deliver more faithful 3D-images of subcellular features,
providing a new opportunity to significantly enhance our understanding
of cellular structure and function. PMID: 15817377
4Pi-confocal microscopy provides three-dimensional images of the
microtubule network with 100- to 150-nm resolution.
Nagorni M1, Hell SW. Author information
J Struct Biol. 1998 Nov;123(3):236-47.
We show the applicability of 4Pi-confocal microscopy to three-dimensional imaging of the microtubule network in a fixed mouse
fibroblast cell.Comparison with two-photon confocal resolution
reveals a fourfold better axial resolution in the 4Pi-confocal case.
By combining 4Pi-confocal microscopy with Richardson-Lucy
image restoration a further resolution increase is achieved.
Featuring a three-dimensional resolution in the range 100-150 nm,
the 4Pi-confocal (restored) images are intrinsically more detailed
than their confocal counterparts. Our images constitute what
to our knowledge are the best-resolved three-dimensional
images of entangled cellular microtubules obtained with light
to date. PMID: 9878578
Part IV. Super-resolution microscopy
Super-resolution microscopy is a form of light microscopy. Due
to the diffraction of light, the resolution of conventional light
microscopy is limited as stated by Ernst Abbe in 1873.[1]
A good approximation of the resolution attainable is the full
width at half maximum (FWHM) of the point spread function,
and a precise wide-field microscope with high numerical
aperture and visible light usually reaches a resolution of ~250 nm.
Super-resolution techniques allow the capture of images with
a higher resolution than the diffraction limit. They fall into
two broad categories,
“true” super-resolution techniques, which capture information
contained in evanescent waves, and “functional” super-
resolution techniques, which use clever experimental
techniques and known limitations on the matter being
imaged to reconstruct a super-resolution image.[2]
True subwavelength imaging techniques include those that
utilize the Pendry Superlens and near field scanning optical
microscopy, the 4Pi Microscope and structured illumination
microscopy technologies like SIM and SMI. However, the
majority of techniques of importance in biological imaging
fall into the functional category.
Groups of methods for functional super-resolution microscopy:
- Deterministic super-resolution: The most commonly used emitters in biological
microscopy, fluorophores, show a nonlinear response to excitation, and this
nonlinear response can be exploited to enhance resolution. These
methods include STED, GSD, RESOLFTand SSIM.
- Stochastic super-resolution: The chemical complexity of many molecular
light sources gives them a complex temporal behaviour, which can be used
to make several close-by fluorophores emit light at separate times and
thereby become resolvable in time. These methods include SOFI and all
single-molecule localization methods (SMLM) such as SPDM,
SPDMphymod, PALM, FPALM, STORM and dSTORM.
Part V. HIV-1
Conformational dynamics of single HIV-1 envelope
trimers on the surface of native virions
James B. Munro1,*,‡, Jason Gorman2, Xiaochu Ma1,
Zhou Zhou3, James Arthos4,
Dennis R. Burton5,6, et al.
1Department of Microbial Pathogenesis, Yale University
School of Medicine, New Haven, CT. 2Vaccine Research
Center, National Institute of Allergy and Infectious
Diseases, National Institutes of Health, Bethesda, MD .
3Department of Physiology and Biophysics, Weill
Cornell Medical College of Cornell University, New York, NY .
4Laboratory of Immunoregulation, National Institute of Allergy
and Infectious Diseases, National Institutes of Health, Bethesda,
MD . 5Department of Immunology and Microbial Science, and
IAVI Neutralizing Antibody Center, The Scripps Research
Institute, La Jolla, CA . 6Ragon Institute of MGH, MIT, and
Harvard, Cambridge, MA. 7International AIDS Vaccine Initiative
(IAVI), New York, NY . 8Department of
Chemistry, University of Pennsylvania, Philadelphia, PA.
The HIV-1 envelope (Env) mediates viral entry into host cells.
To enable the direct imaging of conformational dynamics
within Env we introduced fluorophores into variable
regions of the gp120 subunit and measured single-molecule
fluorescence resonance energy transfer (smFRET) within
the context of native trimers on the surface of HIV-1 virions.
Our observations revealed unliganded HIV-1 Env to be
intrinsically dynamic, transitioning between three distinct
pre-fusion conformations, whose relative occupancies
were remodeled by receptor CD4 and antibody binding.
The distinct properties of neutralization-sensitive and
neutralization-resistant HIV-1 isolates support a dynamics-based mechanism of immune evasion and ligand recognition.
Read Full Post »




 2012pharmaceutical
 sjwilliamspa