Healthcare analytics, AI solutions for biological big data, providing an AI platform for the biotech, life sciences, medical and pharmaceutical industries, as well as for related technological approaches, i.e., curation and text analysis with machine learning and other activities related to AI applications to these industries.
Testing for Multiple Genetic Mutations via NGS for Patients: Very Strong Family History of Breast & Ovarian Cancer, Diagnosed at Young Ages, & Negative on BRCA Test
Reporter: Aviva Lev-Ari PhD, RN
Article 9.2.Testing for Multiple Genetic Mutations via NGS for Patients: Very Strong Family History of Breast & Ovarian Cancer, Diagnosed at Young Ages, & Negative on BRCA Test
In her thoughtful article about her choice to undergo a double mastectomy, Angelina Jolie said the cost of genetic testing for BRCA1 and BRCA2 mutations “remains an obstacle for many women” (“My Medical Choice,” Op-Ed, May 14).
Our BRACAnalysis test has been used by more than a million women to assess their risk of hereditary breast and ovarian cancer.
The test remains widely reimbursed by insurance companies, with more than 95 percent of at-risk women covered and with an average out-of-pocket cost of about $100. And, thanks to preventive care provisions in the Affordable Care Act, many patients can receive BRACAnalysis testing with no out-of-pocket costs.
For patients in need, Myriad offers a patient assistance program that offers testing at reduced costs or free of charge.
“Jolie’s Disclosure of Preventive Mastectomy Highlights Dilemma” (front page, May 15) discusses Angelina Jolie’s decision to undergo prophylactic surgery after testing positive for a BRCA1 mutation. It should be noted that not all hereditary breast and ovarian cancer is attributable to mutations in BRCA1 and BRCA2.
An alternative dilemma exists when a patient has a very strong family history of breast and ovarian cancer, especially diagnosed at young ages, and the BRCA test is negative.
The patient is left wondering what to do next. These patients should consider a new method of testing for multiple genetic mutations via next-generation sequencing, which can often be ordered as part of a research protocol in academic centers.
Cigarette smoke induces pro-inflammatory cytokine release by activation of NF-kappaB and posttranslational modifications of histone deacetylase as seen in macrophages
Reporter and Curator: Dr. Sudipta Saha, Ph.D.
Abbreviations:
Chronic obstructive pulmonary disease (COPD)
Reactive oxygen species (ROS)
Hydroxyl radicals (·OH)
Glutathione (GSH)
Histone deacetylase (HDAC)
TNF (Tumour necrosis factor)
IκB kinase complex (IKK)
Interleukin (IL)
Cigarette smoking is the major etiologic factor in the pathogenesis of chronic obstructive pulmonary disease (COPD), which is characterized by an abnormal inflammatory response in the lungs to cigarette smoke with a progressive and irreversible airflow limitation. Chronic airway inflammation is an archetypal feature of COPD, and increased oxidative stress has been suggested to be responsible for triggering inflammatory events observed within the lungs of smokers and COPD patients. Although the precise mechanisms behind the pathogenesis of COPD are yet to be fully dissected, the current hypothesis suggests that cigarette smoke causes airway inflammation by activating macrophages, neutrophils, and T lymphocytes, which release proteases and reactive oxygen species (ROS) leading to cellular injury. As a consequence, chronic inflammatory processes are triggered that lead to small airway obstruction. An increased oxidant burden in smokers may be derived from the fact that cigarette smoke contains an estimated 1017 oxidants/free radicals and 4,700 chemical compounds, including reactive aldehydes (carbonyls) and quinones, per puff. Many of these are relatively long-lived, such as tar-semiquinone, which can generate hydroxyl radicals (·OH) and H2O2 by the Fenton reaction. One consequence of this increased oxidative stress is activation of redox-sensitive transcription factors, such as NF-κB and activator protein-1 (AP-1), which are critical to transcription of proinflammatory genes (IL-8, IL-6, and TNF-α). However, the precise transcriptional mechanisms leading to enhanced gene expression in response to cigarette smoke are still not clearly understood.
Cigarette smoke-mediated oxidative stress induces an inflammatory response in the lungs by stimulating the release of proinflammatory cytokines. Chromatin remodeling due to histone acetylation and deacetylation is known to play an important role in transcriptional regulation of proinflammatory genes. The aim of this study was to investigate the molecular mechanism(s) of inflammatory responses caused by cigarette smoke extract (CSE) in the human macrophage-like cell line MonoMac6 and whether the treatment of these cells with the antioxidant glutathione (GSH) monoethyl ester, or modulation of the thioredoxin redox system, can attenuate cigarette smoke-mediated IL-8 release. Exposure of MonoMac6 cells to CSE (1% and 2.5%) increased IL-8 and TNF-alpha production vs. control at 24 h and was associated with significant depletion of GSH levels associated with increased reactive oxygen species release in addition to activation of NF-kappaB. Inhibition of IKK ablated the CSE-mediated IL-8 release, suggesting that this process is dependent on theNF-kappaB pathway. CSE also reduced histone deacetylase (HDAC) activity and HDAC1, HDAC2, and HDAC3 protein levels. This was associated with posttranslational modification of HDAC1, HDAC2, and HDAC3 protein by nitrotyrosine and aldehyde-adduct formation. Pretreatment of cells with GSH monoethyl ester, but not thioredoxin/thioredoxin reductase, reversed cigarette smoke-induced reduction in HDAC levels and significantly inhibited IL-8 release. Thus cigarette smoke-induced release of IL-8 is associated with activation of NF-kappaB via IKK and reduction in HDAC levels/activity in macrophages. Moreover, cigarette smoke-mediated proinflammatory events are regulated by the redox status of the cells.
Cause of Death: How Good is the Reliability of the Data Collected?
This is a report on the high error rate in recording of death certificates, which were a standard of quality and a standard for
understanding disease classification since the work of Rokitanski, Virchow, John Hunter, Benjamin Castleman, Averill Liebow, and others.
The autopsy report had a defined structure, and it highlights the pathogenic sequence. Autopsy rates were high at times of pandemic.
Hand-written reports from the 19th century are still in exitence at the Bellevue Hospital, the first hospital in US to have an ambulance service.
Modern medicine has advanced substantially, but one has to be concerned with whether
we can get a true picture of death rates when autopsy rate have plunged to less than 20 percent over the last four decades.
I present the recent article in Medscape Medical News by Diedre Henderson, May 10, 2013 titled Cause of Death: 50% of Medical Residents Fib.
Some 48.6% to 58.4% of residents from more than half of the residency programs in New York City have
knowingly entered the incorrect cause of death on death certificates — errors that have implications
for epidemiology,
public health research, and
disease surveillance — according to result from a recent study.
As fewer autopsies are performed, Dr. Wexelman and coauthors note,
death certificates have become even more important sources of information about how Americans die.
Public health researchers rely on death certificates to gauge the leading causes of death and to identify disease outbreaks, and
the certificates also influence funding policies and research priorities.
In most teaching hospitals, it falls to resident physicians to complete the forms. To examine their experiences and opinions, the researchers conducted an anonymous, Internet-based, 32-question survey of New York City’s 70 internal medicine, emergency medicine, and general surgery residency programs in May and June 2010. Some 521 residents from 38 residency programs responded to the survey; 178 of the residents were termed “high-volume” respondents, meaning they had completed 11 or more death certificates in the previous 3 years.
Forced to Do It
“Almost half of all respondents (48.6%) and 58.4% of high-volume respondents reported they
had identified a cause of death on a death certificate that did not represent the true cause of death.
More than half of the residents (54.0%) reported they were unable to list what they felt to be the correct cause of death
after guidance from the admitting department in their hospital,” Dr. Wexelman and colleagues write.
“Of all respondents,
70% believed they were forced to identify an alternate cause of death when
the patient died of septic shock (compared with 83.5% of high-volume respondents), and
34.2% believed they were forced to identify an alternate cause when the patient died of
acute respiratory distress syndrome (compared with 44.3% of high-volume respondents),”
the researchers continue.
Only 20.8% of respondents knew
they could hedge the death determination by calling it “probable,” “presumed,” or “undetermined.”
When the death certificate system
would not accept the true cause of death or
hospital admitting staff overruled them,
64.6% of respondents reported cardiovascular disease,
19.5% pneumonia, and
12.4% cancer as the cause of death.
Study participation was voluntary, and residents with stronger feelings about the accuracy of death certificates
may have been more interested in participating. Other study limitations include the potential for recall bias.
“Residents routinely reported diagnoses on death certificates that did not match their medical judgments.
These errors may have lasting effects on the public health priorities of the community.
Reform is needed both in the training and education of residents and in the system itself,” the authors conclude.
Support for this study was provided by Columbia University College of Physicians and Surgeons.
iElastance: Calculates Ventricular Elastance, Arterial Elastance and Ventricular-Arterial Coupling using Echocardiographic derived values in a single beat determination
Reporter: Aviva Lev-Ari, PhD, RN
First iElastance release for Android!
iElastance is an application designed for calculate Ventricular Elastance, Arterial Elastance and Ventricular-Arterial Coupling using Echocardiographic derived values in a single beat determination. This application is extremely useful to a variety of health care givers such as Cardiologists, Intensivists, Anesthesiologist and more who want to calculate ventricular arterial coupling even in the Critical Care setting and, above all, bedside.
The variables needed for the calculator to work are:
Formulas are validated and extracted from the article by Chen CH et Al J Am Coll Cardiol. 2001 Dec;38(7):2028-34.
DISCLAIMER: The calculator provided is not meant to be a substitute for professional advice and is not to be used for medical diagnosis. Extensive effort has been exerted to make this software as accurate as possible; however the accuracy of information provided by this software cannot be guaranteed. Health care professionals should use clinical judjement and individualize therapy to each patient care situation.
All rights reserved – 2013 Pietro Bertini – Department of Cardiothoracic Anesthesia and Intensive Care Medicine – University Hospital of Pisa – Dr. Fabio Guarracino, Head of Department
FULL NETWORK ACCESS
Allows the app to create network sockets and use custom network protocols. The browser and other applications provide means to send data to the internet, so this permission is not required to send data to the internet.
To: Aviva Lev-Ari <AvivaLev-Ari@alum.berkeley.edu>
Subject: Re: Resource about the realities of online college
Dr. Lev-Ari,
My piece was recently published here: http://www.onlinecollegecourses.com/online-learning-expectations. The resource provides the realities of online college programs and what students need to know about them. Feel free to include a link to the resource on your site – I’d love to hear what you and your readers think! Looking forward to hearing from you! Thanks,
It’s the middle of the night. You sit alone, confused with only the cold, harsh light from your email lighting the room. Are you ever going to hear from your online college?
If this is your perception of online education, wake up. It’s the 21st century and one-third of all college students are taking at least one online course during their college careers.
For students who’ve never taken an online course, especially those who are returning to school several years after graduation, fears about taking an online course are understandable. Many unfamiliar with the format believe that online learning will be drastically different from traditional in-class experiences, that they won’t be able to interact with professors and classmates, or that online classes may not be as valuable to a career or educational endeavors as those in a classroom. While these concerns are not entirely unfounded, many students, once enrolled, quickly realize that online courses often aren’t quite how they imagine them to be.
If you’re considering taking online courses but have some reservations about their value to your career or theonline learning experience itself, it can be immensely valuable to take some time to learn about what you can actually expect from an online course. You may just find that many of the common concerns students like yourself have about online education have been mediated by new technology, highly trained faculty, and online curricula that’s benefited from years of development.
Isolation and the Online Environment
While it’s true that online students won’t head to class each week to see their classmates in person and to interact face-to-face with their professors, that doesn’t mean that online courses will leave students without social interaction and support. In many cases, students in online courses may actually get more individual attention than they would in a traditional course, both from professors and their fellow classmates.
Some of this interaction isn’t voluntary. Most online courses require that students interact with one another through chat rooms and discussion boards, and some students may even find themselves assigned to work with classmates on projects and assignments.
Dr. Dani Babb, an online educator at American Public University and Kaplan University, says that this is one of the most common misconceptions about online courses. “Many students don’t realize how much they will interact in discussions,” says Babb. “Most courses have a minimum number of posts and content requirements every week. Additionally, schools have engagement requirements; students must respond to peers and expand on the topic, add value in their engagement and further the conversation.”
To help combat online isolation, some colleges are building special online communities to connect students to each other and the school. At Northcentral University, students will soon be able to take advantage of a Virtual Academic Center, a place where they can go to interact with professors and classmates and talk about everything from academics to their personal interests. While not every school has this kind of online environment for students, a growing number maintain social media sites that encourage students to connect not only as classmates but also as individuals.
While it’s great to get to chat with classmates and build camaraderie, students may have additional concerns that they won’t be able to get in touch with professors or find the support that they need to do well in the course. Many professors understand these concerns and actively work to keep in touch with students and cater the course materials to their individual needs.
Mary Stephens, founder of Prep Forward, an online professional development resource for teachers, and an online professor at both UMass Boston and Wheaton College, says that her students commonly believe that they won’t get the support needed to complete the course material but that those concerns are often unfounded. “Some have the misconception that an in-person class is the only way to get any individualized attention or support,” she says. “This is definitely not the case for the majority of online courses. For instance, my courses specifically diagnose the individual strengths and weaknesses of each student. This not only helps them identify what areas to focus on, it helps me understand what additional explanations or resources I need to provide each individual to help them understand the material.”
Some professors take connecting with students and ensuring classmates bond even further. “To overcome the ‘loneliness’ of completing an online course, I divide my students into teams of four students,” says Lewis University marketing professor Robert Bergman. “They are required to create accounts in Facebook, LinkedIn, Twitter, Gmail, Pinterest, YouTube and Second Life. This allows them a variety of methods for communicating throughout the semester. In addition, I require they conduct a team meeting every week via videoconference on Oovoo.com, Skype, Facebook Skype, or Google Video. I strive to attend each team meeting to provide additional content, advice, guidance and help guide the meeting when needed. I am effectively part of each team.”
Support for students isn’t limited to faculty, however. Because online courses require a great deal of technology, students will also need to get in touch with support personnel should anything go wrong and they are not able to access their course materials or other resources. Unlike professors who may have limited “office hours,” these technical support professionals are available day and night. Matthew Curtis, a professor working in USC’s Master of Communication Management online program explains, “We offer our students 24/7 technical support. This means if they are working at 3 a.m. or 3 p.m. and cannot access some material there is live human support to assist them.”
USC isn’t alone in offering this kind of support; students at nearly all online universities will be able to get assistance with technological problems at any time, which may allay some of the fears less technologically-savvy students have about online courses.
Online Courses and Your Career
One of the biggest benefits of online courses is their flexibility, a factor that often makes them a popular choice among those trying to balance their current jobs with taking college courses towards a degree or certification. As a result, many online learners are older, non-traditional students who are taking courses to help improve their chances of promotion, start a career path, or just to expand their knowledge and career potential. For the reason, concerns over whether or not online courses are a smart career move are common among new students.
As far as employers are concerned, students don’t need to worry too much about the value of their online degrees. A survey done by institution Excelsior College and Zogby International in 2010 found that 83% of executives they polled felt that an online degree was as credible as one earned through a traditional campus-based program. Still concerned about the quality and career prep offered by online programs? It may be better than you realize.
“Assuming an online course is good, there is no difference in the amount of career preparation you would gain in a course in a classroom setting,” says Stephens. “In fact, in some classes you may gain more career preparation experience online as the online course has the benefits of allowing an individual to quickly access additional resources, links, and opportunities online.”
At many schools, online educators aren’t just teaching courses, they’re also working professionals in their area of expertise. “Probably the most important way that online programs can prepare graduates for the real world is the focus of faculty who are practicing the craft they are teaching,” says Northcentral University professor Darren Adamson. “Not only does this give a flavor of what is really going on in the profession, but it also helps with networking as the student creates connections with professors working as professionals in the field.”
Students may also have concerns over whether or not they’ll really be learning as much as they need to in an online course. A study in 2009 by SRI International for the Department of Education found that on average students in online learning conditions actually performed better than those in traditional classrooms with face-to-face instruction.
Part of the reason may be a focus on assessment, ensuring students are doing well throughout the course.Gordon Drummond, president of the online design school Sessions College, explains, “The reality is that online education generally has to be more focused on assessment– on trying to determine whether a student has mastered a concept or skill–than a traditional class, where the focus is generally on presentation. This is key to debunking another myth, which is that online classes are easier than traditional ones. If the school is a serious school, there will actually be more evaluation of your skills as you work through the program. It will be harder, but better for you.”
If you want to pursue a career in a hands-on or clinical field, online course alone may not be able to give you the experience you need. In these cases, however, many hybrid and blended opportunities are generally available so that students can emerge from a degree program adequately prepared to take on the challenges of the workplace.
What You Can Do to Prepare for Online Courses
Even if some of the most common fears about online courses are unfounded, students who’ve never taken online courses will still need to prepare for the experience ahead of time.
One of the key aspects that differentiate online courses from those in class is the use of technology. Students may not realize how much their understanding of technology can plan a role in the ease with which they can complete assignments or how varied the tools they’ll need to use are. Not all online programs use the same types of technology or the same type of setup, however. “One thing that surprises students is how much technology is used,” says Babb. “Some schools have live lectures or what we call synchronous lectures. Other schools have live office hours, and others have entirely asynchronous communications. Students should know which they prefer and which the school has before attending to be sure it fits their lifestyle.”
Students taking online courses also need to prepare themselves for a serious time commitment. Online courses may be more flexible, but that doesn’t mean they’re less work. Adamson encourages students to not only set up time for listening to lectures and reading materials but also every other aspect of the educational experience. “I often suggest to students that they prepare to schedule time to ‘go to class’ every day,” he says. “Successful students ensure that each day (5-6 days per week) they have scheduled in their calendars time to study, read, research, reflect and complete the learning activity (assignment) each week. If school is left for ‘after everything else gets done’ then the student will fail in an on line environment. Online education requires that the student has a moderate level of self-discipline.”
Self-discipline may be the key to being successful in an online course. Students must be able to motivate themselves, stay organized, and keep on task even without supervision from a professor or other outside source. If you’re the type who loves to procrastinate or can’t stay on task, online learning can help strengthen that weakness. The online format challenges students to use better time management. Just like a traditional classroom, not treating online classes seriously will negatively affect your learning outcomes.
Online courses won’t be a perfect match for every student, but they often aren’t as intimidating, isolating, or risky as students might believe. New technology, highly motivated professors, and an incredibly diverse assortment of programs and institutions have helped to make online education a more flexible and customizable alternative to traditional education. It is also quickly becoming as respected and rich as any students can take in a more traditional setting. Students who are unsure about taking online courses should reach out to administrators, professors, and online learners to get a better idea of what online learning is really like so that they know what to expect, how to prepare, and ultimately, how to be successful as an online student.
In a previous posting I commented on the problem of hs cTn use and the on site ED performance of cardiac treadmill (done in Europe)
prior to a decision of CT scan (not done in US).
Acute Chest Pain/ER Admission: Three Emerging Alternatives to Angiography and PCI – Corus CAD, hs cTn, CCTA
We examine the emergence of Alternatives to Angiography and PCI as most common strategy for ER admission with listed cause of Acute Chest Pain. The Goal is to use methods that will improve the process to identify for an Interventional procedure only the patients that a PCI is a must to have.
Alternative #1: Corus® CAD
Alternative #2: High-Sensitivity Cardiac Troponins in Acute Cardiac Care
Alternative #3: Coronary CT Angiography for Acute Chest Pain
After presenting the the Three alternatives, the Editorial by R.F. Redberg, Division of Cardiology, UCSF, will be analyzed.
Alternative #1: First-Line Test to Help Clinicians Exclude Obstructive CAD as a Cause of the Patient’s Symptoms
Corus® CAD, a blood-based gene expression test, demonstrated high accuracy with both a high negative predictive value (96 percent) and high sensitivity (89 percent) for assessing obstructive coronary artery disease (CAD) in a population of patients referred for stress testing with myocardial perfusion imaging (MPI).
COMPASS enrolled stable patients with symptoms suggestive of CAD who had been referred for MPI at 19 U.S. sites. A blood sample was obtained in all 431 patients prior to MPI and Corus CAD gene expression testing was performed with study investigators blinded to Corus CAD test results.Following MPI, patients underwent either invasive coronary angiography orcoronary CT angiography, gold-standard anatomical tests for the diagnosis of coronary artery disease.
Alternative #2: High-Sensitivity Cardiac Troponins in Acute Cardiac Care
Recommendations for the use of cardiac troponin (cTn) measurement in acute cardiac care have recently been published.[1] Subsequently, a high-sensitivity (hs) cTn T assay was introduced into routine clinical practice.[2] This assay, as others, called highly sensitive, permits measurement of cTn concentrations in significant numbers of apparently illness-free individuals. These assays can measure cTn in the single digit range of nanograms per litre (=picograms per millilitre) and some research assays even allow detection of concentrations <1 ng/L.[2–4] Thus, they provide a more precise calculation of the 99th percentile of cTn concentration in reference subjects (the recommended upper reference limit [URL]). These assays measure the URL with a coefficient of variation (CV) <10%.[2–4]The high precision of hs-cTn assays increases their ability to determine small differences in cTn over time. Many assays currently in use have a CV >10% at the 99th percentile URL limiting that ability.[5–7] However, the less precise cTn assays do not cause clinically relevant false-positive diagnosis of acute myocardial infarction (AMI) and a CV <20% at the 99th percentile URL is still considered acceptable.[8]
We believe that hs-cTn assays, if used appropriately, will improve clinical care. We propose criteria for the clinical interpretation of test results based on the limited evidence available at this time.
References
1. Thygesen K, Mair J, Katus H, Plebani M, Venge P, Collinson P, Lindahl B, Giannitsis E, Hasin Y, Galvani M, Tubaro M, Alpert JS, Biasucci LM, Koenig W, Mueller C, Huber K, Hamm C, Jaffe AS; Study Group on Biomarkers in Cardiology of the ESC Working Group on Acute Cardiac Care. Recommendations for the use of cardiac troponin measurement in acute cardiac care. Eur Heart J 2010;31:2197–2204.
2. Saenger AK, Beyrau R, Braun S, Cooray R, Dolci A, Freidank H, Giannitsis E, Gustafson S, Handy B, Katus H, Melanson SE, Panteghini M, Venge P, Zorn M, Jarolim P, Bruton D, Jarausch J, Jaffe AS. Multicenter analytical evaluation of a high sensitivity troponin T assay. Clin Chim Acta 2011;412:748–754.
3. Zaninotto M, Mion MM, Novello E, Moretti M, Delprete E, Rocchi MB, Sisti D, Plebani M. Precision performance at low levels and 99th percentile concentration of the Access AccuTnI assay on two different platforms. Clin Chem Lab Med 2009; 47:367–371.
4. Todd J, Freese B, Lu A, Held D, Morey J, Livingston R, Goix P. Ultrasensitive flow based immunoassays using single-molecule counting. Clin Chem 2007; 53:1990–1995.
5. van de Kerkhof D, Peters B, Scharnhorst V. Performance of Advia Centaur second-generation troponin assay TnI-Ultra compared with the first-generation cTnI assay. Ann Clin Biochem 2008; 45:316–317.
6. Lam Q, Black M, Youdell O, Spilsbury H, Schneider HG. Performance evaluation and subsequent clinical experience with the Abbott automated Architect STAT Troponin-I assay. Clin Chem 2006; 52:298–300.
7. Tate JR, Ferguson W, Bais R, Kostner K, Marwick T, Carter A. The determination of the 99th percentile level for troponin assays in an Australian reference population. Ann Clin Biochem 2008; 45:275–288.
8. Jaffe AS, Apple FS, Morrow DA, Lindahl B, Katus HA. Being rational about (im)-precision: a statement from the Biochemistry Subcommittee of the Joint European Society of Cardiology/American College of Cardiology Foundation/American Heart Association/World Heart Federation Task Force for the definition of myocardial infarction. Clin Chem 2010; 56:921–943.
Hoffmann et al. (July 26 issue)1 conclude that, among patients with low-to-intermediate-risk acute coronary syndromes, the incorporation of coronary computed tomographic angiography (CCTA) improves the standard evaluation strategy.2 However, it may be difficult to generalize their results, owing to different situations on the two sides of the Atlantic and the availability of high-sensitivity troponin T assays in Europe. In the United States, the Food and Drug Administration has still not approved a high-sensitivity troponin test, and patients in the Rule Out Myocardial Infarction/Ischemia Using Computer Assisted Tomography (ROMICAT-II) trial only underwent testing with the conventional troponin T test. As we found in the biomarker substudy in the ROMICAT-I trial, a single high-sensitivity troponin T test at the time of CCTA accurately ruled out acute myocardial infarction (negative predictive value, 100%) (Table 1TABLE 1Results of High-Sensitivity Troponin T Testing for the Diagnosis of Acute Coronary Syndromes in ROMICAT-I.).3 In addition, patients with acute myocardial infarction can be reliably identified, with up to 100% sensitivity, with the use of two high-sensitivity measurements of troponin T within 3 hours after admission.4,5
It seems plausible to assume that the incorporation of high-sensitivity troponin T assays in this trial would have outperformed CCTA. Therefore, it is important to assess the performance of such testing and compare it with routine CCTA testing in terms of length of stay in the hospital and secondary end points, especially cumulative costs and major adverse coronary events at 28 days.
Januzzi JL Jr, Bamberg F, Lee H, et al. High-sensitivity troponin T concentrations in acute chest pain patients evaluated with cardiac computed tomography. Circulation2010;121:1227-1234
Keller T, Zeller T, Ojeda F, et al. Serial changes in highly sensitive troponin I assay and early diagnosis of myocardial infarction. JAMA 2011;306:2684-2693
Thygesen K, Mair J, Giannitsis E, et al. How to use high-sensitivity cardiac troponins in acute cardiac care. Eur Heart J 2012;33:2252-2257
Author/Editor Response
In response to Karakas and Koenig: we agree that high-sensitivity troponin T assays may permit more efficient care of low-risk patients presenting to the emergency department with acute chest pain1 and may also have the potential to identify patients with unstable angina because cardiac troponin T levels are associated with the degree and severity of coronary artery disease.2 Hence, high-sensitivity troponin T assays performed early may constitute an efficient and safe gatekeeper for imaging. CCTA, however, may be useful for ruling out coronary artery disease in patients who have cardiac troponin T levels above the 99th percentile but below levels that are diagnostic for myocardial infarction. The hypothesis that high-sensitivity troponin T testing followed by CCTA, as compared with other strategies, may enable safe and more efficient treatment of patients in the emergency department who are at low-to-moderate risk warrants further assessment. The generalizability of our data to clinical settings outside the United States may also be limited because of differences in the risk profile of emergency-department populations and the use of nuclear stress imaging.3
Udo Hoffmann, M.D., M.P.H.
Massachusetts General Hospital, Boston, MA uhoffmann@partners.org
W. Frank Peacock, M.D.
Baylor College of Medicine, Houston, TX
James E. Udelson, M.D.
Tufts Medical Center, Boston, MA
Since publication of their article, the authors report no further potential conflict of interest.
Than M, Cullen L, Reid CM, et al. A 2-h diagnostic protocol to assess patients with chest pain symptoms in the Asia-Pacific region (ASPECT): a prospective observational validation study. Lancet 2011;377:1077-1084
Januzzi JL Jr, Bamberg F, Lee H, et al. High-sensitivity troponin T concentrations in acute chest pain patients evaluated with cardiac computed tomography. Circulation2010;121:1227-1234
Alternative #3: Coronary CT Angiography for Acute Chest Pain
The Study concluded:
There was increased diagnostic testing and higher radiation exposure in the CCTA group, with no overall reduction in the cost of care.
Coronary CT Angiography versus Standard Evaluation in Acute Chest Pain
Udo Hoffmann, M.D., M.P.H., Quynh A. Truong, M.D., M.P.H., David A. Schoenfeld, Ph.D., Eric T. Chou, M.D., Pamela K. Woodard, M.D., John T. Nagurney, M.D., M.P.H., J. Hector Pope, M.D., Thomas H. Hauser, M.D., M.P.H., Charles S. White, M.D., Scott G. Weiner, M.D., M.P.H., Shant Kalanjian, M.D., Michael E. Mullins, M.D., Issam Mikati, M.D., W. Frank Peacock, M.D., Pearl Zakroysky, B.A., Douglas Hayden, Ph.D., Alexander Goehler, M.D., Ph.D., Hang Lee, Ph.D., G. Scott Gazelle, M.D., M.P.H., Ph.D., Stephen D. Wiviott, M.D., Jerome L. Fleg, M.D., and James E. Udelson, M.D. for the ROMICAT-II Investigators
It is unclear whether an evaluation incorporating coronary computed tomographic angiography (CCTA) is more effective than standard evaluation in the emergency department in patients with symptoms suggestive of acute coronary syndromes.
METHODS
In this multicenter trial, we randomly assigned patients 40 to 74 years of age with symptoms suggestive of acute coronary syndromes but without ischemic electrocardiographic changes or an initial positive troponin test to early CCTA or to standard evaluation in the emergency department on weekdays during daylight hours between April 2010 and January 2012. The primary end point was length of stay in the hospital. Secondary end points included rates of discharge from the emergency department, major adverse cardiovascular events at 28 days, and cumulative costs. Safety end points were undetected acute coronary syndromes.
RESULTS
The rate of acute coronary syndromes among 1000 patients with a mean (±SD) age of 54±8 years (47% women) was 8%. After early CCTA, as compared with standard evaluation, the mean length of stay in the hospital was reduced by 7.6 hours (P<0.001) and more patients were discharged directly from the emergency department (47% vs. 12%, P<0.001). There were no undetected acute coronary syndromes and no significant differences in major adverse cardiovascular events at 28 days. After CCTA, there was more downstream testing and higher radiation exposure. The cumulative mean cost of care was similar in the CCTA group and the standard-evaluation group ($4,289 and $4,060, respectively; P=0.65).
CONCLUSIONS
In patients in the emergency department with symptoms suggestive of acute coronary syndromes, incorporating CCTA into a triage strategy improved the efficiency of clinical decision making, as compared with a standard evaluation in the emergency department, but it resulted in an increase in downstream testing and radiation exposure with no decrease in the overall costs of care. (Funded by the National Heart, Lung, and Blood Institute; ROMICAT-II ClinicalTrials.gov number, NCT01084239.)
Roe MT, Harrington RA, Prosper DM, et al. Clinical and therapeutic profile of patients presenting with acute coronary syndromes who do not have significant coronary artery disease. Circulation 2000;102:1101-1106
Miller JM, Rochitte CE, Dewey M, et al. Diagnostic performance of coronary angiography by 64-row CT. N Engl J Med 2008;359:2324-2336
Budoff MJ, Dowe D, Jollis JG, et al. Diagnostic performance of 64-multidetector row coronary computed tomographic angiography for evaluation of coronary artery stenosis in individuals without known coronary artery disease: results from the prospective multicenter ACCURACY (Assessment by Coronary Computed Tomographic Angiography of Individuals Undergoing Invasive Coronary Angiography) trial. J Am Coll Cardiol 2008;52:1724-1732
Marano R, De Cobelli F, Floriani I, et al. Italian multicenter, prospective study to evaluate the negative predictive value of 16- and 64-slice MDCT imaging in patients scheduled for coronary angiography (NIMISCAD-Non Invasive Multicenter Italian Study for Coronary Artery Disease). Eur Radiol 2009;19:1114-1123
Meijboom WB, Meijs MF, Schuijf JD, et al. Diagnostic accuracy of 64-slice computed tomography coronary angiography: a prospective, multicenter, multivendor study. J Am Coll Cardiol 2008;52:2135-2144
Hoffmann U, Bamberg F, Chae CU, et al. Coronary computed tomography angiography for early triage of patients with acute chest pain: the ROMICAT (Rule Out Myocardial Infarction using Computer Assisted Tomography) trial. J Am Coll Cardiol 2009;53:1642-1650
Hollander JE, Chang AM, Shofer FS, et al. One-year outcomes following coronary computerized tomographic angiography for evaluation of emergency department patients with potential acute coronary syndrome. Acad Emerg Med 2009;16:693-698
Rubinshtein R, Halon DA, Gaspar T, et al. Usefulness of 64-slice cardiac computed tomographic angiography for diagnosing acute coronary syndromes and predicting clinical outcome in emergency department patients with chest pain of uncertain origin. Circulation2007;115:1762-1768
Schlett CL, Banerji D, Siegel E, et al. Prognostic value of CT angiography for major adverse cardiac events in patients with acute chest pain from the emergency department: 2-year outcomes of the ROMICAT trial. JACC Cardiovasc Imaging 2011;4:481-491
Goldstein JA, Chinnaiyan KM, Abidov A, et al. The CT-STAT (Coronary Computed Tomographic Angiography for Systematic Triage of Acute Chest Pain Patients to Treatment) trial. J Am Coll Cardiol 2011;58:1414-1422
Litt HI, Gatsonis C, Snyder B, et al. CT angiography for safe discharge of patients with possible acute coronary syndromes. N Engl J Med 2012;366:1393-1403
Shreibati JB, Baker LC, Hlatky MA. Association of coronary CT angiography or stress testing with subsequent utilization and spending among Medicare beneficiaries. JAMA2011;306:2128-2136
Hoffmann U, Truong QA, Fleg JL, et al. Design of the Rule Out Myocardial Ischemia/Infarction Using Computer Assisted Tomography: a multicenter randomized comparative effectiveness trial of cardiac computed tomography versus alternative triage strategies in patients with acute chest pain in the emergency department. Am Heart J2012;163:330-338
Abbara S, Arbab-Zadeh A, Callister TQ, et al. SCCT guidelines for performance of coronary computed tomographic angiography: a report of the Society of Cardiovascular Computed Tomography Guidelines Committee. J Cardiovasc Comput Tomogr 2009;3:190-204
Gerber TC, Carr JJ, Arai AE, et al. Ionizing radiation in cardiac imaging: a science advisory from the American Heart Association Committee on Cardiac Imaging of the Council on Clinical Cardiology and Committee on Cardiovascular Imaging and Intervention of the Council on Cardiovascular Radiology and Intervention. Circulation 2009;119:1056-1065
von Ballmoos MW, Haring B, Juillerat P, Alkadhi H. Meta-analysis: diagnostic performance of low-radiation-dose coronary computed tomography angiography. Ann Intern Med2011;154:413-420[Erratum, Ann Intern Med 2011;154:848.]
Achenbach S, Marwan M, Ropers D, et al. Coronary computed tomography angiography with a consistent dose below 1 mSv using prospectively electrocardiogram-triggered high-pitch spiral acquisition. Eur Heart J 2010;31:340-346
Than M, Cullen L, Reid CM, et al. A 2-h diagnostic protocol to assess patients with chest pain symptoms in the Asia-Pacific region (ASPECT): a prospective observational validation study. Lancet 2011;377:1077-1084
In the EDITORIAL by Redberg RF. Dr. Redberg, Cardiology Division, UCSF made the following points in:
Six million people present to ER annually with Acute Chest Pain, most have other diseases that Heart.
Current diagnostic methods lead to admission to the hospital, unnecessary stays and over-treatment – improvement of outcomes is needed.
Rule Out Myocardial Infarction Using Computer Assisted Tomography II (ROMICAT-II) 100 patients were randomly assigned to CCTA group or Standard Diagnosis Procedures Group in the ER which involved Stress Test in 74%.
CRITIQUE and Study FLAWS in MGH Study:
ROMICAT-II enrolled patients only during “weekday daytime hours, no weekend or nights when the costs are higher.
Assumption that a diagnostic test must be done before discharge for low-to-intermediate-risk patients is unproven and probably unwarranted.. No evidence that the tests performed let to improved outcomes.
Events rate for patient underwent CCTA, Stress test or no testing at al were less that 1% to have an MI, no one died. Thus, it is impossible to assign a benefit to the CCTA Group. So very low rates were observed in other studies
CCTA patients were exposed to substantial dose of Radiation, , contrast die,
Patients underwent ECG and Negative Troponin, no evidence that additional testing further reduced the risk.
Average age of patients: 54, 47% women.Demographic Characteristics with low incidence of CAD, NEJM, 1979; 300:1350-8
Risk of Cancer from radiation in younger population is higher, same in women.
Hoffmann’s Study: Radiation burden was clinically significant: Standard Evaluation Group: (4.7+-8.4 mSv), CCTA: (13.9+-10.4 mSv), exposure of 10 mSv have been projected to lead to 1 death from Cancer per 2000 persons, Arch Intern Med 2009; 169:2071-7
Middle Age women, increased risk of Breast Cancer from radiation, Arch Intern Med 2012 June 11 (ePub ahead of Print)
ROMICAT-II study: discharge diagnosis Acute Coronary Syndrome – less than 10%
CCTA Group: more tests, more radiation, more interventions tht the standard-evaluation group.
Choose Wisely Campaign – order test only when the benefit will exceed the risks
Dr. Redberd advocates ECG and Troponin, if NORMAL, no further testing.
Epicrisis on Part 1
Redberg’s conclusions are correct for the initial screening. The issue has been whether to do further testing for low or intermediate risk patients.
The most intriguing finding that is not at all surprising is that the CCTA added very little in the suspect group with small or moderate risk. My original studies using a receiver operator characteristic curve were very good, although some patients with CRF or ESRD had extremely high values. The ultra sensitive troponin threw the Area Under the ROC out the window, under the assumption that a perfect assay would exclude AMI, or any injury to the heart. The improved assay does pick up minor elevations of troponin in the absence of MI as a result of plaque rupture. It is possible that 50% of these elevations need medical attention, but then the question is an out of hospital referral or admission and further workup. I have discussed this at some length on several occasions with Dr. Jaffe at Mayo Clinic.
Many of those with minor or intermediate elevation have significant renal insufficiency, but they might also be in CKD Class 3 and not 1 or 2. The coexistence of Type 2 diabetes would go into the standard assessment, but is not mentioned in the study with respect to immediate admission or outcome 28 days after discharge.
The hs troponin I has been in daily use on the Ortho J&J (formerly Kodak) for about 2 years, and the QC standards are very high. I expected the Roche hs-TnT assay to be in use in US as well, but there may have been delays. Januzzi , Jaffe, and Fred Aplle would be involved in the evaluation in the US, but Paul Collinson in UK, Katus and Mair in Germany, and other Europena centers certainly have been using the Roche Assay.
The biggest problem in these studies is as my mentor called my attention to – the frontrunners aren’t going to support a nose-to-nose up front study. Given that a diagnosis requires more information at minimal cost, especially when diagnosis of the heart that are not MI have to be evaluated as well, it is incomprehensibe to me that such information as
mean arterial blood pressure,
natriuretic peptides,
the calculated EGFR are not used in the evaluation.
It is quite impossible to clear the deck when you have patients who don’t have
ST elevation,
depression, or
T-wave inversion who are seen for vague
(not to mention long QT abnormalities).
predordial tightness or shortness of breath
pain that resembles gall bladder.
Is this an indication of the obsolescence of the RCT.
A Retrospective Quality and Cost Driven Audit on Effect of hs cTn Assay with On-Site CT Followup. (No treadmill availability)
A retrospective multisite study showed that doing the hs cTn followed by CT on-site was a good choice for US.
I also considered the selective release of
low- moderate-risk patients cardiology followup in a timely manner.
This report is an excellent analysis of my point by Korley and Jaffe in Medscape, and satisfies some several years discussion
I have had with Dr. Jaffe, at Mayo Clinic. He pointed out the importance of
Type 1 and Type 2 AMI
at a discussion with Dr. Fred Apple at a meeting of the Amer Assn for Clinical Chemistry that he fully elaborates on here.
It is really a refinement of other proposals that are being discussed. It is also timely because hs cTnI is already being used
widely in the US, while there might be a holdup on the hs cTnT.
Highlights
Need for a Universally Accepted Nomenclature
Defining Uniform Criteria for Reference Populations
Discriminating Between Acute and Nonacute Causes of hs-cTn Elevations
Distinguishing Between Type 1 and Type 2 AMI
Analytical Imprecision in Cardiac Troponin Assays
Ruling Out AMI
Investigating the Causes of Positive Troponin Values in Non-AMI Patients
Risk Stratifying Patients With Nonacute Coronary Syndrome Conditions
Conclusions
Abstract
It is only a matter of time before the use of high-sensitivity cardiac
troponin assays (hs-cTn) becomes common throughout the United
States. In preparation for this inevitability, this article raises a number
of important issues regarding these assays that deserve consideration.
These include: the need for
the adoption of a universal nomenclature; the importance
of defining uniform criteria for reference populations;
the challenge of discriminating between acute and nonacute
causes of hs-cTn elevations, and
factors influencing the analytical precision of hs-cTn;
ascertaining the optimal duration of the rule-out period for AMI;
the need for further evaluation to determine the causes
of a positive hs-cTn in non-AMI patients; and
the use of hs-cTn to risk-stratify patients with disease conditions
other than AMI.
This review elaborates on these critical issues as a means of
educating clinicians and researchers about them.
Introduction
Recently, clinicians have begun to use the recommended cut-off values
for current generation cardiac troponin (cTn) assays:
the 99th percentile upper reference limit (URL).
Previously, there was reluctance to use these cut-off values because
of cTn elevations from non-acute ischemic heart disease conditions.
Thus, there was a tendency to use cut-off values for troponin that equated with the
prior gold standard diagnosis developed with less sensitive markers
creatinine kinase-MB isoenzyme (CK-MB) or
the lowest value at which assay achieved a 10%
coefficient of variation (CV),
which would reduce false-positive elevations (without plaque rupture).
The use of the 99th percentile URL increases the ability of these assays to detect both
acute myocardial infarction (AMI) and
structural cardiac morbidities.[1]
This change in practice should not be confused with
newer-generation high-sensitivity assays.
Improvements in the analytic performance of cTn assays have resulted in
superior sensitivity and precision.
Improved sensitivity occurs because of
more sensitive antigen binding and detection antibodies,
increases in the concentration of the detection probes on the tag antibodies,
increases in sample volume, and buffer optimization.[2]
Assays now are able to measure
10-fold lower concentrations with high precision
(a CV <10% at the 99th percentile of the URL).
The high-sensitivity cardiac troponin T (hs-cTnT) assay is already in clinical use
throughout most of the world. It is only a matter of time before high- sensitivity
assays are approved for use in the United States. In preparation for this, as well as
using the 99th percentile URL with contemporary assays,
there are a number of important issues that deserve consideration. Key concepts are included in (Table 1).
Table 1: Key ConceptsThere is a need to develop a universal nomenclature for troponin assays.There is a need for uniform criteria for selecting reference populations.The optimal delta criteria for distinguishing between acute and chronic cardiac injury remain unclear and are likely to be assay-specific.Distinguishing between type 1 and type 2 AMI is challenging, and more type 2 AMIs will be detected with hsTn assays.Factors affecting the analytical precision of troponin assays (including how we collect samples) will become more important with the use of hs-cTn assays.The optimal duration for ruling out AMI remains unclear;
novel approaches to this issue are being developed.
Elevated hs-cTn, regardless of the cause, has important
prognostic implications and deserves additional evaluation;
Many cases of chronic elevations can be evaluated in an outpatient setting.
Hs-cTn can be used to
risk-stratify patients with non-ACS cardiovascular comorbidities.
Need for a Universally Accepted Nomenclature
The literature is replete with terms used to refer to cTn assays.
We advocate the use of the term “high-sensitivity cardiac troponin assays” (hs-cTn) for
cTn assays that v measure cardiac troponin values in
in at least 50% of a reference population.[2,3]
This policy has now been embraced by the journal Clinical Chemistry. High-sensitivity
assays can be further categorized as well (Table 2) with respect to generations of cTn.
Table 2. Classification of High-Sensitivity Cardiac Troponin Assays
Category
Description
First Generation Able to measure cTn in
50%–75% of a reference population
Second Generation Able to measure cTn in
75%–95% of a reference population
Third Generation Able to measure cTn in > 95% a reference population
Adapted from Apple and Collinson (3)
Ideally, assays should have a CV of <10% at the 99th percentile value.
Assays that do not achieve this level are less sensitive which protects against
false-positive results, and they can be used.[4]
Defining Uniform Criteria for Reference Populations There is a lack of consistency in the types and numbers of subjects that constitute a reference
population.[2] Often, participants are included after simple screening by check list but without a
physical examination,
electrocardiogram, or
laboratory testing.
At other times, a
normal creatinine and/or a normal natriuretic peptide value is required.
Imaging to detect structural heart disease is rarely used.
Because it is known that
gender,
age,
race,
renal function,
heart failure, and
structural heart disease, including
increased left ventricular (LV) mass
are associated with increased cTn concentrations,[5,6,7] An assay’s 99th percentile value depends on the composition of the reference group. Thus, the more criteria used, the lower the reference values (Figure 1).[5]
LVEF > 50%; normal lung function; and no significant
valvular heart disease,
LVH,
diastolic HF, or
regional wall-motion abnormalities on ECHO.
The appropriate reference value to use clinically also is far from a settled issue.
It might be argued that
using a higher 99th percentile value for the elderly
allows comparison of the patient to his or her peers, but
in raising the cut-off value, if the increases are caused by comorbidities,
those who are particularly healthy will be disadvantaged.[8]
Gender and ethnicity are not comorbidities, and we would urge that those should be taken into account.
Regardless of the assay, there will need to be
99th percentile values for men that are different for women.[2]
The reference population for assay validation studies should ideally be based on –
demographic characteristics that mirror the U.S. population and include subjects whose
blood pressure,
serum glucose, and
creatinine and
natriuretic peptide values are
within the normal reference range and
who take no cardiac medications.
These subjects should be
free from structural heart disease,
documented by echocardiography,
cardiac magnetic resonance imaging (MRI) or
computed tomography (CT) angiography.
Meeting these criteria will be a major challenge, especially for older individuals.
A conjoint pool of samples collected with manufacturers’ support so that all methods were derived from an
identical patient population for their reference ranges would be ideal.
[However, the method of collection and possible freeze-thaw effects is unavoidable].
One large national effort might be advantageous over multiple efforts.
Discriminating Between Acute and Nonacute Causes of hs-cTn Elevations
With the ability to precisely measure small concentrations of cTn,
clinicians will be faced with the challenge of distinguishing patients
who have acute problems from those with chronic elevations from other causes.
Using the fourth-generation cTnT assay, approximately 0.7% of patients in
the general population have modest elevations >99th percentile URL.[11]
In the same population, this number was 2% with the hs-cTnT assay.[6] Only
half of them had documentation (even with imaging) of cardiac abnormalities.
If the prevalence of a positive cTnT is 2% in the general population,
it will likely be 10% or 20% in the emergency department (ED)
and even higher in hospitalized patients, as
these patients often have cardiac comorbidities.
Measurement of changes in hs-cTn over time (δ hs-cTn)
improves the specificity of hs-cTn for the diagnosis of acute cardiac injury.[12,13]
However, it does so at the cost of sensitivity. With contemporary assays, differences
in analytical variation have been used to define an increasing pattern.
At elevated values, CV for most assays is in the range of 5% to 7%, so
a change of 20% ensures that a given change is not caused
by analytical variation alone.[10]
At values near the 99th percentile URL, higher change values are necessary.[13] The situation with hs-cTn assays is much more complex, as follows:
1. Change criteria are unique for each assay.
2. It will be easy to misclassify patients with coronary artery disease who may present with a noncardiac cause of chest pain
but have elevated values.
They could be having unstable ischemia or elevations caused by structural cardiac abnormalities and noncardiac discomfort.
If hs-cTn is rising significantly, the issue is easy but
if the values are not rising, a diagnosis of AMI still might be made.
If so, some patients may be included as having AMI without a changing pattern.
This occurred in 14% patients studied by Hammarsten et al.[14]
If patients with elevated hs-cTn without a changing pattern are not called AMI,
should they be called patients with “unstable angina and cardiac injury” or patients with structural heart disease and noncardiac chest pain?
Perhaps both exist?
3. The release of biomarkers is flow-dependent.Thus, there may not always be rapid access to the circulation. An area of injury distal to a totally occluded vessel (when collateral channels close) may be different in terms of the dynAMIcs of
hs-cTn change than an intermittently occluded coronary artery.
4. Conjoint biological and analytical variation can be measured.
They are assay-dependent, and the reference change values range from 35% to 85%.[2]
The use of criteria less than that (which may be what is needed clinically) will thus
likely include individuals with changes caused by
conjoint biological and analytical variation alone.
This has been shown to be the case in
many patients with nonacute cardiovascular diagnoses.[14,15]
5. Most evaluations have attempted to define the optimal delta, often with receiver operator curve analysis. Such an approach is based on the concept that sensitivity and specificity deserve equivalent weight.[But higher deltas improve specificity more and lower ones improve sensitivity and it is not clear that all physicians want the same tradeoffs in this regard.]ED physicians often prefer high-sensitivity so that their miss rate is low (<1%),[16] whereas hospital clinicians want increased specificity. This tension will need to be addressed in defining the optimal delta.
6. The delta associated with AMI may be different from that associated with other cardiac injury.[14] In addition, women have less marked elevations of cTn in response to coronary artery disease[17] and in earlier studies were less apt to have elevated values.[18] Given their pathology is at times different,
it may be that different metrics may be necessary based on gender
7. Some groups have assumed that if a change is of a given magnitude over 6 hours, it can be divided by 6 and the 1-h values can be used.
This approach is not data driven, and biomarker release is more likely to be discontinuous rather than continuous.[19]
In addition, the values obtained with this approach are too small to be distinguished from a lack of change with most assays.
These issues pose a major challenge even for defining the ideal delta change value and provide the reasons why
the use of this approach will reduce sensitivity[20,21] (Figure 2).
Defining the Optimal Delta: Tension Between Sensitivity and Specificity
There is a reciprocal relationship between sensitivity and specificity. With marked percentage changes,
specificity is improved at the expense of sensitivity, and
at lower values, the opposite occurs.
In addition, there is controversy in regard to the metrics that should be used with high-sensitivity assays.
The Australian-New Zealand group proposed
a 50% change for hs-cTnT for values below 53 ng/l and
a 20% change above that value.[22]
The 20% change is much less than conjoint biological and analytical variation.
A number of publications have suggested the superiority of
absolute δ cTn compared to relative δ cTn in discriminating between AMI and non-AMI causes of elevated cTn.[23,24,25]
The utility of the absolute or relative δ cTn appears to depend on the initial cTn concentration, and
the major benefit may be at higher values.[23]
A recent publication by Apple et al.[26] calculates deltas in several different ways with a contemporary assay and
provides a template for how to do such studies optimally.[26]
If all studies were carried out in a similar fashion, it would help immensely. In the long run, institutions will need to
define the approach they wish to take. We believe this discussion is a critical one and should include
laboratory,
ED, and
cardiology professionals.
Distinguishing Between Type 1 and Type 2 AMI
Although δ cTn is helpful in distinguishing between AMI and nonacute causes of Tn release,
it may or may not be useful in discerning type 1 from type 2 AMI.
As assay sensitivity increases, it appears that the frequency of type 2 AMI increases.
Making this distinction is not easy.
Type 1 AMI is caused by a primary coronary event, usually plaque rupture.
It is managed acutely with aggressive anticoagulation and
revascularization (percutaneous coronary intervention or coronary artery bypass).[10]
Type 2 AMI typically evolves secondary to ischemia from an oxygen demand/supply mismatch
severe tachycardia and
hypo- or hypertension and the like,
with or without a coronary abnormality.
These events usually are treated by addressing the underlying abnormalities.
They are particularly common in patients who are
critically ill and those who
are postoperative.[27]
However, autopsy studies from patients with postoperative AMI often manifest plaque rupture.[28]
Thus, the more important events, even if less common, may be type 1 AMIs. Type 2 events
seem more common in women, who tend to have
more endothelial dysfunction,
more plaque erosion, and
less fixed coronary artery disease.[28-30]
Additional studies are needed to determine how best to make this clinical distinction.
For now, clinical judgment is recommended.
Analytical Imprecision in Cardiac Troponin Assays
All analytical problems will be more critical with hs-cTn assays. Cardiac troponin I (cTnI) and cardiac troponin T (cTnT) are measured using enzyme linked immune- sorbent assays.
quantification of hs-cTn can be influenced by interference by reagent antibodies to analyte (cTn), leading to false- positive or negative results.[31]
Autoantibodies to cTnI or cTnT are found in 5% to 20% of individuals and can reduce detection of cTn.[32,33]
Additionally, fetal cTn isoforms can be re-expressed in diseased skeletal muscle and detected by the cTnT assays, resulting in false-positive values.[34]
Several strategies, including the use of
blocking reagents,
assay redesign, and use of
antibody fragments,
have been used to reduce interference.[35–36]
There are differences in measured cTn values based on specimen type (serum versus heparinized plasma versus EDTA plasma).
In addition, hemolysis may affect the accuracy of cTn measurement,[37] and with blood draws from peripheral IV lines, common in ICU.
Ruling Out AMI
Studies evaluating the diagnostic performance of hs-cTn assays for the early diagnosis of AMI usually define AMI on
the basis of a rising and/or falling pattern of current generation cTn values.[21,38]
However, defining AMI on the basis of the less sensitive current generation assay results in an underestimation of the true prevalence of AMI and
an overestimation of negative predictive value of the experimental assay.
shortens the time it takes to rule in all the AMIs and
to definitively exclude AMI as it
ignores the new AMIs more sensitively detected by the hs-cTn assay.
Thus, in the study by Hammarsten et al.,[14]
the time to exclude all AMIs was 8.5 hours when all of the AMIs detected
with the high-sensitivity assay were included, whereas
others that do not include these additional events report this can be done
in 3 to 4 hours.[21,29,38]
In our view, Hammarsten is correct.
This does not mean that hs-cTn cannot help in excluding AMI. Body et al.[39] reported that patients who present with undetectable values (less than the LOB of the hs-cTnT assay) were unlikely to have adverse events during follow-up. If that group of patients is added to those who present later than 6 hours, then perhaps a significant proportion of patients
with possible acute coronary syndrome (ACS) could
have that diagnosis excluded with the initial value.[40]
studies need to continue to evaluate cTn values for at least 6 h
to define the frequency of additional AMIs detected in that manner.
Using follow-up evaluations of patients with small event rates
who are likely to have additional care during the follow-up period are likely to be underpowered.
It may be that better initial risk stratification may help with this, as recently reported.[16,41]
Low-risk patients who have good follow-up after an ED visit
may be a group that can be released as early as 2 h after presentation.[16]
Investigating the Causes of Positive Troponin Values in Non-AMI Patients
Elevated Tn values (including those obtained with high-sensitivity assays) are associated with
a 2-fold higher risk for longer-term all-cause mortality and
cardiovascular death than a negative troponin values.[6,42-44]
This association is dose-dependent.
If values are rising, they are indicative of acute cardiac injury.
Those patients should be admitted because the risk is often short-term. However,
if the values are stable, assuming the timing of any acute event would
allow detection of a changing pattern,
the risk, although substantive, in our view, often plays out in the longer term.[44]
Many of these individuals, assuming they are doing well clinically, can be evaluated outside of the hospital, in our view.
However, because such elevations are an indicator of a subclinical
cardiovascular injury, such evaluations should be early and aggressive.
Data from several studies suggest that there may well be risk far below the 99th percentile URL value.
Thus, it may evolve that patients in the upper ranges of the normal range also require some degree of cardiovascular evaluation.
Risk Stratifying Patients With Nonacute Coronary Syndrome Conditions
Patients who have a rising pattern of values have a higher risk of mortality than those with negative values regardless of the cause.
Investigations are ongoing to determine how well results from hs-cTn testing help to risk-stratify patients with
pulmonary embolism,[45]
congestive heart failure,[46]
sepsis,[47]
hypertensive emergency,[48] and
chronic obstructive pulmonary disease.[49]
Presently, the studies suggest that cTn values classify patients into clinically relevant risk subgroups. Studies are needed
to evaluate the incremental prognostic benefit of hs-cTn.
Conclusions
Routine use of hs-cTn assays in the United States is inevitable. These assays hold
the promise of
improving the sensitivity of AMI diagnoses,
shortening the duration of AMI evaluation and
improving the risk stratification of other noncardiac diagnoses.
However, to be able to fully realize their potential, additional studies are needed to address the
knowledge gaps we have identified. In the interim, clinicians need to
learn how to use the 99th% URL and
the concept of changing values
John Adan, MD, FACC
In 2008 CMS commissioned Yale University to analyze 30 days mortality after myocardial infarction in their hospitals.
The study has been based on review of medical records. Consensus criteria for diagnosis of myocardial infarction include
clinical symptoms,
EKG,
troponins,
CK MB,
ECHO,
cath,
histopathology, etc.
How the reviewed hospitals performed diagnostic coding is unknown. In clinical practice we are bombarded by consults
for elevated troponins due to causes other than myocardial infarction, like
pneumonia,
accelerated hypertension,
arrhythmias,
renal failure, etc.
The metric started out over 19%. Now it is below 15%, on average.
typical changes in CK-MB and cardiac troponin in Acute Myocardial Infarction (Photo credit: Wikipedia)
Phosphotungstic acid-haematoxylin staining demonstrating contraction band necrosis in an individual that had a myocardial infarction (heart attack). (Photo credit: Wikipedia)
In the November 23, 2012 issue of Science, Jocelyn Kaiser reports (Genetic Influences On Disease Remain Hidden in News and Analysis) on the difficulties that many genomic studies are encountering correlating genetic variants to high risk of type 2 diabetes and heart disease. American Society of Human Genetics annual 2012 meeting, results of DNA sequencing studies reporting on genetic variants and links to high risk type 2 diabetes and heart disease, part of an international effort to determine the genetic events contributing to complex, common diseases like diabetes.
The key point is that these disease links are challenged by the identification of genetic determinants that do not follow Mendelian Genetics. There are many disease associated gene variants, and they have not been deleted as a result of natural selection. In the case of diabetes (type 2), the genetic risk is a low as 26%.
Gene-wide-association studies (GAWS) have identified single nucleotide polymorphisms (SNPs) with associations for common diseases, most of these individually carry only only 20-40% of risk. This is not sufficient for prediction
and use in personalized treatment.
What is the implication of this. Researchers have gone to exome-sequencing and to whole genome sequencing for answers. SNPs can be easily done by microarray, and in a clinic setting. GWAS is difficult and has inherent complexity, and it has had high cost of use. But the cost of the technology has been dropping precipitously. Technology is being redesigned for more rapid diagnosis and use in clinical research and personalized medicine. It appears that this is not yet a game changer.
My own thinking is that the answer doesn’t fully lie in the genome sequencing, but that it must turn on the very large weight of importance in the regulatory function in the genome, that which was once “considered” dark matter. In the regulatory function you have a variety of interactions and adaptive changes to the proximate environment, and this is a key to the nascent study of metabolomics.
the common disease-common variant hypothesis, which predicts that common disease-causing genetic variants exist in all human populations, but (common unexplained complexity?) each individual variant will necessarily only have a small effect on disease susceptibility (i.e. a low associated relative risk).
the common disease, many rare variants hypothesis, which postulates that disease is caused by multiple strong-effect variants, (an alternative complexity situation?) Dickson et al. (2010) PLoS Biol 2010 8(1):e1000294
The reality is that it has been difficult to associate any variant with prediction of risk, but an alternative approach appears to be intron sequencing and missing information on gene-gene interactions.
Jocelyn Kaiser’s Science article notes this in a brief interview with Harry Dietz of Johns Hopkins University where he suspects that “much of the missing heritability lies in gene-gene interactions”.
Oliver Harismendy and Kelly Frazer and colleagues’ recent publication in Genome Biology http://genomebiology.com/content/11/11/R118 support this notion. The authors used targeted resequencing
of two endocannabinoid metabolic enzyme genes (fatty-acid-amide hydrolase (FAAH) and monoglyceride lipase (MGLL) in 147 normal weight and 142 extremely obese patients.
English: The human genome, categorized by function of each gene product, given both as number of genes and as percentage of all genes. (Photo credit: Wikipedia)
Causes and imaging features of false positives and false negatives on 18F-PET/CT in oncologic imaging
Author and Curator: Dror Nir, PhD
Article 11.4.1 Causes and imaging features of false positives and false negatives on 18FPET CT in oncologic imaging
Early this year I have posted on: Whole-body imaging as cancer screening tool; answering an unmet clinical need? F-PET/CT was discussed in this post as a leading modality in that respect. Here I report on an article dedicated to the sources for misdiagnosis; i.e. false negatives and false positives when applying this technology:
18F-FDG is a glucose analogue that is taken up by a wide range of malignancies. 18F-FDG PET-CT is now firmly established as an accurate method for the staging and restaging of various cancers. However, 18F-FDG also accumulates in normal tissue and other non-malignant conditions, and some malignancies do not take up F18-FDG or have a low affinity for the tracer, leading to false-positive and false-negative interpretations.
Methods
PET-CT allows for the correlation of two separate imaging modalities, combining both morphological and metabolic information. We should use the CT to help interpret the PET findings. In this article we will highlight specific false-negative and false-positive findings that one should be aware of when interpreting oncology scans.
Results
We aim to highlight post-treatment conditions that are encountered routinely on restaging scans that can lead to false-positive interpretations. We will emphasise the importance of using the CT component to help recognise these entities to allow improved diagnostic accuracy.
Conclusion
In light of the increased use of PET-CT, it is important that nuclear medicine physicians and radiologists be aware of these conditions and correlate the PET and CT components to avoid misdiagnosis, over staging of disease and unnecessary biopsies.
Introduction
[18F] 2-fluoro-2deoxy-D-glucose (18F-FDG) PET-CT imaging has become firmly established as an excellent clinical tool in the diagnosis, staging and restaging of cancer. 18F-FDG (a glucose analog) is taken up by cells via glucose transporter proteins. The glucose analog then undergoes phosphorylation by hexokinase to FDG-6 phosphate. Unlike glucose, FDG-phosphate does not undergo further metabolism and so becomes trapped in the cell as the cell membrane is impermeable to FDG-6 phosphate following phosphorylation [1].
Malignant tumors have a higher metabolic rate and generally express higher numbers of specific membrane transporter proteins than normal cells. This results in increased uptake of 18F-FDG by tumor cells and forms the basis of FDG-PET imaging [2]. Glucose however acts as a basic energy substrate for many tissues, and so 18F-FDG activity can be seen both physiologically and in benign conditions. In addition, not all tumors take up FDG [3–5]. The challenge for the interpreting physician is to recognize these entities and avoid the many pitfalls associated with 18F-FDG PET-CT imaging.
In this article we discuss false-positive and false-negative 18F-FDG PET-CT findings, common and atypical physiological sites of FDG uptake, and benign pathological causes of FDG uptake. We will focus on post-treatment conditions that can result in false-positive findings. We will highlight the importance of utilizing the CT component of the study, not only for attenuation correction but also in the interpretation of the study. The CT component of 18F-FDG PET-CT imaging can provide high-resolution anatomical information, which enables more accurate staging and assessment. For the purposes of this article, we refer to the descriptive terms “false-positive” and “false-negative” findings in the context of oncology imaging.
The authors acknowledge that there are recognized causes of FDG uptake that are not related to malignancy; however in this paper we refer to false-positive findings as FDG uptake that is not tumor related.
Patient preparation
Tumor uptake of FDG is reduced in the presence of raised serum glucose as glucose competes with FDG for uptake by the membrane transporter proteins. In order to prevent false-negative results, it is necessary for the patient to fast for at least 4–6 h prior to the procedure [6]. Induction of a euglycamic hypoinsulinaemic state also serves to reduce the uptake of glucose by the myocardium and skeletal muscle. In the fasting state, the decreased availability of glucose results in predominant metabolism of fatty acids by the myocardium. This reduces the intensity of myocardial uptake and prevents masking of metastatic disease within the mediastinum [6].
The radiotracer is administered intravenously (dose dependent on both the count rate capability of the system used and the patient’s weight), and the patient is left resting in a comfortable position during the uptake phase (60–90 min). Patient discomfort and anxiety can result in increased uptake in skeletal muscles of the neck and paravertebral regions. Muscular contraction immediately prior to or following injection can result in increased FDG activity in major muscle groups [6].
Patients are placed in a warm, quiet room with little stimulation, as speech during the uptake phase is associated with increased FDG uptake in the laryngeal muscles [7].
At our institution we perform the CT component with arms up except for head and neck studies where the arms are placed down by the side. This minimizes artifacts on CT. Depending on the type of cancer, oral contrast to label the bowel and intravenous contrast may also be given. The CT is performed with a full dose similar to a diagnostic CT, and lungs are analyzed following reconstruction with a lung algorithm. The PET scan is performed with 3–4 min per bed position; however the time per bed position will vary in different centers depending on both the dose of FDG administered and the specifications of the camera used for image acquisition. It is beyond the scope of this article to provide detailed procedure guidelines for 18F-FDG PET-CT imaging, and for this purpose we refer the reader to a comprehensive paper by Boellaard et al. [8].
Technical causes of false positives
Misregistration artifact
The evaluation of pulmonary nodules provides a unique challenge for combined PET-CT scanning due to differences in breathing patterns between CT and PET acquisition periods. CT imaging of the thorax is classically performed during a breath-hold; however PET images are acquired during tidal breathing, and this can contribute significantly to misregistration of pulmonary nodules on fused PET-CT images. Misregistration is particularly evident at the lung bases, which can lead to difficulty differentiating pulmonary nodules from focal liver lesions (Fig. 1) [9].
Fig. 1
18F-FDG PET-CT performed in a 65-year-old male with colorectal cancer. On the coronal PET images, a focus of increased FDG uptake is seen at the right lung base (black arrow). Contrast CT does not show any pulmonary nodules but does demonstrate a liver metastasis in the superior aspect of the right lobe of the liver (yellow arrow)
Acquiring CT imaging of the thorax during quiet respiration can help to minimize misregistration artifacts. It is also important to correlate your PET and CT findings by scrolling up and down to make sure that lesions match.
Injected clot
A further diagnostic pitfall in staging of intrathoracic disease can be caused by injected clot. Injection of radioactive clot following blood withdrawal into the syringe at the time of radiotracer administration can result in pulmonary hotspots [10]. The absence of a CT correlate for a pulmonary hotspot should raise the possibility of injected clot; however this is a diagnosis of exclusion, and it is important to carefully evaluate the adjacent slices to ensure the increased radiotracer activity does not relate to misregistration of a pulmonary nodule or hilar lymph node. The area of abnormal radiotracer uptake should also be closely evaluated on subsequent restaging CT to ensure there has been no interval development of an anatomical abnormality in the region of previously diagnosed injected clot (Fig. 2) [11].
Fig. 2
18F-FDG PET-CT performed in a 28-year-old male with an osteosarcoma of the femur. A focus of increased FDG uptake (yellow arrow) is identified in the left lower lobe with no CT correlate (a). A 3-month follow-up CT thorax again does not demonstrate any pulmonary nodules confirming that the uptake seen originally on the PET-CT was due to injected clot (b)
Injection artifact
Leakage of radiotracer into the subcutaneous tissues at the injection site or tissued injection can result in subcutaneous tracking of FDG along lymphatic channels in the arm. This can result in spurious uptake in axillary nodes distal to the injection site [12]. Careful attention must be paid to the technical aspects of the study to ensure accurate staging. Injection at the side contralateral to the site of disease is advised where feasible to allow differentiation between artifactual and metastatic uptake, particularly in breast cancer patients. The side of injection should also be clearly documented during administration of radiotracer, and this information should be available to the reader in order to ensure pathological FDG uptake is not spuriously attributed to injection artifact (Fig. 3).
Fig. 3
18F-FDG PET-CT performed in a 56-year-old woman with colorectal cancer. Some low grade FDG uptake is identified in non-enlarged right axillary nodes (yellow arrow) consistent with injection artifact
Imaging of metallic implants
The use of CT for attenuation correction negates the need for traditional transmission attenuation correction, reducing scanning time. There are however technical factors relating to the use of CT imaging for attenuation correction, which lead to artefacts when imaging metal [9]. The presence of metal implants in the body produces streak artifact on CT imaging and degrades image quality. When CT images are used for attenuation correction, the presence of metal results in over attenuation of PET activity in this region and can result in artifactual ‘hot spots.’ Metal prostheses, dental fillings, indwelling ports and breast expanders and sometimes contrast media are common causes of streak artifact secondary to high photon absorption and can cause attenuation correction artifacts [9]. In order to avoid false positives, particularly when imaging metallic implants careful attenuation should be paid to the nonattenuation corrected images, which do not produce this artifact.
Sites of physiological FDG uptake
Physiological uptake in a number of organs is readily recognized and rarely confused with malignancy. These include cerebral tissue, the urinary system, liver and spleen. Approximately 20% of administered activity is renally excreted in the 2 h post-injection resulting in intense radiotracer activity in the renal collecting systems, ureters and bladder [13]. In order to minimize the intensity of renal activity, patients are advised to void prior to imaging. Moderate physiological FDG uptake is noted in the liver, spleen, GI tract and salivary glands. Uptake in the cecum and right colon tends to be higher than in the remainder of the colon due to the presence of glucose-avid lymphocytes [14].
Other sites of physiological FDG activity can be confused with malignancy. Examples include activity within brown fat, adrenal activity, uterus and ovaries.
Brown fat
FDG uptake in hyper-metabolic brown adipose tissue is well recognized as a potential source of false positive in 18F-FDG PET-CT imaging. The incidence of FDG uptake in brown fat has been reported as between 2.5–4% [15, 16].
Hypermetabolic brown fat is more commonly identified in children than in adults and is more prevalent in females than in males. It occurs more frequently in patients with low body mass index and in cold weather [15].
Glucose accumulation within brown fat is increased by sympathetic stimulation as brown fat is innervated by the sympathetic nervous system. In view of this, administration of oral propranolol is advised by some authors as it has been shown to reduce the uptake of FDG by brown fat [17]. This is not performed at our institution; however, attempts are made to reduce FDG uptake in brown fat by maintaining a warm ambient temperature and providing patients with blankets during the uptake phase.
The typical distribution of brown fat in a bilateral symmetric pattern in the supraclavicular and neck regions is rarely confused with malignancy. In cases where hypermetabolic brown fat is seen to surround lymph nodes, the CT images should be separately evaluated to allow morphological assessment of the lymph nodes. The classical CT features of pathological replacement of lymph nodes should be sought, namely increased short axis diameter, loss of the fatty hilum and loss of the normal concavity of the lymph node. If the morphology of the lymph node is entirely normal, malignancy can be confidently excluded and the increased uptake attributed to brown fat [18].
Atypical brown fat in the mediastinum can be misinterpreted as nodal metastases and has been identified in the paratracheal, paraoesophageal, prevascular regions, along the pericardium and in the interatrial septum. Extramediastinal sites of brown fat uptake include the paravertebral regions, perinephric, perihepatic and subdiaphragmatic regions and in the intraatrial septum [16].
The absence of an anatomical lesion on CT imaging in areas of FDG uptake should raise the possibility of brown fat to the reader. Careful evaluation of the CT images must be performed to confirm the presence of adipose tissue in the anatomical region correlating to the increased FDG activity on 18F-FDG PET before this activity be attributed to brown fat.
An awareness of the possibility of brown fat in atypical locations is vital to avoid overstaging, and correlation with CT imaging increases reader confidence in differentiating brown fat from malignancy (Fig. 4).
Fig. 4
18F-FDG PET-CT surveillance scan performed in a 36-year-old male with a history of seminoma. Symmetrical uptake is noted in the neck, supraclavicular fossa and paravertebral regions consistent with typical appearance of brown fat activity (black arrow). Brown fat uptake is also seen in the left supradiaphragmatic region and left paraoesophageal region (yellow arrow) (a). 18F-FDG PET-CT performed in a 48-year-old male with a history of colorectal cancer. Increased FDG uptake is noted within brown fat associated with lipomatous hypertrophy of the intra-atrial septum (b)
Uterine and ovarian uptake
In premenopausal women endometrial uptake of FDG varies cyclically and is increased both at ovulation and during the menstrual phase of the cycle with mean SUV values of 3.5–5 [19]. Endometrial uptake in postmenopausal women is abnormal and warrants further investigation; however benign explanations for increased FDG uptake include recent curettage, uterine fibroids and endometrial polyps [19].
Benign ovarian uptake of FDG in premenopausal women can be associated with ovulation. In postmenopausal women, ovarian uptake of FDG should be further investigated (Fig. 5).
Fig. 5
18F-FDG PET-CT performed in a 42-year-old premenopausal female with breast cancer. She was scanned during menstruation. FDG uptake is noted within metastatic right axillary nodes (black arrow). Increased FDG uptake is also noted within the endometrial canal of the uterus (yellow arrow), which is thickened on CT, consistent with active menstruation (a). 18F-FDG PET-CT performed in the same 42-year-old woman at a different stage in her menstrual cycle showing resolution of the previously identified uterine uptake (yellow arrow) (b)
Adrenal uptake
18F-FDG PET imaging is commonly used for evaluation of adrenal masses in patients with diagnosed malignancies. Similarly incidental adrenal lesions are commonly identified on staging 18F-FDG PET-CT imaging. The positive predictive value of 18F-FDG PET-CT evaluation of adrenal lesions has been reported as high as 95% with a similarly high negative predictive value of 94% [20].
Causes of false-positive adrenal lesions include angiomyolipoma, adrenal hyperplasia and adrenal adenomas (up to 5%) [21, 24]. FDG activity greater than that of the liver is generally associated with malignancy; however benign lesions have been reported with greater activity than liver [21].
Evaluation of the CT component can provide additional diagnostic information with identification of HU attenuation values of <10 on noncontrast CT for adrenal adenomas or fat-containing myelolipomata [21].
Symmetrical intense FDG activity with no identifiable abnormality on CT is associated with benign physiological FDG uptake (Fig. 6).
Fig. 6
18F-FDG PET-CT performed in a 50-year-old woman with inflammatory breast cancer. Diffuse increased FDG uptake is noted within the right breast (yellow arrow) and in a right axillary node (black arrow), consistent with malignancy (a). Increased symmetrical uptake is also noted within both adrenal glands with no abnormal correlate on CT (yellow arrow) (b). Post-chemotherapy PET-CT performed 5 months later demonstrates resolution of the activity within the breast, increased uptake in the bone marrow consistent with post treatment effect (black arrow) and persistent increased uptake in the adrenal glands (yellow arrow), confirming benign physiological activity (c)
Thyroid uptake
Thyroid uptake is incidentally identified on 18F-FDG PET imaging with a frequency of almost 4%, with a diffuse uptake pattern in roughly half of cases and a focal pattern in the remainder [22]. The majority of diffuse uptake represents chronic thyroiditis, multinodular goiter or Graves’ disease, whereas focal uptake is associated with a risk of malignancy that ranges from 30.9–63.6% in published studies [22, 23]. Focal thyroid uptake requires further investigation with ultrasound and tissue biopsy.
Uptake in the gastrointestinal tract
The pattern of physiological uptake within the GI tract is highly variable. Low-grade linear uptake is likely related to smooth muscle activity and swallowed secretions. More focal increased uptake in the distal esophagus is sometimes seen with Barrett’s esophagus. In view of this, referral for OGD may be reasonable in cases of increased uptake in the distal esophagus [14, 24].
The typical pattern of FDG uptake in the stomach is of low-grade activity in a J-shaped configuration. Small bowel typically demonstrates mild heterogeneous uptake throughout. Common pitfalls of small bowel evaluation relate to spuriously high uptake in underdistened or overlapping loops of bowel [14, 25].
Within the colon, FDG uptake is highly variable, however can be quite avid particularly in the cecum, right colon and rectosigmoid regions. Focal areas of FDG activity within the colon that are of greater intensity than background liver uptake should raise the suspicion of a colonic neoplasm (Fig. 7) [25, 26].
Fig. 7
18F-FDG PET-CT restaging scan performed in a 65-year-old female with a history of breast cancer. Incidental focal uptake is identified in the ascending colon where some abnormal thickening is seen on the CT component (yellow arrow). Colonoscopy confirmed the presence of a T3 adenocarcinoma
In a review of over 3,000 patients’ focal areas of abnormal FDG uptake within the gastrointestinal tract (GIT) were identified in 3% of cases of staging 18F-FDG PET-CT studies.
Incidental malignant lesions were identified in 19% of these patients with pre-malignant lesions including adenomas in 42% of the patients [27]. In view of this endoscopy referral is recommended in the absence of a clear benign correlate for focal areas of avid uptake on CT imaging.
Treatment-related causes of false-positive uptake
There are a number of conditions that can occur in patients undergoing treatment for cancer. When imaging these patients to assess for response, we often see these treatment-related conditions. It is important to recognize the imaging features to avoid misdiagnosis.
Thymus/thymic hyperplasia
Thymic hyperplasia post-chemotherapy is a well-described phenomenon. It is generally seen in children and young adults at a median of 12 months post chemotherapy [28]. The presence of increased FDG uptake in the anterior mediastinum can be attributed to thymic hyperplasia by identification of a triangular soft tissue density seen retrosternally on CT with a characteristic bilobed anatomical appearance [29]. In the presence of thymic hyperplasia, there is generally preservation of the normal shape of the gland despite an increase in size [30].
Superior mediastinal extension of thymic tissue is an anatomical variant that has been described in children and young adults (Fig. 8).
Fig. 8
A 3.5-year-old boy with abdominal Burkitt’s lymphoma. Coronal 18F-FDG PET scan obtained 5 months after completion of treatment shows increased activity in the thymus in an inverted V configuration and in superior thymic extension (white arrow). Note physiologic activity within the right neck in the sternocleidomastoid muscle (a). Axial CT image from the same 18F-FDG PET-CT study performed 5 months after treatment shows a nodule (white arrow) anteromedial to the left brachiocephalic vein (b). Axial fusion image shows that the FDG activity in the superior mediastinum corresponds to this enlarged nodule anteromedial to left brachiocephalic vein (white arrow) (c). Axial fusion image shows increased activity in an enlarged thymus consistent with thymic hyperplasia (white arrow; standardized uptake value 3.0) of similar intensity to activity in superior mediastinum (d)
It presents as a soft tissue nodule anteromedial to the left brachiocephalic vein and represents a remnant of thymic tissue along the path of migration in fetal life. In patients with thymic hyperplasia, a superior mediastinal nodule in this location may represent accessory thymic tissue. An awareness of this physiological variant is necessary to prevent misdiagnosis [28].
G-CSF changes
Granulocyte colony-stimulating factor is a glycoprotein hormone that regulates proliferation and differentiation of granulocyte precursors. It is used to accelerate recovery from chemotherapy-related neutropaenia in cancer patients. Intense increased FDG uptake is commonly observed in the bone marrow and spleen following GCSF therapy; however the bone marrow response to GCSF can be differentiated from pathological infiltration by its intense homogeneous nature without focally increased areas of FDG uptake. Increased FDG uptake attributable to GCSF uptake rapidly decreases following completion of therapy and generally resolves within a month (Fig. 9).
Fig. 9
18F-FDG PET-CT performed in a 46-year-old male post four cycles of chemotherapy for lymphoma and 2 weeks post administration of G-CSF. Note the diffuse homogeneous increased uptake throughout the bone marrow and the increased uptake in the spleen (yellow arrow)
Marked uptake in the bone marrow can also be seen following chemotherapy, reflecting marrow activation [31, 32].
Radiation pneumonitis
Inflammatory morphological changes in the radiation field post-irradiation of primary or metastatic lung tumor can result in false-positive diagnosis. Radiation pneumonitis typically occurs following high doses of external beam radiotherapy (>40 Gy). In the acute phase (1–8 weeks) radiation pneumonitis is characterized by ground-glass opacities and patchy consolidation. This can commonly lead to a misdiagnosis of infection. Chronic CT appearances of fibrosis and traction bronchiectasis in the radiation field allow correct interpretation of increased FDG uptake as radiation pneumonitis as opposed to disease recurrence [33, 34]. Other organs are also sensitive to radiation, and persistent uptake due to inflammatory change can persist for up to 1 year. It is important to elicit a history of radiation from the patient and to correlate the increased uptake with the CT findings to avoid missing a disease recurrence (Fig. 10).
Fig. 10
18F18-FDG PET-CT performed in a 52-year-old male with newly diagnosed esophageal carcinoma. Increased FDG uptake is identified within the esophagus (black arrow) and an upper abdominal lymph node (yellow arrow), consistent with malignancy (a). 18F18-FDG PET-CT performed 6 weeks post-completion of radiotherapy for esophageal carcinoma. Linear increased uptake is identified along the mediastinum in the radiation port (black arrow). This corresponds to areas of ground-glass change on CT (yellow arrow) consistent with acute radiation change (b)
Infection
Bone marrow suppression places chemotherapy patients at increased risk of infection.
Inflammatory cells such as neutrophils and activated macrophages at the site of infection or inflammation actively accumulate FDG [35].
In the post-therapy setting it has been reported that up to 40% of FDG uptake occurs in non-tumor tissue [12]. Infection is one of the most common causes of false-positive 18F-FDG PET-CT findings post-chemotherapy. Chemotherapy patients are susceptible to a wide variety of infections, including upper respiratory chest infections, pneumonia, colitis and cholecystitis. Reactivation of tuberculous infection can occur in immunocompromised patients post,chemotherapy, and correlation with CT imaging can prevent misdiagnosis in suspected cases.
Atypical infections such as cryptococcosis and pneumocystis can also present as false-positives on FDG imaging (Fig. 11) [36].
Fig. 11
18F-FDG PET-CT performed in a 57-year-old male 2 weeks following chemotherapy for lung cancer. Increased FDG uptake is noted within the cecum (black arrow). On CT there is some thickening of the cecal wall and stranding of the pericecal fat (yellow arrow) consistent with typhilits
Surgery and radiotherapy
There are inherent challenges in the interpretation of 18F-FDG PET-CT imaging in the postoperative patient. Non-tumor-related uptake of FDG is frequently identified in post-operative wound sites, at colostomy sites or at the site of post-radiation inflammatory change. 18F-FDG PET-CT imaging during the early postoperative/post-radiotherapy period may result in overstaging of patients because of non-neoplastic uptake of FDG [12]. Careful evaluation of the CT component in this setting is vital as CT imaging can provide valuable additional information regarding benign inflammatory conditions commonly encountered in the postoperative setting such as abscesses or wound infection. These conditions are often readily apparent on CT, particularly when oral and/or IV contrast CT is administered.
The reader should also bear in mind that avid uptake of FDG at postoperative/post radiotherapy sites may mask malignant FDG uptake in neighboring structures. In order to minimize non-tumoral uptake of FDG, it is advisable to allow at least 6 weeks post-surgery or completion of radiotherapy prior to performing staging 18F-FDG PET-CT [24].
Talc pleurodesis
Talc pleurodesis is a commonly performed procedure for the treatment of persistent pneumothorax or pleural effusion. The fibrotic/inflammatory reaction results in increased FDG uptake on 18F-FDG PET imaging with corresponding high-density areas of pleural thickening on CT. SUV values of between 2–16.3 have been seen years after the procedure [37].
When increased FDG uptake is indentified in the pleural space in a patient with a known history of pleurodesis, correlation with CT is recommended to detect pleural thickening of increased attenuation that suggests talc rather than tumor.
It is extremely important that a comprehensive history with relevant surgical interventions is available to the reader in order to ensure accurate diagnosis and staging (Fig. 12).
Fig. 12
18F-FDG PET-CT performed in a 69-year-old male with a history of non-Hodgkin’s lymphoma. The patient had a previous talc pleurodesis for a persistent left pleural effusion. Increased FDG activity is identified within the left pleura (black arrow). CT demonstrates a pleural effusion with high density material along the left pleural surface consistent with talc (yellow arrow)
Flare phenomenon
Bone healing is mediated by osteoblasts, and an early increase in osteoblast activity on successful treatment of metastatic disease has been described [38]. “Bone flare” refers to a disproportionate increase in bone lesion activity on isotope bone scan despite evidence of a therapeutic response to treatment in other lesions and has been well described in breast, prostate and lung tumors. ‘Flare phenomenon’ has also been described on 18F-FDG PET-CT in patients with lung and breast cancer who are receiving chemotherapy [39].
Differentiating between increased FDG uptake due to flare response and true disease progression may not be possible in the early post-treatment studies. While it is recognized that bone flare is a rare phenomenon, an increase in baseline skeletal activity and appearance of new bone lesions despite apparent response or stable disease elsewhere should be interpreted with caution to avoid erroneously suggesting progressive disease.
Osteonecrosis
Osteonecrosis or avascular necrosis has been well described as a complication of combination chemotherapy treatment, especially where it includes intermittent high-dose corticosteroids (e.g., lymphoma patients) [40]. Commonly encountered sites include the hip and less frequently the proximal humerus. Occasionally we can see a discrete entity known as jaw osteonecrosis. Patients receiving IV bisphosphonates for the management of bone metastases are at an increased risk of developing this [41]. The development of osteonecrosis in the mandible is frequently preceded by tooth extraction. Radiographic findings that may be visualized on CT include osteosclerosis, dense woven bone, thickened lamina dura and sub-periosteal bone deposition [42]. FDG uptake can be seen in areas of osteonecrosis (Fig. 13).
Fig. 13
18F-FDG PET-CT performed in a 46-year-old gentleman with a history of non-Hodgkin’s lymphoma. Increased FDG uptake is identified in the right proximal humerus (black arrow). CT of the area demonstrates a corresponding vague area of sclerosis (yellow arrow). Biopsy of the area yielded osteonecrosis with no evidence of metastatic disease
Insufficiency fractures
Pelvic insufficiency fractures have been described following irradiation for gynecological, colorectal, anal and prostate cancer. They commonly occur within 3–12 months post-radiation treatment, and osteoporosis is often a precipitating factor. FDG uptake in insufficiency fractures ranges from mild and diffuse to intense and heterogeneous. The maximum SUV values are variable with reported values of between 2.4–7.2 [43]. Differentiating insufficiency fractures from bone metastases can prove challenging; however they are often bilateral and occur in characteristic locations within the radiation field—sacral ala, pubic rami and iliac bones. Biopsy of insufficiency fractures can lead to irreparable damage and so careful correlation of 18F-FDG PET imaging with the CT component along with radiation history is vital for correct diagnosis. CT allows evaluation of the bone cortex and adjacent soft tissues, which can confirm the diagnosis of a pathological fracture or a metastatic deposit.
Follow-up of suspected insufficiency fractures demonstrates a reduction in FDG uptake over time (Fig. 14) [43].
Fig. 14
18F-FDG PET-CT performed in a 46-year-old female, 3 years post-chemo-radiation for cervical carcinoma. Low grade FDG uptake is identified in the left acetabulum and right pubic bone (black arrow). CT demonstrates pathological fractures in these areas consistent with insufficiency fractures (yellow arrow)
Sarcoidosis
Sarcoidosis is a chronic multisystem disorder characterized by non-caseating granulomas and derangement of normal tissue architecture [36]. Sarcoidosis has been reported in association with a variety of malignancies either synchronously or post-chemotherapy. Aggregation of inflammatory cells post-chemotherapy is associated with accumulation of FDG, and the intensity of FDG uptake may correlate with disease activity [36].
When suspected disease recurrence presents with signs and symptoms compatible with sarcoidosis (i.e., mediastinal and bihilar lymphadenopathy), this must be excluded by clinical, radiological and pathological correlation to prevent mistreatment (Fig. 15).
Fig. 15
18F-FDG PET-CT performed in a 67-year-old male for restaging of laryngeal carcinoma. Increased FDG uptake is noted in the left lower neck and left mediastinum (black arrow). CT demonstrates lymphadenopathy in these areas (yellow arrow), some of which are calcified. Biopsy of the left lower neck node confirmed sarcoidosis
FDG-PET negative tumors
There are a number of malignancies that can be FDG-PET negative. Examples include bronchoalveolar carcinoma and carcinoid tumors in the lung, renal cell carcinomas and hepatomas, mucinous tumors of the GIT and colon, and low grade lymphomas [3, 44–48]. Careful evaluation of the CT component of the study however will prevent a misdiagnosis (Fig. 16).
Fig. 16
18F-FDG PET-CT performed in a 52-year-old female with breast cancer and chronic hepatitis. On the CT component a hyper-enhancing mass is identified in segment 4 of the liver (yellow arrow). No increased FDG activity is identified in this area on the PET component. Biopsy of the mass confirmed the diagnosis of a hepatocellular carcinoma
Osteoblastic metastases
Bone metastases are diagnosed in up to 85% of patients with advanced breast cancer, leading to significant morbidity and mortality. Sclerotic bone metastases are commonly associated with breast carcinoma [49].18F-FDG PET imaging is superior to nuclear bone scan in detection of osteolytic breast metastases; however it commonly fails to diagnose osteoblastic or sclerotic metastases [50]. Review of bony windows on CT imaging allows identification of sclerotic metastases and ensures accurate staging of metastatic bone disease (Fig. 17).
Fig. 17
Staging 18F-FDG PET-CT performed in a 45-year-old female with newly diagnosed breast cancer. CT demonstrates multiple small sclerotic foci in the spine and pelvis (yellow arrow), consistent with bony metastases. These are FDG negative on the PET component of the study
Discussion/conclusion
18F-FDG PET imaging has dramatically changed cancer staging, and findings of restaging studies commonly effect changes in treatment protocols. 18F-FDG however is not tumor specific. As interpreting physicians we need to be aware of these false positives and false negatives. In this review we have outlined atypical physiological sites of FDG uptake along with common causes of FDG uptake in benign pathological conditions, many of which are treatment related. With 18F-FDG PET-CT we have the advantage of two imaging modalities. The PET component gives us functional information and the CT, anatomical data. We have discussed the importance of dual-modality imaging and correlation with CT imaging of the above conditions. Furthermore CT imaging provides important diagnostic information in evaluation of tumors that poorly concentrate FDG. In light of the increased reliance of 18F-FDG PET-CT for cancer staging, it is vital that radiologists and nuclear medicine physicians be aware of pitfalls in 18F-FDG PET-CT imaging and correlate PET and CT components to avoid misdiagnosis, overstaging of disease and unnecessary biopsies.
Other research papers related to the use of 18F-PET in management of cancer were published on this Scientific Web site:
Pauwels EK, Ribeiro MJ, Stoot JH et al (1998) FDG accumulation and tumor biology. Nucl Med Biol 25:317–322PubMedCrossRef
2.
Wahl RL (1996) Targeting glucose transporters for tumor imaging: “sweet” idea, “sour” result. J Nucl Med 37(6):1038–1041PubMed
3.
Kim BT, Kim Y, Lee KS, Yoon SB, Cheon EM, Kwon OJ, Rhee CH, Han J, Shin MH (1998) Localized form of bronchioalveolar carcinoma: FDG PET findings. AJR 170(4):935–939PubMed
4.
Hoh CK, Hawkins RA, Glaspy JA, Dahlbom M, Tse NY, Hoffman EJ, Schiepers C, Choi Y, Rege S, Nitzsche E (1993) Cancer detection with whole-body PET using 2-[18F]fluoro-2-deoxy-D-glucose. J Comput Assist Tomogr 17(4):582–589PubMedCrossRef
5.
Fenchel S, Grab D, Nuessle K, Kotzerke J, Rieber A, Kreienberg R, Brambs HJ, Reske SN (2002) Asymptomatic adnexal masses: correlation of FDG PET and histopathologic findings. Radiology 223(3):780–788PubMedCrossRef
6.
Shreve PD, Anzai Y, Wahl RL (1999) Pitfalls in oncologic diagnosis with FDG PET imaging: physiologic and benign variants. Radiographics 19(1):61–77, quiz 150–151PubMed
7.
Abouzied MM, Crawford ES, Nabi HA (2005) 18 F-FDG imaging: pitfalls and artifacts. J Nucl Med Technol 33(3):145–155PubMed
8.
Boellaard R, O’Doherty MJ, Weber WA, Mottaghy FM, Lonsdale MN, Stroobants SG, Oyen WJ, Kotzerke J, Hoekstra OS, Pruim J, Marsden PK, Tatsch K, Hoekstra CJ, Visser EP, Arends B, Verzijlbergen FJ, Zijlstra JM, Comans EF, Lammertsma AA, Paans AM, Willemsen AT, Beyer T, Bockisch A, Schaefer-Prokop C, Delbeke D, Baum RP, Chiti A, Krause BJ (2010) FDG PET and PET/CT: EANM procedure guidelines for tumour PET imaging: version 1.0. Eur J Nucl Med Mol Imaging 37(1):181–200PubMedCrossRef
9.
Sureshbabu W, Mawlawi O (2005) PET/CT imaging artifacts. J Nucl Med Technol 33(3):156–161, quiz 163–164PubMed
10.
Lin E, Alavi A (2009) PET and PET/CT: A Clinical Guide: 2nd Edn. Thieme New York p 145
11.
Hany TF, Heuberger J, von Schulthess GK (2003) Iatrogenic FDG foci in the lungs: a pitfall of PET image interpretation. Eur Radiol 13(9):2122–2127, Epub 2002 Oct 17PubMedCrossRef
12.
Kazama T, Faria SC, Varavithya V, Phongkitkarun S, Ito H, Macapinlac HA (2005) FDG PET in the evaluation of treatment for lymphoma: clinical usefulness and pitfalls. Radiographics 25(1):191–207PubMedCrossRef
13.
Swanson DP, Chilton HM, Thrall JH (1990) Pharmaceuticals in medical imaging. Macmillan, New York
14.
Prabhakar HB, Sahani DV, Fischman AJ, Mueller PR, Blake MA (2007) Bowel hot spots at PET-CT. Radiographics 27(1):145–159PubMedCrossRef
15.
Yeung HW, Grewal RK, Gonen M, Schöder H, Larson SM (2003) Patterns of (18)F-FDG uptake in adipose tissue and muscle: a potential source of false-positives for PET. J Nucl Med 44(11):1789–1796PubMed
16.
Truong MT, Erasmus JJ, Munden RF, Marom EM, Sabloff BS, Gladish GW, Podoloff DA, Macapinlac HA (2004) Focal FDG uptake in mediastinal brown fat mimicking malignancy: a potential pitfall resolved on PET/CT. Am J Roentgenol 183(4):1127–1132
17.
Söderlund V, Larsson SA, Jacobsson H (2007) Reduction of FDG uptake in brown adipose tissue in clinical patients by a single dose of propranolol. Eur J Nucl Med Mol Imaging 34(7):1018–1022PubMedCrossRef
18.
Sumi M, Ohki M, Nakamura T (2001) Comparison of sonography and CT for differentiating benign from malignant cervical lymph nodes in patients with squamous cell carcinoma of the head and neck. AJR 176(4):1019–1024PubMed
19.
Lerman H, Metser U, Grisaru D, Fishman A, Lievshitz G, Even-Sapir E (2004) Normal and abnormal 18 F-FDG endometrial and ovarian uptake in pre- and postmenopausal patients: assessment by PET/CT. J Nucl Med 45(2):266–271PubMed
20.
Lu Y, Xie D, Huang W, Gong H, Yu J (2010) 18 F-FDG PET/CT in the evaluation of adrenal masses in lung cancer patients. Neoplasma 57(2):129–134PubMedCrossRef
21.
Boland GW, Blake MA, Holalkere NS, Hahn PF (2009) PET/CT for the characterization of adrenal masses in patients with cancer: qualitative versus quantitative accuracy in 150 consecutive patients. AJR Am J Roentgenol 192(4):956–962PubMedCrossRef
22.
Chen W, Parsons M, Torigian DA, Zhuang H, Alavi A (2009) Evaluation of thyroid FDG uptake incidentally identified on FDG-PET/CT imaging. Nucl Med Commun 30(3):240–244PubMedCrossRef
23.
Choi JY, Lee KS, Kim HJ, Shim YM, Kwon OJ, Park K, Baek CH, Chung JH, Lee KH, Kim BT (2006) Focal thyroid lesions incidentally identified by integrated 18 F-FDG PET/CT: clinical significance and improved characterization. J Nucl Med 47(4):609–615PubMed
Kei PL, Vikram R, Yeung HW, Stroehlein JR, Macapinlac HA (2010) Incidental finding of focal FDG uptake in the bowel during PET/CT: CT features and correlation with histopathologic results. AJR Am J Roentgenol 194(5):W401–W406PubMedCrossRef
26.
Pandit-Taskar N, Schöder H, Gonen M, Larson SM, Yeung HW (2004) Clinical significance of unexplained abnormal focal FDG uptake in the abdomen during whole-body PET. AJR Am J Roentgenol 183(4):1143–1147PubMed
27.
Kamel EM, Thumshirn M, Truninger K, Schiesser M, Fried M, Padberg B, Schneiter D, Stoeckli SJ, von Schulthess GK, Stumpe KD (2004) Significance of incidental 18 F-FDG accumulations in the gastrointestinal tract in PET/CT: correlation with endoscopic and histopathologic results. J Nucl Med 45(11):1804–1810PubMed
28.
Smith CS, Schöder H, Yeung HW (2007) Thymic extension in the superior mediastinum in patients with thymic hyperplasia: potential cause of false-positive findings on 18 F-FDG PET/CT. AJR Am J Roentgenol 188(6):1716–1721PubMedCrossRef
29.
Ferdinand B, Gupta P, Kramer EL (2004) Spectrum of thymic uptake at 18 F-FDG PET. Radiographics 24(6):1611–1616PubMedCrossRef
30.
Baron RL, Lee JK, Sagel SS, Levitt RG (1982) Computed tomography of the abnormal thymus. Radiology 142(1):127–134PubMed
31.
Hollinger EF, Alibazoglu H, Ali A, Green A, Lamonica G (1998) Hematopoietic cytokine-mediated FDG uptake simulates the appearance of diffuse metastatic disease on whole-body PET imaging. Clin Nucl Med 23(2):93–98PubMedCrossRef
32.
Kazama T, Swanston N, Podoloff DA, Macapinlac HA (2005) Effect of colony-stimulating factor and conventional- or high-dose chemotherapy on FDG uptake in bone marrow. Eur J Nucl Med Mol Imaging 32(12):1406–1411PubMedCrossRef
33.
Claude L, Pérol D, Ginestet C, Falchero L, Arpin D, Vincent M, Martel I, Hominal S, Cordier JF, Carrie C (2004) A prospective study on radiation pneumonitis following conformal radiation therapy in non-small-cell lung cancer: clinical and dosimetric factors analysis. Radiother Oncol 71(2):175–181PubMedCrossRef
34.
Frank A, Lefkowitz D, Jaeger S, Gobar L, Sunderland J, Gupta N, Scott W, Mailliard J, Lynch H, Bishop J et al (1995) Decision logic for retreatment of asymptomatic lung cancer recurrence based on positron emission tomography findings. Int J Radiat Oncol Biol Phys 32(5):1495–1512PubMedCrossRef
35.
Love C, Tomas MB, Tronco GG, Palestro CJ (2005) FDG PET of infection and inflammation. Radiographics 25(5):1357–1368PubMedCrossRef
36.
Chang JM, Lee HJ, Goo JM, Lee HY, Lee JJ, Chung JK, Im JG (2006) False positive and false negative FDG-PET scans in various thoracic diseases. Korean J Radiol 7(1):57–69PubMedCrossRef
37.
Kwek BH, Aquino SL, Fischman AJ (2004) Fluorodeoxyglucose positron emission tomography and CT after talc pleurodesis. Chest 125(6):2356–2360PubMedCrossRef
38.
Coleman RE, Mashiter G, Whitaker KB, Moss DW, Rubens RD, Fogelman I (1988) Bone scan flare predicts successful systemic therapy for bone metastases. J Nucl Med 29(8):1354–1359PubMed
39.
Krupitskaya Y, Eslamy HK, Nguyen DD, Kumar A, Wakelee HA (2009) Osteoblastic Bone Flare on F18-FDG PET in Non-small Cell Lung Cancer (NSCLC) Patients Receiving Bevacizumab in addition to standard Chemotherapy. J Thorac Oncol 4(3):429–431PubMedCrossRef
40.
Talamo G, Angtuaco E, Walker RC, Dong L, Miceli MH, Zangari M, Tricot G, Barlogie B, Anaissie E (2005) Avascular necrosis of femoral and/or humeral heads in multiple myeloma: results of a prospective study of patients treated with dexamethasone-based regimens and high-dose chemotherapy. J Clin Oncol 23(22):5217–5223PubMedCrossRef
41.
Catalano L, Del Vecchio S, Petruzziello F, Fonti R, Salvatore B, Martorelli C, Califano C, Caparrotti G, Segreto S, Pace L, Rotoli B (2007) Sestamibi and FDG-PET scans to support diagnosis of jaw osteonecrosis. Ann Hematol 86(6):415–423PubMedCrossRef
Oh D, Huh SJ, Lee SJ, Kwon JW (2009) Variation in FDG uptake on PET in patients with radiation-induced pelvic insufficiency fractures: a review of 10 cases. Ann Nucl Med 23(6):511–516PubMedCrossRef
44.
Erasmus JJ, McAdams HP, Patz EF Jr, Coleman RE, Ahuja V, Goodman PC (1998) Evaluation of primary pulmonary carcinoid tumors using FDG PET. AJR Am J Roentgenol 170(5):1369–1373PubMed
45.
Kang DE, White RL Jr, Zuger JH, Sasser HC, Teigland CM (2004) Clinical use of fluorodeoxyglucose F 18 positron emission tomography for detection of renal cell carcinoma. J Urol 171(5):1806–1809PubMedCrossRef
46.
Khan MA, Combs CS, Brunt EM, Lowe VJ, Wolverson MK, Solomon H, Collins BT, Di Bisceglie AM (2000) Positron emission tomography scanning in the evaluation of hepatocellular carcinoma. J Hepatol 32(5):792–797PubMedCrossRef
47.
Berger KL, Nicholson SA, Dehdashti F, Siegel BA (2000) FDG PET evaluation of mucinous neoplasms: correlation of FDG uptake with histopathologic features. AJR Am J Roentgenol 174(4):1005–1008PubMed
48.
Jerusalem G, Beguin Y, Najjar F, Hustinx R, Fassotte MF, Rigo P, Fillet G (2001) Positron emission tomography (PET) with 18 F-fluorodeoxyglucose (18 F-FDG) for the staging of low-grade non-Hodgkin’s lymphoma (NHL). Ann Oncol 12(6):825–830PubMedCrossRef
49.
Tateishi U, Gamez C, Dawood S, Yeung HW, Cristofanilli M, Macapinlac HA (2008) Bone metastases in patients with metastatic breast cancer: morphologic and metabolic monitoring of response to systemic therapy with integrated PET/CT. Radiology 247(1):189–196PubMedCrossRef
50.
Huyge V, Garcia C, Vanderstappen A, Alexiou J, Gil T, Flamen P (2009) Progressive osteoblastic bone metastases in breast cancer negative on FDG-PET. Clin Nucl Med 34(7):417–420PubMedCrossRef
Synthetic Biology: On Advanced Genome Interpretation for Gene Variants and Pathways: What is the Genetic Base of Atherosclerosis and Loss of Arterial Elasticity with Aging
Curator: Aviva Lev-Ari, PhD, RN
Article ID #52: Synthetic Biology: On Advanced Genome Interpretation for Gene Variants and Pathways: What is the Genetic Base of Atherosclerosis and Loss of Arterial Elasticity with Aging. Published on 5/17/2013
WordCloud Image Produced by Adam Tubman
UPDATED on 7/12/2021
Abstract. Synthetic biology is a field of scientific research that applies engineering principles to living organisms and living systems.
Introduction. This article is intended as a perspective on the field of synthetic biology. …
To solve real-world problems using emerging abilities in synthetic biology, research must focus on a few ambitious goals, argues Dan Fletcher, Professor of bioengineering and biophysics, and chair of the Department of Bioengineering at the University of California, Berkeley, USA. He is also a Chan Zuckerberg Biohub Investigator.
Start Quote
Artificial blood cells. Blood transfusions are crucial in treatments for everything from transplant surgery and cardiovascular procedures to car accidents, pregnancy-related complications and childhood malaria (see go.nature.com/2ozbfwt). In the United States alone, 36,000 units of red blood cells and 7,000 units of platelets are needed every day (see go.nature.com/2ycr2wo).
But maintaining an adequate supply of blood from voluntary donors can be challenging, especially in low- and middle-income countries. To complicate matters, blood from donors must be checked extensively to prevent the spread of infectious diseases, and can be kept for only a limited time — 42 days or 5 days for platelets alone. What if blood cells could be assembled from purified or synthesized components on demand?
In principle, cell-like compartments could be made that have the oxygen-carrying capacity of red blood cells or the clotting ability of platelets. The compartments would need to be built with molecules on their surfaces to protect the compartments from the immune system, resembling those on a normal blood cell. Other surface molecules would be needed to detect signals and trigger a response.
In the case of artificial platelets, that signal might be the protein collagen, to which circulating platelets are exposed when a blood vessel ruptures5. Such compartments would also need to be able to release certain molecules, such as factor V or the von Willebrand clotting factor. This could happen by building in a rudimentary form of exocytosis, for example, whereby a membrane-bound sac containing the molecule would be released by fusing with the compartment’s outer membrane.
It is already possible to encapsulate cytoplasmic components from living cells in membrane compartments6,7. Now a major challenge is developing ways to insert desired protein receptors into the lipid membrane8, along with reconstituting receptor signalling.
Red blood cells and platelets are good candidates for the first functionally useful synthetic cellular system because they lack nuclei. Complex functions such as nuclear transport, protein synthesis and protein trafficking wouldn’t have to be replicated. If successful, we might look back with horror on the current practice of bleeding one person to treat another.
Human blood as viewed under a scanning electron microscope.Credit: Dennis Kunkel Microscopy/SPL
Designer immune cells. Immunotherapy is currently offering new hope for people with cancer by shaping how the immune system responds to tumours. Cancer cells often turn off the immune response that would otherwise destroy them. The use of therapeutic antibodies to stop this process has drastically increased survival rates for people with multiple cancers, including those of the skin, blood and lung9. Similarly successful is the technique of adoptive T-cell transfer. In this, a patient’s T cells or those of a donor are engineered to express a receptor that targets a protein (antigen) on the surface of tumour cells, resulting in the T cells killing the cancerous cells (called CAR-T therapies)10. All of this has opened the door to cleverly rewiring the downstream signalling that results in the destruction of tumour cells by white blood cells11.
What if researchers went a step further and tried to create synthetic cells capable of moving towards, binding to and eliminating tumour cells?
In principle, untethered from evolutionary pressures, such cells could be designed to accomplish all sorts of tasks — from killing specific tumour cells and pathogens to removing brain amyloid plaques or cholesterol deposits. If mass production of artificial immune cells were possible, it might even lessen the need to tailor treatments to individuals — cutting costs and increasing accessibility.
To ensure that healthy cells are not targeted for destruction, engineers would also need to design complex signal-processing systems and safeguards. The designer immune cells would need to be capable of detecting and moving towards a chemical signal or tumour. (Reconstituting the complex process of cell motility is itself a major challenge, from the delivery of energy-generating ATP molecules to the assembly of actin and myosin motors that enable movement.)
Researchers have already made cell-like compartments that can change shape12, and have installed signalling circuits within them13. These could eventually be used to control movement and mediate responses to external signals.
Smart delivery vehicles. The relative ease of exposing cells in the lab to drugs, as well as introducing new proteins and engineering genomes, belies how hard it is to deliver molecules to specific locations inside living organisms. One of the biggest challenges in most therapies is getting molecules to the right place in the right cell at the right time.
Harnessing the natural proclivity of viruses to deliver DNA and RNA molecules into cells has been successful14. But virus size limits cargo size, and viruses don’t necessarily infect the cell types researchers and clinicians are aiming at. Antibody-targeted synthetic vesicles have improved the delivery of drugs to some tumours. But getting the drug close to the tumour generally depends on the vesicles leaking from the patient’s circulatory system, so results have been mixed.
Could ‘smart’ delivery vehicles containing therapeutic cargo be designed to sense where they are in the body and move the cargo to where it needs to go, such as across the blood–brain barrier?
This has long been a dream of those in drug delivery. The challenges are similar to those of constructing artificial blood and immune cells: encapsulating defined components in a membrane, incorporating receptors into that membrane, and designing signal-processing systems to control movement and trigger release of the vehicle’s contents.
The development of immune-cell ‘backpacks’ is an exciting step in the right direction. In this, particles containing therapeutic molecules are tethered to immune cells, exploiting the motility and targeting ability of the cells to carry the molecules to particular locations15.
A minimal chassis for expression. In each of the previous examples, the engineered cell-like system could conceivably be built to function over hours or days, without the need for additional protein production and regulation through gene expression. For many other tasks, however, such as the continuous production of insulin in the body, it will be crucial to have the ability to express proteins, upregulate or downregulate certain genes, and carry out functions for longer periods.
Engineering a ‘minimal chassis’ that is capable of sustained gene expression and functional homeostasis would be an invaluable starting point for building synthetic cells that produce proteins, form tissues and remain viable for months to years. This would require detailed understanding and incorporation of metabolic pathways, trafficking systems and nuclear import and export — an admittedly tall order.
It is already possible to synthesize DNA in the lab, whether through chemically reacting bases or using biological enzymes or large-scale assembly in a cell16. But we do not yet know how to ‘boot up’ DNA and turn a synthetic genome into a functional system in the absence of a live cell.
Since the early 2000s, biologists have achieved gene expression in synthetic compartments loaded with cytoplasmic extract17. And genetic circuits of increasing complexity (in which the expression of one protein results in the production or degradation of another) are now the subject of extensive research. Still to be accomplished are: long-lived gene expression, basic protein trafficking and energy production reminiscent of live cells.
372/3:15 Genetic influence on LpPLA2 activity at baseline as evaluated in the exome chip-enriched GWAS study among ~13600 patients with chronic coronary artery disease in the STABILITY (STabilisation of Atherosclerotic plaque By Initiation of darapLadIb TherapY) trial. L. Warren, L. Li, D. Fraser, J. Aponte, A. Yeo, R. Davies, C. Macphee, L. Hegg, L. Tarka, C. Held, R. Stewart, L. Wallentin, H. White, M. Nelson, D. Waterworth.
Genetic influence on LpPLA2 activity at baseline as evaluated in the exome chip-enrichedGWASstudy among ~13600 patients with chronic coronary artery disease in the STABILITY (STabilisation of Atherosclerotic plaque By Initiation of darapLadIb TherapY) trial.
L. Warren1, L. Li1, D. Fraser1, J. Aponte1, A. Yeo2, R. Davies3, C. Macphee3, L. Hegg3,
L. Tarka3, C. Held4, R. Stewart5, L. Wallentin4, H. White5, M. Nelson1, D.
4) Uppsala Clinical Research Center, Department of Medical Sciences, Uppsala University, Uppsala, Sweden;
5) 5Green Lane Cardiovascular Service, Auckland Cty Hospital, Auckland, New Zealand.
STABILITY is an ongoing phase III cardiovascular outcomes study that compares the effects of darapladib enteric coated (EC) tablets, 160 mg versus placebo, when added to the standard of care, on the incidence of major adverse cardiovascular events (MACE) in subjects with chronic coronary heart disease (CHD). Blood samples for determination of the LpPLA2 activity level in plasma and for extraction of DNA was obtained at randomization. To identify genetic variants that may predict response to darapladib, we genotyped ~900K common and low frequency coding variations using Illumina OmniExpress GWAS plus exome chip in advance of study completion. Among the 15828 Intent-to-Treat recruited subjects, 13674 (86%) provided informed consent for genetic analysis. Our pharmacogenetic (PGx) analysis group is comprised of subjects from 39 countries on five continents, including 10139 Whites of European heritage, 1682 Asians of East Asian or Japanese heritage, 414 Asians of Central/South Asian heritage, 268 Blacks, 1027 Hispanics and 144 others. Here we report association analysis of baseline levels of LpPLA2 to support future PGx analysis of drug response post trial completion. Among the 911375 variants genotyped, 213540 (23%) were rare (MAF < 0.5%).
Our analyses were focused on the drug target, LpPLA2 enzyme activity measured at baseline. GWAS analysis of LpPLA2 activity adjusting for age, gender and top 20 principle component scores identified 58 variants surpassing GWAS-significant threshold (5e-08).
Genome-wide stepwise regression analyses identified multiple independent associations from PLA2G7, CELSR2, APOB, KIF6, and APOE, reflecting the dependency of LpPLA2 on LDL-cholesterol levels. Most notably, several low frequency and rare coding variants in PLA2G7 were identified to be strongly associated with LpPLA2 activity. They are V279F (MAF=1.0%, P= 1.7e-108), a previously known association, and four novel associations due to I1317N (MAF=0.05%, P=4.9e-8), Q287X (MAF=0.05%, P=1.6e-7), T278M (MAF=0.02%, P=7.6e-5) and L389S (MAF=0.04%, P=4.3e-4).
All these variants had enzyme activity lowering effects and each appeared to be specific to certain ethnicity. Our comprehensive PGx analyses of baseline data has already provided great insight into common and rare coding genetic variants associated with drug target and related traits and this knowledge will be invaluable in facilitating future PGx investigation of darapladib response.
Entry selected based on indirect or inconclusive evidence linking the gene product to ageing in humans or in one or more model systems
Description
APOC3 is involved in fat metabolism and may delay the catabolism of triglyceride-rich particles. Changes in APOC3 expression levels have been reported in aged mice [1754]. Results from mice suggest that FOXO1 may regulate the expression of APOC3 [1743]. Polymorphisms in the human APOC3 gene and promoter have been associated with lipoprotein profile, cardiovascular health, insulin (INS) sensitivity, and longevity [1756]. Therefore, APOC3 may impact on some age-related diseases, though its exact role in human ageing remains to be determined.
[2125] Pollin et al. (2008) A null mutation in human APOC3 confers a favorable plasma lipid profile and apparent cardioprotection., PubMed
[1756] Atzmon et al. (2006) Lipoprotein genotype and conserved pathway for exceptional longevity in humans, PubMed
[1755] Araki and Goto (2004) Dietary restriction in aged mice can partially restore impaired metabolism of apolipoprotein A-IV and C-III, PubMed
[1743] Altomonte et al. (2004) Foxo1 mediates insulin action on apoC-III and triglyceride metabolism, PubMed
[1754] Araki et al. (2004) Impaired lipid metabolism in aged mice as revealed by fasting-induced expression of apolipoprotein mRNAs in the liver and changes in serum lipids, PubMed
[1753] Panza et al. (2004) Vascular genetic factors and human longevity, PubMed
[1752] Anisimov et al. (2001) Age-associated accumulation of the apolipoprotein C-III gene T-455C polymorphism C
Apolipoprotein C-III is a protein component of very low density lipoprotein (VLDL). APOC3 inhibitslipoprotein lipase and hepatic lipase; it is thought to inhibit hepatic uptake[1] of triglyceride-rich particles. The APOA1, APOC3 and APOA4 genes are closely linked in both rat and human genomes. The A-I and A-IV genes are transcribed from the same strand, while the A-1 and C-III genes are convergently transcribed. An increase in apoC-III levels induces the development of hypertriglyceridemia.
Clinical significance
Two novel susceptibility haplotypes (specifically, P2-S2-X1 and P1-S2-X1) have been discovered in ApoAI-CIII-AIV gene cluster on chromosome 11q23; these confer approximately threefold higher risk ofcoronary heart disease in normal[2] as well as non-insulin diabetes mellitus.[3]Apo-CIII delays the catabolism of triglyceride rich particles. Elevations of Apo-CIII found in genetic variation studies may predispose patients to non-alcoholic fatty liver disease.
^ Singh PP, Singh M, Kaur TP, Grewal SS (2007). “A novel haplotype in ApoAI-CIII-AIV gene region is detrimental to Northwest Indians with coronary heart disease”. Int J Cardiol130 (3): e93–5. doi:10.1016/j.ijcard.2007.07.029. PMID17825930.
^ Singh PP, Singh M, Gaur S, Grewal SS (2007). “The ApoAI-CIII-AIV gene cluster and its relation to lipid levels in type 2 diabetes mellitus and coronary heart disease: determination of a novel susceptible haplotype”. Diab Vasc Dis Res4 (2): 124–29. doi:10.3132/dvdr.2007.030. PMID17654446.
In 2013 we reported on the discovery that there is a
We determined genomewide associations with the presence of aortic-valve calcification (among 6942 participants) and mitral annular calcification (among 3795 participants), as detected by computed tomographic (CT) scanning; the study population for this analysis included persons of white European ancestry from three cohorts participating in the Cohorts for Heart and Aging Research in Genomic Epidemiology consortium (discovery population). Findings were replicated in independent cohorts of persons with either CT-detected valvular calcification or clinical aortic stenosis.
CONCLUSIONS
Genetic variation in the LPA locus, mediated by Lp(a) levels, is associated with aortic-valve calcification across multiple ethnic groups and with incident clinical aortic stenosis. (Funded by the National Heart, Lung, and Blood Institute and others.)
We present below the MARKET LEADER in Interpretation of the Genomics Computations Results in the emerging new ERA of Medicine: Genomic Medicine, Knome.com and its home grown software power house.
A second Case study in the Advanced Genome Interpretation and Individualized Medicine presented following the Market Leader, is the Genome-Phenome Analyzer by SimulConsult,A Simultaneous Consult On Your Patient’s Diagnosis, Chestnut Hill, MA
2012: The Year When Genomic Medicine Started Paying Off
Luke Timmerman
An excerpt of an interesting article mentioning Knome [emphasis ours]…
Remember a couple of years ago when people commemorated the 10-year anniversary of the first draft human genome sequencing? The storyline then, in 200, was that we all went off to genome camp and only came home with a lousy T-shirt. Society, we were told, invested huge scientific resources in deciphering the code of life, and there wasn’t much of a payoff in the form of customized, personalized medicine.
That was an easy conclusion to reach then, when personalized medicine advocates could only point to a couple of effective targeted cancer drugs—Genentech’s Herceptin and Novartis’ Gleevec—and a couple of diagnostics. But that’s changing. My inbox the past week has been full of analyst reports from medical meetings, which mostly alerted readers to mere “incremental” advances with a number of genomic-based medicines and diagnostics. But that’s a matter of focusing on the trees, not the forest. This past year, we witnessed some really impressive progress from the early days of “clinical genomics” or “medical genomics.” The investment in deep understanding of genomics and biology is starting to look visionary.
The movement toward clinical genomics gathered steam back in June at the American Society of Clinical Oncology annual meeting. One of the hidden gem stories from ASCO was about little companies like Cambridge, MA-based Foundation Medicine and Cambridge, MA-based Knome that started seeing a surprising surge in demand from physicians for their services to help turn genomic data into medical information. The New York Times wrote a great story a month later about a young genomics researcher at Washington University in St. Louis who got cancer, had access to incredibly rich information about his tumors, and—after some wrestling with his insurance company—ended up getting a targeted drug nobody would have thought to prescribe without that information. And last month, I checked back on Stanford University researcher Mike Snyder, who made headlines this year using a smorgasbord of “omics” tools to correctly diagnose himself early with Type 2 diabetes, and then monitor his progress back into a healthy state–read the entire article
Knome and Real Time Genomics Ink Deal to Integrate and Sell the RTG Variant Platform on knoSYS™100 System
Partnership to bring accurate and fast genome analysis to translational researchers
CAMBRIDGE, MA – May 6, 2013 – Knome Inc., the genome interpretation company, and Real Time Genomics, Inc., the genome analytics company, today announced that the Real Time Genomics (RTG) Variant platform will be integrated into every shipment of the knoSYS™100 interpretation system. The agreement enables customers to easily purchase the RTG analytics engine as an upgrade to the system. The product will combine two world-class commercial platforms to deliver end-to-end genome analytics and interpretation with superior accuracy and speed. Financial terms of the agreement were not disclosed.
“In the past year demand for genome interpretation has surged as translational researchers and clinicians adopt sequencing for human disease discovery and diagnosis,” said Wolfgang Daum, CEO of Knome. “Concomitant with that demand is the need for accurate and easy-to-use industrial grade analysis that meets expectations of clinical accuracy. The RTG platform is both incredibly fast and truly differentiating to customers doing family studies, and we are excited to add such a powerful platform to the knoSYS ecosystem.”
The partnership simplifies the purchasing process by allowing knoSYS customers to purchase the RTG platform directly from Knome sales representatives.
“The Knome system is a perfect complementary channel to further expand our commercial effort to bring the RTG platform to market,” said Steve Lombardi, CEO of Real Time Genomics. “Knome has built a recognizable brand around human clinical genome interpretation, and by delivering the RTG platform within their system, both companies are simplifying genomics to help customers understand human disease and guide clinical actions.”
About Knome
Knome Inc. (www.knome.com) is a leading provider of human genome interpretation systems and services. We help clients in two dozen countries identify the genetic basis of disease, tumor growth, and drug response. Designed to accelerate and industrialize the process of interpreting whole genomes, Knome’s big data technologies are helping to pave the healthcare industry’s transition to molecular-based, precision medicine.
About Real Time Genomics
Real Time Genomics (www.realtimegenomics.com) has a passion for genomics. The company offers software tools and applications for the extraction of unique value from genomes. Its competency lies in applying the combination of its patented core technology and deep computational expertise in algorithms to solve problems in next generation genomic analysis. Real Time Genomics is a private San Francisco based company backed by investment from Catamount Ventures, Lightspeed Venture Partners, and GeneValue Ltd.
An excerpt of an interesting article mentioning Knome [emphasis ours]:
…Cambridge, Massachusetts–based Knome made one of the splashiest entries into the field, but has now turned entirely to contract research. The company began providing DTC whole-genome sequencing to independently wealthy individuals at a time when the price was still sky high. The company’s first client, Dan Stoicescu, was a former biotech entrepreneur who paid $350,000 to have his genome sequenced in 2008 so he could review it “like a stock portfolio” as new genetic discoveries unfolded4. About a year later, the company was auctioning off a genome, with such frills as a dinner with renowned Harvard genomics researcher George Church, at a starting price of $68,000; at the time, a full-genome sequence came at the price of $99,000, indicating that the cost of genome sequencing has been plummeting steadily.
Now, the company’s model is very different. “We stopped working with the ‘wealthy healthy’ in 2010,” says Jonas Lee, Knome’s chief marketing officer. “The model changed as sequencing changed.” The new emphasis, he says, is now on using Knome’s technology and technical expertise for genome interpretation. Knome’s customers are researchers, pharmaceutical companies and medical institutions, such as Johns Hopkins University School of Medicine in Baltimore, which in January signed the company up to interpret 1,000 genomes for a study of genetic variants underlying asthma in African American and African Caribbean populations.
Knome is trying to advance the clinical use of genomics, working with groups that “want to be prepared for what’s ahead,” Lee says. “We work with at least 50 academic institutions and 20 pharmaceutical companies looking at variants and drug response.” Cancer and idiopathic genetic diseases are the first sweet spots for genomic sequencing, he says. Although cancer genomics has been hot for a while, a recent string of discoveries of Mendelian diseases5 made by whole-genome sequencing has lit up that field, too. Lee is also confident, however, that “chronic diseases like heart disease are right behind those.” The company also provides software tools. The price for its KnomeDiscovery sequencing and analysis service starts at about $12,000 per sample–read the entire article here.
DNA decoder: Knome’s software can tease out medically relevant changes in DNA that could disrupt individual gene function or even a whole molecular pathway, as is highlighted here—certain mutations in the BRCA2 gene, which affects the function of many other genes, can be associated with an increased risk of breast cancer.
A genome analysis company called Knome is introducing software that could help doctors and other medical professionals identify genetic variations within a patient’s genome that are linked to diseases or drug response. This new product, available for now only to select medical institutions, is a patient-focused spin on Knome’s existing products aimed at researchers and pharmaceutical companies. The Knome software turns a patient’s raw genome sequence into a medically relevant report on disease risks and drug metabolism. The software can be run within a clinic’s own network—rather than in the cloud, as is the case with some genome-interpretation services—which keeps the information private.
Advances in DNA sequencing technology have sharply reduced the amount of time and money required to identify all three billion base pairs of DNA in a person’s genome. But the use of genomic information for medical decisions is still limited because the process creates such large volumes of data. Less than five years ago, Knome, based in Cambridge, Massachusetts, made headlines by offering what seemed then like a low price—$350,000—for a genome sequencing and profiling package. The same service now costs just a few thousand dollars.
Today, genome profiling has two main uses in the clinic. It’s part of the search for the cause of rare genetic diseases, and it generates tumor-specific profiles to help doctors discover the weaknesses of a patient’s particular cancer. But within a few years, the technique could move beyond rare diseases and cancer. The information gleaned from a patient’s genome could explain the origin of specific disease, could help save costs by allowing doctors to pretreat future diseases, or could improve the effectiveness and safety of medications by allowing doctors to prescribe drugs that are tuned to a person’s ability to metabolize drugs.
But teasing out the relevant genetic information from a patient’s genome is not trivial. To find the particular genetic variant that causes a specific disease or drug response can require expertise from many disciplines—from genetics to statistics to software engineering—and a lot of time. In any given patient’s genome, millions of places in that genome will differ from the standard of reference. The vast majority of these differences, or variants, will be unrelated to a patient’s medical condition, but determining that can take between 20 minutes and two hours for each variant, says Heidi Rehm, a clinical geneticist who directs the Laboratory for Molecular Medicine at Partners Healthcare Center for Personalized Genetic Medicine in Boston, and who will soon serve on the clinical advisory board of Knome. “If you scale that to … millions of variants, it becomes impossible.”
A software package like Knome’s can help whittle down the list based on factors such as disease type, the pattern of inheritance in a family, and the effects of given mutations on genes. Other companies have introduced Web- or cloud-based services to perform such an analysis, but Knome’s software suite can operate within a hospital’s network, which is critically important for privacy-concerned hospitals.
The greatest benefit of the widespread adoption of genomics in the clinic will come from the “clinical intelligence” doctors gain from networks of patient data, says Martin Tolar, CEO of Knome. Information about the association between certain genetic variants and disease or drug response could be anonymized—that is, no specific patient could be tied to the data—and shared among large hospital networks. Knome’s software will make it easy to share that kind of information, says Tolar.
“In the future, you could be in the situation where your physician will be able to pull the most appropriate information for your specific case that actually leads to recommendations about drugs and so forth,” he says.
The knoSYS™100 seamlessly integrates an interpretation application (knoSOFT) and informatics engine (kGAP) with a high-performance grid computer. Designed for whole genome, exome, and targeted NGS data, the knoSYS™100 helps labs quickly go “from reads to reports.”
Advanced Interpretation and Reporting Software
The knoSYS™100 ships with knoSOFT, an advanced application for managing sequence data through the informatics pipeline, filtering variants, running gene panels, classifying/interpreting variants, and reporting results.
knoSOFT has powerful and scalable multi-sample comparison features–capable of performing family studies, tumor/normal studies, and large case-control comparisons of hundreds of whole genomes.
Multiple simultaneous users (10) are supported, including technicians running sequence data through informatics pipeline, developers creating next-generation gene panels, geneticists researching causal variants, and production staff processing gene panels.
Co-authored by Dr. David Goldstein, Clinical and Scientific board member for Knome
Author summary: Genetic association studies analyze both phenotypes (such as disease status) and genotypes (at sites of DNA variation) of a given set of individuals. … more
Co-authored by Dr. George Church and Dr. Heidi Rehm, Clinical and Scientific Board Members for Knome
Author summary: An individual’s genetic profile plays an important role in determining risk for disease and response to medical therapy. The development of technologies that facilitate rapid whole-genome sequencing will provide unprecedented power in the estimation of disease risk. Here we develop methods to characterize genetic determinants of disease risk and … more
Co-authored by Dr. David Goldstein, Clinical and Scientific board member for Knome
Author summary: Schizophrenia is a highly heritable disease. While the drugs commonly used to treat schizophrenia offer important relief from some symptoms, other symptoms are not well treated, and the drugs cause serious adverse effects in many individuals. This has fueled intense interest over the years in identifying genetic contributors to … more
Co-authored by Dr. David Goldstein, Clinical and Scientific board member for Knome
Author summary: Metachondromatosis (MC) is an autosomal dominant condition characterized by exostoses (osteochondromas), commonly of the hands and feet, and enchondromas of long bone metaphyses and iliac crests. MC exostoses may regress or even resolve over time, and short stature … more
Introduction: There is an increasing consensus that whole-exome sequencing (WES) and whole-genome sequencing (WGS) will continue to improve in accuracy and decline in price and that the use of these technologies will eventually become an integral part of clinical medicine.1–7 … more
Publications by industry experts and thought-leaders
Augustine Kong, Michael L. Frigge, Gisli Masson, Soren Besenbacher, Patrick Sulem, Gisli Magnusson, Sigurjon A. Gudjonsson, Asgeir Sigurdsson, Aslaug Jonasdottir, Adalbjorg Jonasdottir, Wendy S. W. Wong, Gunnar Sigurdsson, G. Bragi Walters, Stacy Steinberg, Hannes Helgason, Gudmar Thorleifsson, Daniel F. Gudbjartsson, Agnar Helgason, Olafur Th. Magnusson, Unnur Thorsteinsdottir, & Kari Stefansson
Abstract: Mutations generate sequence diversity and provide a substrate for selection. The rate of de novo mutations is therefore of major importance to evolution. Here we conduct a study of genome-wide mutation rates by sequencing the entire genomes of 78 … more
Florian L. Muller, Simona Colla, Elisa Aquilanti, Veronica E. Manzo, Giannicola Genovese, Jaclyn Lee, Daniel Eisenson, Rujuta Narurkar, Pingna Deng, Luigi Nezi, Michelle A. Lee, Baoli Hu, Jian Hu, Ergun Sahin, Derrick Ong, Eliot Fletcher-Sananikone, Dennis Ho, Lawrence Kwong, Cameron Brennan, Y. Alan Wang, Lynda Chin, & Ronald A. DePinho
Abstract: Inactivation of tumour-suppressor genes by homozygous deletion is a prototypic event in the cancer genome, yet such deletions often encompass neighbouring genes. We propose that homozygous deletions in such passenger genes can expose cancer-specific therapeutic vulnerabilities when the collaterally … more
Karyn Meltz Steinberg, Francesca Antonacci, Peter H Sudmant, Jeffrey M Kidd, Catarina D Campbell, Laura Vives, Maika Malig, Laura Scheinfeldt, William Beggs, Muntaser Ibrahim, Godfrey Lema, Thomas B Nyambo, Sabah A Omar, Jean-Marie Bodo, Alain Froment, Michael P Donnelly, Kenneth K Kidd, Sarah A Tishkoff, & Evan E Eichler
Abstract: The 17q21.31 inversion polymorphism exists either as direct (H1) or inverted (H2) haplotypes with differential predispositions to disease and selection. We investigated its genetic diversity in 2,700 individuals, with an emphasis on African populations. We characterize eight structural haplotypes … more
Two networks: 40-Gigabit Infiniband QDR via a Mellanox Switch for storage traffic and HP ProCurve switch for network traffic
High performance computing cluster
Four nodes, each node with two 8-core/16 thread, 2.4Ghz, 64 bit Intel® Xeon® E5-2660 processor with 20MB cache, 128GB of DDR3 ECC 1600 memory; 2x2TB SATA drives (7,200RPM)
Metadata server
2x2TB 3.5″ drives with 6GB/sec SATA, RAID 1 and 2x300GB SSD (RAID 1)
Object storage server
Lustre array: Two 12x4TB arrays of 12 3.5″ drives with 6GB/sec serial SATA channels, each OSS powered by a 6-core Intel Xeon 64-bit processor running at 20GHz with 32GB RAM.
Our research services group uses a set of advanced software tools designed for whole genome and exome interpretation. These tools are also available to our clients through our knomeBASE informatics service. In addition to various scripts, libraries, and conversion utilities, these tools include knomeVARIANTS and knomePATHWAYS.
knomeVARIANTS
knome VARIANTS is a query kit that lets users search for candidate causal variants in studied genomes. It includes a query interface (see above), scripting libraries, and data conversion utilities.
Users select cases and controls, input a putative inheritance mode, and add sensible filter criteria (variant functional class, rarity/novelty, location in prior candidate regions, etc.) to automatically generate a sorted short-list of leading candidates. The application includes a SQL query interface to let users query the database as they wish, including by complex or novel sets of criteria.
In addition to querying, the application lets users export subsets of the database for viewing in MS Excel. Subsets can be output that target common research foci, including the following:
Sites implicated in phenotypes, regardless of subject genotypes
Sites where at least one studied genome mismatches the reference
Sites where a particular set of one or more genomes, but no other genomes, show a novel variant
Sites in phenotype-implicated genes
Sites with nonsense, frameshift, splice-site, or read-through variants, relative to reference
Sites where some but not all subject genome were called
knomePATHWAYS
knomePATHWAYS is a visualization tool that overlays variants found in each sample genome onto known gene interaction networks in order to help spot functional interactions between variants in distinct genes, and pathways enriched for variants in cases versus controls, differential drug responder groups, etc.
knomePATHWAYS integrates reference data from many sources, including GO, HPRD, and MsigDB (which includes KEGG and Reactome data). The application is particularly helpful in addressing higher-order questions, such as finding candidate genes and protein pathways, that are not readily addressed from tabular annotation data alone.
A Simultaneous Consult On Your Patient’s Diagnosis
Clinicians can get a “simultaneous consult” about their patient’s diagnosis using SimulConsult’s diagnostic decision support software.
Using the free “phenome” version, medical professionals can enter patient findings into the software and get an initial differential diagnosis and suggestions about other useful findings, including tests. The database used by the software has > 4,000 diagnoses, most complete for genetics and neurology. It includes all genes in GeneTests and all diseases in GeneReviews. The information about diseases is entered by clinicians, referenced to the literature and peer-reviewed by experts. The software takes into account pertinent negatives, temporal information, and cost of tests, information ignored in other diagnostic approaches. It transforms medical diagnosis by lowering costs, reducing errors and eliminating the medical diagnostic odysseys experienced by far too many patients and their families.
Using the “genome-phenome analyzer” version, a lab can combine a genome variant table with the phenotypic data entered by the referring clinician, thereby using the full power of genome + phenome to arrive at a diagnosis in seconds. An innovative measure of pertinence of genes focuses attention on the genes accounting for the clinical picture, even if more than one gene is involved. The referring clinician can use the results in the free phenome version of the software, for example adding information from confirmatory tests or adding new findings that develop over time. For details, click here.
Michael M. Segal MD, PhD, Founder,Chairman and Chief Scientist. Dr. Segal did his undergraduate work at Harvard and his MD and PhD at Columbia, where his thesis project outlined rules for the types of chemical synapses that will form in a nervous system. After his residency in pediatric neurology at Columbia, he moved to Harvard Medical School, where he joined the faculty and developed the microisland system for studying small numbers of brain neurons in culture. Using this system, he developed a simplified model of epilepsy, work that won him national and international young investigator awards, and set the stage for later work on the molecular mechanism of attention deficit disorder. Dr. Segal has a long history of interest in computers, and patterned the SimulConsult software after the way that experienced clinicians actually think about diagnosis. He is on the Electronic Communication Committee of the Child Neurology Society and the Scientific Program Committee of the American Medical Informatics Association.
A Blood Test to Identify Aggressive Prostate Cancer: a Discovery @ SRI International, Menlo Park, CA
Reporter: Aviva Lev-Ari, PhD, RN
Article ID #51: A Blood Test to Identify Aggressive Prostate Cancer: a Discovery @ SRI International, Menlo Park, CA. Published on 5/16/2013
WordCloud Image Produced by Adam TubmanArticle 9.3.A Blood Test to Identify Aggressive Prostate Cancer: a Discovery @ SRI International, Menlo Park, CA
Distinguished Scientist and Senior Program Director, Tumor Glycomics Laboratory, Center for Cancer and Metabolism
Denong Wang, Ph.D., is an SRI distinguished scientist and senior program director of the Tumor Glycome Laboratoryin the Center for Cancer and Metabolism in SRI Biosciences. Wang’s long-term research interest is in the carbohydrate moieties that are critical for self/non-self recognition and induction of antibody responses.
Wang’s team has established multiple platforms of carbohydrate microarrays and introduced these glycomics tools to explore the structural and antigenic diversities of the glycome. The main research focus of his lab is in the immunogenic sugar moieties. In the past few years, his group has contributed to the identification of immunologically potent glycan markers of SARS-CoV, Bacillus anthracis exosporium, and a number of human cancers.
Wang received his Ph.D. in immunology and glycobiology with the late Professor Elvin A. Kabat at Columbia University in 1993. After that, he entered the developing field of post-genomics research. Before joining SRI in 2010, he served as head of the Functional Genomics Division at Columbia University’s Genome Center from 1998 to 2003 and was director of Stanford University’s Tumor Glycome Laboratory from 2007 to 2010.
Prostate cancer is the second most common cancer in American men, killing nearly 30,000 per year. In 2004, I attended a conference where one of the nation’s leading researchers in the field declared that the gold-standard test for this disease was not successful at identifying dangerous invasive tumors. That triggered my interest in how to address the challenge of developing a blood test to detect the deadly form of prostate cancer.
After nearly a decade, my collaborators and I have found the first marker that specifically identifies the approximately six to eight percent of prostate cancers that are considered “aggressive,” meaning they will migrate to other parts of the body, at which point they are very difficult to treat. Although we have confirmed this marker, there is much to be done before a clinical application can be developed.
If further study confirms that the test is clinically reliable, it can provide a much-needed tool to differentiate between aggressive cancer and the majority of cases, which are slow-growing tumors with a low probability of migrating to other parts of the body (and thus don’t require special treatment, such as radical prostatectomy).
The current standard test looks at elevated blood prostate-specific antigen (PSA) levels, known as the PSA test. Dr. Thomas Stamey, an emeritus faculty member and urologist at the Stanford University School of Medicine, published his original findings in 1987 linking elevated blood PSA levels to prostate cancer. In 2004, Dr. Stamey declared that the PSA test was no longer useful for the diagnosis of prostate cancer. Rather, an elevated PSA level is now known to reflect the volume increase of a prostate, which could either be associated with a harmless increase in prostate size called benign prostatic hyperplasia (BPH), or be caused by cancer.
I began collaborating with Dr. Stamey and his Stanford colleague Dr. Donna Peehl to look for a new prostate cancer marker, hopefully one that would indicate the presence of aggressive prostate cancer through a blood test. This is a very active area of research, with scientists exploring the idea from (1) a genomics perspective, (2) a proteomics perspective, and (3) a glycomics perspective, the latter of which entails using carbohydrate-based markers to identify cancer.My focus is the third area, where we are concentrating on how the immune system recognizes changes in the carbohydrates found on the surface of cancer cells compared with those on the surface of normal cells.
SRI’s Tumor Glycome Laboratory has discovered a marker that appears to be associated with aggressive prostate cancer. The marker is an antibody that is produced against a carbohydrate molecule on the surface of aggressive prostate cancer cells, and is expressed in increasing levels that correlate with cancer severity. We call it a “cryptic” biomarker, since it only becomes an immunological target if something goes awry in the cell, such as a viral infection or the malignant transformation of normal cells to cancer.
This biomarker has the potential, with further development, to be used as a test to help diagnose aggressive prostate cancer. It is rewarding to have reached this point in our understanding of prostate cancer and toward a diagnostic test that ultimately could save lives.
Our research findings were published last year in the Journal of Proteomics & Bioinformatics (5:090-095, DOI:10.4172/jpb.1000218). Our latest study, published in Drug Development Research, lays the foundation for predicting which prostate cancer patients may develop more aggressive forms of the disease and directs the future design of more effective treatments [14(2):65-80, DOI: 10.1002/ddr.21063].
Anti‐Oligomannose Antibodies as Potential Serum Biomarkers of Aggressive Prostate Cancer
Abstract
This study bridges a carbohydrate microarray discovery and a large‐scale serological validation of anti‐oligomannose antibodies as novel serum biomarkers of aggressive prostate cancer (PCa). Experimentally, a Man9‐cluster‐specific enzyme‐linked immunosorbent assay was established to enable sensitive detection of anti‐Man9 antibodies in human sera. A large‐cohort of men with PCa or benign prostatic hyperplasia (BPH) whose sera were banked at Stanford University was characterized using this assay. Subjects included patients with 100% Gleason grade 3 cancer (n = 84), with Gleason grades 4 and/or 5 cancer (n = 204), and BPH controls (n = 135). Radical prostatectomy Gleason grades and biochemical (PSA) recurrence served as key parameters for serum biomarker evaluation. It was found that IgGMan9 and IgMMan9 were widely present in the sera of men with BPH, as well as those with cancer. However, these antibody reactivities were significantly increased in the subjects with the largest volumes of high grade cancer. Detection of serum IgGMan9 and IgMMan9 significantly predicted the clinical outcome of PCa post‐radical prostatectomy. Given these results, we suggest that IgGMan9 and IgMMan9 are novel serum biomarkers for monitoring aggressive progression of PCa. The potential of oligomannosyl antigens as targets for PCa subtyping and targeted immunotherapy is yet to be explored.
Authors:
Denong Wang, Laila Dafik, Rosalie Nolley, Wei Huang, Russell D. Wolfinger, Lai‐Xi Wang, Donna M. Peehl
Although tumor-associated abnormal glycosylation has been recognized for decades, information regarding host recognition of the evolving tumor glycome remains elusive. We report here a carbohydrate microarray analysis of a number of tumor-associated carbohydrates for their serum antibody reactivities and potential immunogenicity in humans. These are the precursors, cores and internal sequences of N-glycans. They are usually masked by other sugar moieties and belong to a class of glyco-antigens that are normally “cryptic”. However, viral expression of these carbohydrates may trigger host immune responses. For examples, HIV-1 and SARS-CoV display Man9 clusters and tri- or multi-antennary type II (Galβ1→4GlcNAc) chains (Tri/m-II), respectively; viral neutralizing antibodies often target these sugar moieties. We asked, therefore, whether prostate tumor expression of corresponding carbohydrates triggers antibody responses in vivo. Using carbohydrate microarrays, we analyzed a panel of human sera, including 17 samples from prostate cancer patients and 12 from men with Benign Prostatic Hyperplasia (BPH).
We observed that IgG antibodies targeting the Man9- or Tri-/m-II-autoantigens are readily detectable in the sera of men with BPH, as well as those with cancer. Importantly, these antibody activities were selectively increased in prostate cancer patients. Thus, human immune systems actively recognize these N-glycan cryptic carbohydrates and produce targeting antibodies. This finding shads a light on a class of previously less studied immunological targets of human cancers. Identifying the diagnostic, prognostic and therapeutic values of these targets will require further investigation.


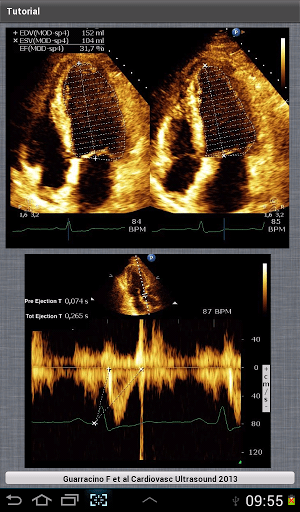


 日本語: トロポニン(SVG修正版)")


 DNA decoder: Knome’s software can tease out medically relevant changes in DNA that could disrupt individual gene function or even a whole molecular pathway, as is highlighted here—certain mutations in the BRCA2 gene, which affects the function of many other genes, can be associated with an increased risk of breast cancer.


 Prostate cancer is the second most common cancer in American men, killing nearly 30,000 per year. In 2004, I attended a conference where one of the nation’s leading researchers in the field declared that the gold-standard test for this disease was not successful at identifying dangerous invasive tumors. That triggered my interest in how to address the challenge of developing a blood test to detect the deadly form of prostate cancer.
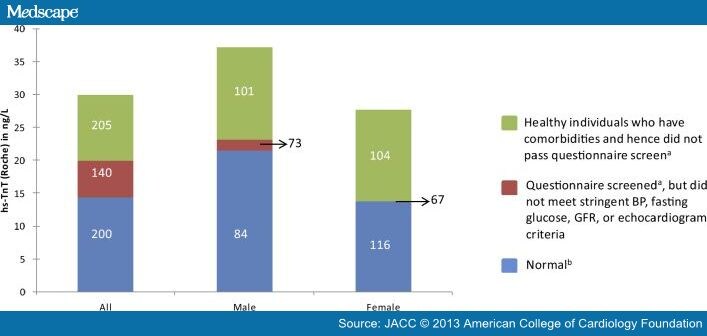
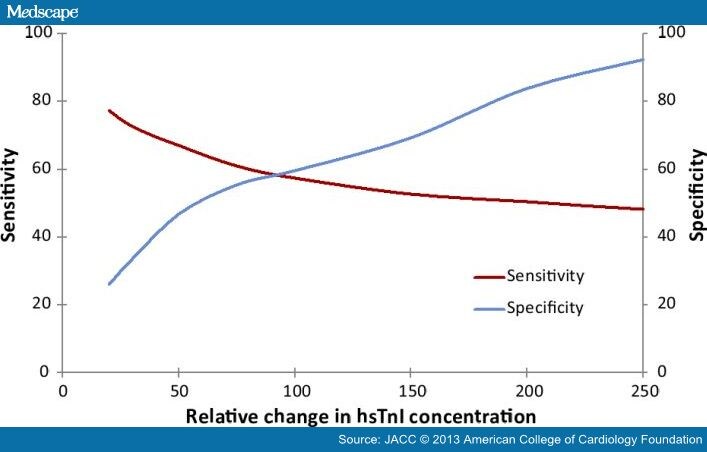