Feeds:
Posts
Comments

Archive for the ‘Curation’ Category

There are three calcium-channel blocking drugs available, but only verapamil possesses significant clinical antiarrhythmic effects. Since the drug affects

Sourced through Scoop.it from: my-medstore-canada.net

See on Scoop.itCardiovascular Disease: PHARMACO-THERAPY

Read Full Post »

Ngai-Yin Chan-The Practice of Catheter Cryoablation for Cardiac Arrhythmias[PDF] 20 MB PDF… https://t.co/8EYkq36tJA

Sourced through Scoop.it from: www.medbooksvn.info

See on Scoop.itCardiovascular Disease: PHARMACO-THERAPY

Read Full Post »

Ischemia, Infarction, and the Waveforms Q through U, Part 1: How to Read an EKG Curriculum

Reporter: Aviva Lev-Ari, PhD, RN


Watch Video

https://www.youtube.com/v/Ajfk21k3Zmo?fs=1&hl=fr_FR

ECG Interpretation: Ischemia, Infarction, and the Waveforms Q through U, Part 1 Girish L. Kalra, MD Assistant Professor, Department of Medicine, Emory Univer…

Sourced through Scoop.it from: www.youtube.com

See on Scoop.itCardiovascular and vascular imaging

Read Full Post »

Breast Cancer Extratumor Microenvironment has Effect on Progression

Larry H. Bernstein, MD, FCAP, Curator

LPBI


Tumor Microenvironment Diversity Predicts Breast Cancer Outcomes

GEN News Highlights   Feb 17, 2016   http://www.genengnews.com/gen-news-highlights/tumor-microenvironment-diversity-predicts-breast-cancer-outcomes/81252378/


Intratumor heterogeneity, it is known, can complicate cancer treatments. Now it appears the same may be true of tumor microenvironment heterogeneity. According to a new study from the Institute of Cancer Research (ICR), London, breast cancers that develop within an “ecologically diverse” breast cancer microenvironment are particularly likely to progress and lead to death.

The study took an unusual approach: It combined ecological scoring methods with genome-wide profiling data. This approach, besides showing clinical utility in the evaluation of breast cancer outcomes, demonstrated that even so contextual a discipline as genomics can benefit from being placed within a larger context. In this case, the context is essentially Darwinian, albeit at a small scale.

Natural selection is typically studied at the level of ecosystems consisting of animals and plants. In the current study, however, it was assessed at the level of the tumor microenvironment, which consists of cancer cells, immune system lymphocytes, and stromal cells.

The ICR scientists, led by Yinyin Yuan, Ph.D., presented their work February 16 in the journal PLoS Medicine, in an article entitled “Microenvironmental Heterogeneity Parallels Breast Cancer Progression: A Histology–Genomic Integration Analysis.” The article describes how the scientists developed a tumor ecosystem diversity index (EDI), a scoring system that indicates the degree of microenvironmental heterogeneity along three spatial dimensions in solid tumors. EDI scores take account of “fully automated histology image analysis coupled with statistical measures commonly used in ecology.”

“[EDI] was compared with disease-specific survival, key mutations, genome-wide copy number, and expression profiling data in a retrospective study of 510 breast cancer patients as a test set and 516 breast cancer patients as an independent validation set,” wrote the authors. “In high-grade (grade 3) breast cancers, we uncovered a striking link between high microenvironmental heterogeneity measured by EDI and a poor prognosis that cannot be explained by tumor size, genomics, or any other data types.”

By using the EDI, the ICR team was able to identify several particularly aggressive subgroups of breast cancer. In fact, the EDI was a stronger predictor of survival than many established markers for the disease.

The ICR researchers also looked at the EDI in addition to genetic factors. For example, the researchers found that the prognostic value of EDI was enhanced with the addition of TP53 mutation status. By integrating EDI data and genome-wide profiling data, the researchers identified losses of specific genes on 4p14 and 5q13 that were enriched in grade 3 tumors. These tumors, which showed high microenvironmental diversity, substratified patients into poor prognostic groups.

“Our findings show that mathematical models of ecological diversity can spot more aggressive cancers,” said Dr. Yuan. “By analyzing images of the environment around a tumor based on Darwinian natural selection principles, we can predict survival in some breast cancer types even more effectively than many of the measures used now in the clinic.

“In the future, we hope that by combining cell diversity scores with other factors that influence cancer survival, such as genetics and tumor size, we will be able to tell apart patients with more or less aggressive disease so we can identify those who might need different types of treatment.”

“This ingenious study…teaches us a valuable lesson,” added Paul Workman, Ph.D., chief executive of the ICR. “[We] should always remember that cancer cells are not developing and growing in isolation, but are part of a complex ecosystem that involves normal human cells, too. By better understanding these ecosystems, we aim to create new ways to diagnose, monitor and treat cancer.”


Microenvironmental Heterogeneity Parallels Breast Cancer Progression: A Histology–Genomic Integration Analysis


Background

The intra-tumor diversity of cancer cells is under intense investigation; however, little is known about the heterogeneity of the tumor microenvironment that is key to cancer progression and evolution. We aimed to assess the degree of microenvironmental heterogeneity in breast cancer and correlate this with genomic and clinical parameters.

Methods and Findings

We developed a quantitative measure of microenvironmental heterogeneity along three spatial dimensions (3-D) in solid tumors, termed the tumor ecosystem diversity index (EDI), using fully automated histology image analysis coupled with statistical measures commonly used in ecology. This measure was compared with disease-specific survival, key mutations, genome-wide copy number, and expression profiling data in a retrospective study of 510 breast cancer patients as a test set and 516 breast cancer patients as an independent validation set. In high-grade (grade 3) breast cancers, we uncovered a striking link between high microenvironmental heterogeneity measured by EDI and a poor prognosis that cannot be explained by tumor size, genomics, or any other data types. However, this association was not observed in low-grade (grade 1 and 2) breast cancers. The prognostic value of EDI was superior to known prognostic factors and was enhanced with the addition of TP53 mutation status (multivariate analysis test set, p = 9 × 10⁻⁴, hazard ratio = 1.47, 95% CI 1.17–1.84; validation set, p = 0.0011, hazard ratio = 1.78, 95% CI 1.26–2.52). Integration with genome-wide profiling data identified losses of specific genes on 4p14 and 5q13 that were enriched in grade 3 tumors with high microenvironmental diversity that also substratified patients into poor prognostic groups. Limitations of this study include the number of cell types included in the model, that EDI has prognostic value only in grade 3 tumors, and that our spatial heterogeneity measure was dependent on spatial scale and tumor size.

Conclusions

To our knowledge, this is the first study to couple unbiased measures of microenvironmental heterogeneity with genomic alterations to predict breast cancer clinical outcome. We propose a clinically relevant role of microenvironmental heterogeneity for advanced breast tumors, and highlight that ecological statistics can be translated into medical advances for identifying a new type of biomarker and, furthermore, for understanding the synergistic interplay of microenvironmental heterogeneity with genomic alterations in cancer cells.

Background

The human body contains millions of cells, all of which grow, divide, and die in an orderly fashion to build tissues during early life and to replace worn-out or dying cells and repair injuries during adult life. Sometimes, however, normal cells acquire genetic changes (mutations) that allow them to divide uncontrollably and to move around the body (metastasize), resulting in cancer. Because any cell in the body can acquire the mutations needed for cancer development, there are many types of cancer. For example, breast cancer, the most common cancer in women, begins when the cells in the breast that normally make milk become altered. Moreover, different types of cancer progress and evolve differently—some cancers grow quickly and kill their “host” soon after diagnosis, whereas others can be successfully treated with drugs, surgery, or radiotherapy. The behavior of individual cancers depends both on the characteristics of the cancer cells within the tumor and on the interactions between the cancer cells and the normal stromal cells (the connective tissue cells of organs) and other cells (for example, immune cells) that surround and feed cancer cells (the tumor microenvironment).

Why Was This Study Done?

Although recent studies have highlighted the importance of the tumor microenvironment for disease-related outcomes, little is known about how the heterogeneity of the tumor microenvironment—the diversity of non-cancer cells within the tumor—affects outcomes. Mathematical modeling suggests that tumors with heterogeneous and homogeneous microenvironments have different growth patterns and that heterogeneous microenvironments are more likely to be associated with aggressive cancers than homogenous microenvironments. However, the lack of methods to quantify the spatial variability and cellular composition across solid tumors has prevented confirmation of these predictions. Here, the researchers develop a computational system for quantifying microenvironmental heterogeneity in breast cancer based on tumor morphology (shape and form) in histological sections (tissue samples taken from tumors that are examined microscopically). They then use this system to analyze the associations between clinical outcomes, molecular changes, and microenvironmental heterogeneity in breast cancer.

What Did the Researchers Do and Find?

The researchers used automated image analysis and statistical analysis to develop the ecosystem diversity index (EDI), a numerical measure of microenvironmental heterogeneity in solid tumors. They compared the EDI with prognosis (likely outcome), key mutations, genome-wide copy number (tumor cells often contain abnormal numbers of copies of specific genes), and expression profiling data (the expression of several key proteins is altered in tumors) in a test set of 510 samples from patients with breast cancer and in a validation set of 516 additional samples. Among high-grade breast cancers (grade 3 cancers; the grade of a cancer indicates what the cells look like; high-grade breast cancers have a poor prognosis), but not among low-grade breast cancers (grades 1 and 2), a high EDI (high microenvironmental heterogeneity) was associated with a poor prognosis. Specifically, patients with grade 3 tumors and a high EDI had a ten-year disease-specific survival rate of 51%, whereas the remaining patients with grade 3 tumors had a ten-year survival rate of 70%. Notably, the combination of a high EDI with specific DNA alterations—mutations in a gene called TP53 and loss of genes on Chromosomes 4p14 and 5q13—improved the accuracy of prognosis among patients with grade 3 breast cancer and stratified them into subgroups with disease-specific five-year survival rates of 35%, 9%, and 32%, respectively.

What Do These Findings Mean?

These findings establish a method for measuring the spatial heterogeneity of the microenvironment of solid tumors and suggest that the measurement of tumor microenvironmental heterogeneity can be coupled with information about genomic alterations to provide an accurate way to predict outcomes among patients with high-grade breast cancer. The association between EDI, specific genomic alterations, and outcomes needs to be confirmed in additional patients. However, these findings suggest that microenvironmental heterogeneity might provide an additional biomarker to help clinicians identify those patients with advanced breast cancer who have a particularly bad prognosis. The ability to identify these patients is important because it will help clinicians target aggressive treatments to individuals with a poor prognosis and avoid the overtreatment of patients whose prognosis is more favorable. Finally, and more generally, these findings describe a new way to investigate the interactions between the tumor microenvironment and genomic alterations in cancer cells.

Additional Information

This list of resources contains links that can be accessed when viewing the PDF on a device or via the online version of the article at http://dx.doi.org/10.1371/journal.pmed.1001961.

Citation: Natrajan R, Sailem H, Mardakheh FK, Arias Garcia M, Tape CJ, Dowsett M, et al. (2016) Microenvironmental Heterogeneity Parallels Breast Cancer Progression: A Histology–Genomic Integration Analysis.
PLoS Med 13(2): e1001961.     http://dx.doi.org:/10.1371/journal.pmed.1001961
Fig 1. In silico tumor dissection pipeline for quantifying spatial diversity in the tumor ecosystem.
Fig 1. In silico tumor dissection pipeline for quantifying spatial diversity in the tumor ecosystem. (A) Flow diagram depicting the overall study design. (B) Schematic of our pipeline for quantifying spatial diversity in pathological samples. H&E sections are morphologically classified and divided into regions to be spatially scored. The number of clusters k in the regional scores is indicative of the number of sub-populations of cell types in the tumor regions. (C) Examples of tumor regions with low and high diversity scores using the Shannon diversity index, accounting for cancer cells (outlined in green), lymphocytes (blue), and stromal cells (red). Cell classification is automated by image analysis. (D) The 3-D landscape of cell diversity scores on an example H&E section; the x- and y-axes are the geometric axes of the image, and the z-axis is cell diversity computed on a region-by-region basis. (E) The distribution of regional scores in a tumor from the METABRIC study with two regional clusters identified using Gaussian mixture clustering (grey shading: histogram; dashed black line: density; solid black lines: mixture components/clusters).
Fig 2. Application of EDI to 1,026 breast tumors from the METABRIC study.
Fig 2. Application of EDI to 1,026 breast tumors from the METABRIC study. (A) The frequencies of EDI scores in breast tumors. (B) H&E staining, distribution of classified cells (green: cancer; blue: lymphocyte; red: stromal cells), and the heatmap of regional diversity scores for a tumor with the highest EDI score (EDI = 5). (C) Representative regions from each of the clusters k1–k5 are shown in a tumor with EDI = 5, with cluster k1 having the lowest diversity score and k5 the highest. By mapping regional clusters to the H&E image, we can begin to interpret these clusters with different cell diversity. We observed predominantly cancer cells in k1, increasingly more stromal cells and ductal in situ carcinoma cells (DCIS) in k2, and a vessel in k3. Cluster k4 features extensive stromal lymphocytes between ductal in situ carcinoma components, while k5 shows tumor-infiltrating lymphocytes (TIL) associated with invasive carcinoma cells.
Fig 3. Reproducibility, stability, and independence of the EDI-high group in 507 grade 3 breast tumors.
Fig 3. Reproducibility, stability, and independence of the EDI-high group in 507 grade 3 breast tumors. (A) Kaplan–Meier curves of disease-specific survival to illustrate the prognosis of EDI-high samples compared to other grade 3 samples in two independent patient cohorts. Shown below the graph are the number of patients (the number of disease-specific events) per group for EDI-low (grey) and EDI-high (red). (B) Agreement of the EDI subtyping between 100% data and resampling with progressively fewer tumor regions in 200 repeats. (C) Distribution of known subtypes in grade 3 tumors stratified by EDI; asterisks mark subtypes enriched in the EDI-high group. (D) Kaplan–Meier curves illustrating the duration of disease-specific survival according to tumor size (left) and improvement of stratification with the addition of EDI information (right).
Accumulating evidence suggests that the interactions of cancer cells and stromal cells within their microenvironment govern disease progression, metastasis, and, ultimately, the evolution of therapeutic resistance [1–3]. Recent reports have highlighted the significance of the contribution of stromal gene expression and morphological structure as powerful prognostic determinants for a number of tumor types, emphasizing the importance of the tumor microenvironment in disease-related outcomes [4–7]. In breast cancer, a number of studies have demonstrated the prognostic correlation of individual cell types, including the immune cell infiltrate that predicts response to therapy [8–10], and the high percentage of tumor stroma that predicts poor prognosis in triple-negative disease but good prognosis in estrogen receptor (ER)–positive disease [11,12]. Nevertheless, different types of cells coexist with varying degrees of heterogeneity within a tumor. This fundamental feature of human tumors and the combinatorial effects of cell types have been largely ignored, and the collective implications for clinical outcome remain elusive. Consistent observations from mathematical models have highlighted that tumors with diverse microenvironments show growth patterns dramatically different from those of tumors with homogeneous environments [13] and are more likely to be associated with aggressive cancer phenotypes [2] that select for cell migration and eventual metastasis by allowing cancer cells to evolve more rapidly [14]. These observations highlight the need to understand the collective physiological characteristics and heterogeneity of tumor microenvironments. However, there is a lack of methods to quantify the high spatial variability and diverse cellular composition across different solid tumors. Moreover, the interplay of genomic alterations in cancer cells and microenvironmental heterogeneity and its subsequent role in treatment response have not been explored. Our aims were (i) to develop a computational system for quantifying microenvironmental heterogeneity based on tumor morphology in routine histological sections, (ii) to define the clinical implications of microenvironmental heterogeneity, and (iii) to integrate this histologybased index with RNA gene expression and DNA copy number profiling data to identify molecular changes associated with microenvironmental heterogeneity.
The Ecosystem Diversity Index To characterize the tumor ecosystem based on cell compositions, we developed a new index to be used in conjunction with our image analysis tool [16]. First, we used our automated morphological classification method [16] to identify and classify cells into cancer, lymphocyte, or stromal cell classes in H&E sections (Fig 1B). We next divided sections into smaller spatial regions and quantified the diversity of the tumor ecosystem in a tumor region j using the Shannon diversity index: dj ¼ Sm i pi logpi ; ð1Þ where m is the number of cell types and pi is the proportion of the ith cell type (Fig 1B and 1C). A high value of the Shannon diversity index dj reports a heterogeneous environment populated by many cell types, whilst a low value indicates a homogeneous environment (Fig 1C). Compared to other methods such as the Simpson index, the Shannon diversity index accounts for rare species and, hence, is less dominated by main species [17]. Subsequently, we derived the ecosystem diversity index (EDI) by applying unsupervised clustering that identifies the optimum number of clusters in the dataset in an unbiased manner, in order to group tumor regions and quantify the degree of spatial heterogeneity. Let D = d1,d2,…,dn be the Shannon index for n regions in a tumor. We used Gaussian mixture models to fit data D: D SK k¼1okNðmk; s2 kÞ: ð2Þ where μk, ,s2 k, and ωk are the mean, variance, and weight of a Gaussian distribution k, and K is the number of clusters. The Bayesian information criterion was then used to select the best number of clusters K [18]. We used K = 1–5 as the range of K to avoid small EDI groups (S1 Text). The final value of K thus is a measurement of heterogeneity and the score of EDI for a tumor.
Fig 5. The relationship between ecological heterogeneity and cancer genomic aberrations in 507 grade 3 tumors. (A) Genome-wide copy number aberrations in grade 3 breast tumors and genomic coordinates of genes with copy number aberrations enriched in the EDI-high group. Lengths of black lines denote level of enrichment significance with copy number gains (above the horizontal line) or losses (below the horizontal line). (B) Kaplan–Meier curves illustrating the duration of disease-specific survival in grade 3 breast cancer patients according to copy number loss of the 4p14 region (left) and the EDI-high group with additional information of 4p14 copy number loss (right). (C) Kaplan–Meier curves illustrating the duration of disease-specific survival according to copy number loss of the 5q13 region (left) and the EDI-high group with additional information of 5q13 copy number loss (right).
This study has a number of limitations. The motivation for our computational development was to use a data-driven model and measure the degree of spatial heterogeneity in tumor pathological specimens. In this model, only three major cell types in breast tumors were considered. Further sub-classification of the different types of stromal and immune cells by immunohistochemistry may add additional discriminatory value to our model. For dissecting spatial heterogeneity, we chose to use square regions with equal sizes. We found that EDI was correlated with the size of the region chosen for calculation of the Shannon diversity index, and as such the spatial heterogeneity is scale dependent. This phenomenon has been well described in a number of studies in ecology that show that a scale needs to be chosen that is appropriate for the ecological process under study [38,39], further highlighting the analogy between tumor studies and ecology. Similar to the recent observation that breast cancer subclonal heterogeneity is correlated with tumor size [35], we also found an association between microenvironmental heterogeneity and tumor size; hence, EDI may have more limited value in smaller tumors. However, small tumors were present in the EDI-high group, and addition of EDI within tumors grouped by size further stratified their prognosis. We found that EDI was prognostic only in grade 3 tumors in our study, which could be a limitation, given the possible discordance in grading between pathologists.
The identification of additional biomarkers in subgroups of patients that identify them as high risk is important for patient management and to avoid overtreatment for low-risk patients. We envision that the use of our measure of microenvironment heterogeneity, together with key genomic alterations, will enable the diagnosis of patients at very high risk of relapse and facilitate the enrollment of these patients into additional clinical trials for novel therapies or treatment intensification. Our novel computational approach provides a fully automated tool that is relatively easy to implement. Integration of this measure with genomic profiling provides additional prognostic information independent of known clinical parameters. The results of this study highlight the possibility of a grade-3-specific prognostic tool that may aid in further classification of high-grade breast cancer patients beyond standard assays such as ER and HER2 status.


Read Full Post »

RNA Modification

Larry H. Bernstein, MD, FCAP, Curator

LPBI


New RNA Modification Added to Epitranscriptomic Library   

GEN News Highlights  Feb 17, 2016    http://www.genengnews.com/gen-news-highlights/new-rna-modification-added-to-epitranscriptomic-library/81252376/


http://www.genengnews.com/Media/images/GENHighlight/109124_web3461772372.jpg


In 1956, Francis Crick—co-discoverer of DNA’s helical structure—postulated what is now considered to be a central doctrine of the biological sciences stating that “The central dogma of molecular biology deals with the detailed residue-by-residue transfer of sequential information. It states that such information cannot be transferred back from protein to either protein or nucleic acid.” What Crick was suggesting was that DNA makes RNA and, in turn, RNA makes protein.

In the time since the initial proposal of the central dogma, scientists have come to understand that there are not only instances of reverse information flow from RNA to DNA, but chemical alterations to RNA structures that can have a profound effect on gene regulation. The discovery of these alterations has added a critical dimension to how scientists view the genetic code and recently spawned an entirely new field of study within molecular biology: the epitranscriptome.

Now, a recent study by scientists at the University of Chicago and Tel Aviv University has revealed evidence that provides a promising new lever in the control of gene expression. The researchers describe a small chemical modification to RNA that can significantly boost the conversion of genes to proteins.

The findings from this study were published recently in Nature through an article entitled “The dynamic N1-methyladenosine methylome in eukaryotic messenger RNA.”

“Epigenetics, the regulation of gene expression beyond the primary information encoded by DNA, was thought until recently to be mediated by modifications of proteins and DNA,” explained co-senior study author Gidi Rechavi, Ph.D., chair in oncology at Tel Aviv University’s Sackler Faculty of Medicine and head of the Cancer Research Center at Sheba Medical Center. “The new findings bring RNA to a central position in epigenetics.”

“This discovery further opens the window on a whole new world of biology for us to explore,” added co-senior study author Chuan He, Ph.D., professor in the department of chemistry and investigator within the Howard Hughes Medical Institute at the University of Chicago. “These modifications have a major impact on almost every biological process.”

Previously, Dr. He’s laboratory discovered the first RNA demethylase that reverses the most prevalent mRNA methylation N6-methyladenosine (m6A), implying that the addition and removal of the methyl group could dramatically affect these messengers and the outcome of gene expression—as also seen for DNA and histones—which subsequent research found to be true.

In the current study, the investigators described a second functional mRNA methylation, N1-methyladenosine (m1A). Like m6A, the small modification is evolutionarily conserved and common, present in humans, rodents, and yeast. However, its location and effect on gene expression reflect a new form of epitranscriptome control.

“The discovery of m1A is extremely important, not only because of its own potential in affecting biological processes but also because it validates the hypothesis that there is not just one functional modification,” Dr. He stated. “There could be multiple modifications at different sites where each may carry a distinct message to control the fate and function of mRNA.”

From their findings, the research team estimates that that m1A may be present on transcripts of more than one out of three expressed human genes—suggesting that m1A, like m6A, may be a mechanism by which cells rapidly boost the expression of hundreds or thousands of specific genes.

“mRNA is the perfect place to regulate gene expression because they can code information from transcription and directly impact translation—you can add a consensus sequence to a group of genes and use a modification of the sequence to readily control several hundred transcripts simultaneously,” Dr. He said. “If you want to rapidly change the expression of several hundred or a thousand genes, this offers the best way.”

The scientists were excited by their findings and have plans for future studies that will examine the role of m1A methylation in human development, for diseases such as diabetes and cancer, and its potential as a target for therapeutic uses.

“This study represents a breakthrough discovery in the exciting, nascent field of the ‘epitranscriptome,’ which is how RNAs are regulated, akin to the genome and the epigenome,” commented Christopher Mason, Ph.D., associate professor at Weill Cornell Medicine, who was not affiliated with the study. “What is important about this work is that m6A was recently found to enrich at the ends of genes, and now we know that m1A is what is helping regulate the beginning of genes, and this opens up many questions about revealing the ‘epitranscriptome code’ just like the histone code or the genetic code.”


The dynamic N1-methyladenosine methylome in eukaryotic messenger RNA

Dan DominissiniSigrid NachtergaeleSharon Moshitch-MoshkovitzNitzan Kol, et al.
Nature(2016 10 Feb )      http://dx.doi.org:/10.1038/nature16998      http://www.nature.com/nature/journal/vaop/ncurrent/full/nature16998.html

Gene expression can be regulated post-transcriptionally through dynamic and reversible RNA modifications. A recent noteworthy example is N6-methyladenosine (m6A), which affects messenger RNA (mRNA) localization, stability, translation and splicing. Here we report on a new mRNA modification, N1-methyladenosine (m1A), that occurs on thousands of different gene transcripts in eukaryotic cells, from yeast to mammals, at an estimated average transcript stoichiometry of 20% in humans. Employing newly developed sequencing approaches, we show that m1A is enriched around the start codon upstream of the first splice site: it preferentially decorates more structured regions around canonical and alternative translation initiation sites, is dynamic in response to physiological conditions, and correlates positively with protein production. These unique features are highly conserved in mouse and human cells, strongly indicating a functional role for m1A in promoting translation of methylated mRNA.


Figure 1: Development of m1A-seq to map a newly identified constituent of mammalian mRNA.

Development of m1A-seq to map a newly identified constituent of mammalian mRNA.

http://www.nature.com/nature/journal/vaop/ncurrent/carousel/nature16998-f1.jpg

a, Chemical structures of m1A and m6A. Methyl groups (-CH3) are in red and the positive charge (+) on m1A is in blue. b, LC-MS/MS quantitation of m1A, m6A and Ψ in human and mouse mRNA isolated from the indicated cell types. …


Figure 3: m1A occurs in GC-rich sequence contexts and in genes with structured 5′ UTRs.

m1A occurs in GC-rich sequence contexts and in genes with structured 5′ UTRs.

http://www.nature.com/nature/journal/vaop/ncurrent/carousel/nature16998-f3.jpg

a, Sequence frequency logo for a set of 192 adenosines in peak areas that have a higher mismatch rate in immunoprecipitation relative to input (FC ≥ 6) in HepG2 demonstrates the GC-rich context of m1A. b, Length-adjusted minimum free energy…


Figure 5: m1A in mRNA is a dynamic modification that responds to changing physiological and stress conditions, and varies between tissues.

m1A in mRNA is a dynamic modification that responds to changing physiological and stress conditions, and varies between tissues.

http://www.nature.com/nature/journal/vaop/ncurrent/carousel/nature16998-f5.jpg

a, LC-MS/MS quantification of m1A (left, grey) and m6A (right, black) in mRNA of untreated and glucose-starved (upper panels) or heat shock-treated (lower panels) HepG2 cells, presented as percentage of unmodified A. Mean values ± s.e.m…


RNA modification discovery suggests new code for control of gene expression

A new cellular signal discovered by a team of scientists at the University of Chicago and Tel Aviv University provides a promising new lever in the control of gene expression.    Gene expression study

The study, published online Feb. 10 in the journal Nature, describes a small chemical modification that can significantly boost the conversion of genes to proteins. Together with other recent findings, the discovery enriches a critical new dimension to the “Central Dogma” of molecular biology: the epitranscriptome.

“This discovery further opens the window on a whole new world of biology for us to explore,” said Chuan He, the John T. Wilson Distinguished Service Professor in Chemistry, Howard Hughes Medical Institute investigator and senior author of the study. “These modifications have a major impact on almost every biological process.”

The central dogma of molecular biology describes the cellular pathway where genetic information from DNA is copied into temporary RNA “transcripts,” which provide the recipe for the production of proteins. Since Francis Crick first postulated the theory in 1956, scientists have discovered a multitude of modifications to DNA and proteins that regulate this process.

Only recently, however, have scientists focused on investigating dynamic modifications that specifically target the RNA step. In 2011, He’s group discovered the first RNA demethylase that reverses the most prevalent mRNA methylation N6-methyladenosine, or m6A, implying that the addition and removal of the methyl group could dramatically affect these messengers and impact the outcome of gene expression, as also seen for DNA and histones. Subsequently, scientists discovered that the dynamic and reversible methylation of m6A dramatically controlled the metabolism and function of most cellular messenger RNA, and thus, the production of proteins.

In the new Nature study, researchers from UChicago and Tel Aviv University describe a second functional mRNA methylation, N1-methyladenosine, or m1A. Like m6A, the small modification is evolutionarily conserved and common, and present in humans, rodents and yeast, the authors found. But its location and effect on gene expression reflect a new form of epitranscriptome control and suggest an even larger cellular “control panel.”

“The discovery of m1A is extremely important, not only because of its own potential in affecting biological processes, but also because it validates the hypothesis that there is not just one functional modification,” He said. “There could be multiple modifications at different sites where each may carry a distinct message to control the fate and function of mRNA.”

The researchers estimated that m1A was present on transcripts of more than one out of three expressed human genes. Methylated genes exhibited enhanced translation compared to unmethlyated genes, producing protein levels nearly twice as high in all cell types. This increase suggests that m1A, like m6A, may be a mechanism by which cells rapidly boost the expression of hundreds or thousands of specific genes, perhaps during important processes such as cell division, differentiation or under stress.

“mRNA is the perfect place to regulate gene expression, because they can code information from transcription and directly impact translation; you can add a consensus sequence to a group of genes and use a modification of the sequence to readily control several hundred transcripts simultaneously,” He said. “If you want to rapidly change the expression of several hundred or a thousand genes, this offers the best way.”

However, despite their complementary effects, m1A and m6A exert their influence on mRNA through different pathways. While studies have found that m6A localizes predominantly to the tail of messenger RNA molecules, increasing their translation and turnover rate, m1A was found largely near the start codon of mRNA transcripts, where protein translation begins. The different mechanisms could allow for finer tuning of post-transcriptional gene expression, or the selective activation of particular genes in different physiological situations.

“This study represents a breakthrough discovery in the exciting, nascent field of the ‘epitranscriptome,’ which is how RNAs are regulated, akin to the genome and the epigenome,” said Christopher Mason, associate professor at Weill Cornell Medicine, who was not affiliated with the study. “What is important about this work is that m6A was recently found to enrich at the ends of genes, and now we know that m1A is what is helping regulate the beginning of genes, and this opens up many questions about revealing the ‘epitranscriptome code’ just like the histone code or the genetic code.”

Future studies will examine the role of m1A methylation in human development, diseases such as diabetes and cancer, and its potential as a target for therapeutic uses.


Citation: “The dynamic N1-methyladenosine methylome in eukaryotic messenger RNA,” Nature, Feb. 10, 2016, by Chuan He, Dan Dominissini, Sigrid Nachtergaele, Qing Dai, Dali Han, Wesley Clark, Guanqun Zheng, Tao Pan and Louis Dore from the University of Chicago, and Sharon Moshitch-Moshkovitz, Eyal Peer, Nitkan Kol, Moshe Shay Ben-Haim, Ayelet Di Segni, Mali Salmon-Divon, Oz Solomon, Eran Eyal, Vera Hershkovitz, Ninette Amariglio and Gideon Rechavi from Tel Aviv University. DOI: 10.1038/nature16998

Funding: National Institutes of Health, Howard Hughes Medical Institute, Flight Attendant Medical Research Institute, Israel Science Foundation, Israeli Centers of Excellence Program, Ernest and Bonnie Beutler Research Program, Chicago Biomedical Consortium, Damon Runyon Cancer Research Foundation and Kahn Family Foundation.

– See more at: http://news.uchicago.edu/article/2016/02/16/rna-modification-discovery-suggests-new-code-control-gene-expression#sthash.HX6wUgKW.dpuf

RNA modifications and epitranscriptomics conference   
University of Chicago, Chicago, Illinois, US   September 8-9, 2016
The meeting is aimed at bringing in students and postdocs as well as faculty involved in RNA modification and epitranscriptome research.  In addition to talks, there will be a poster session and reception.

Topics

  • M6A mRNA methylation
  • Biological functions of m6A RNA methylation
  • Dynamic RNA modifications

Registration will open on March 1, 2016

Read Full Post »

Pathology Reports

Larry H. Bernstein, MD, FCAP, Curator

LPBI


Complete Pathology Reports and Clinical Decision Making

Posted by Michael Doyle on Jan 15, 2015   http://www.softworksgroup.com/blog/complete-pathology-reports

(Synoptic Reporting)

Pathology reports provide care teams with crucial diagnostic and prognostic data. For population-level research and quality assurance initiatives, it’s important that reports are consistently complete. But report consistency can also be important for the medical outcomes of a single person.

Today, I’ll discuss the unique experience of a friend of mine, and I’ll explain how his isolated incident is connected to large-scale initiatives in pathology reporting quality assurance.

Incomplete Pathology Reports

A friend of mine has particularly fair skin and is at thus at increased risk for skin cancers. His family physician has recommended he have various moles removed to prevent the development of possible skin cancers.

Over time, my friend and his family physician became troubled by the inconsistencies they found in comparing the pathology reports from his five different biopsies.

Five out of five pathology reports identified that the moles were dysplastic—irregular and potentially cancerous. Yet only three reports identified that this dysplasia was in his skin’s basal cells as opposed to squamous cells or melanocytes.

The the type of skin cells exhibiting dysplasia is important to clinical decision making: dysplasia affecting melanocytes is the basis for melanomas, the most serious forms of skin cancer. Lacking this information makes it more difficult for care teams to develop the comprehensive understanding of an individual’s medical history that guides clinical decision making.

In response to the incompleteness of the pathology reports, the family physician remarked, “I rarely have to query a pathologist about what’s in a report. It’s usually about what’s left out.”

And it’s not just one physician who’s seeking better reports.

Synoptic Reporting for Complete Consistency in Pathology

For over 20 years, the College of American Pathologists (CAP) has been developing protocols and templates to standardize pathology reporting, substantially improving the completeness and consistency of pathology reports through the use of the synoptic—i.e. structured—format.

Synoptic reporting uses coded data templates to produce standardized reports that are more complete and consistent than reports generated using narrative methods.

Cancer Care Ontario introduced synoptic reporting for pathologist across the province—the largest jurisdiction to do so. Clinicians have shown over-whelming support for this initiative, finding that synoptic reports have facilitated consistent intepretation of diagnostic and prognostic data.

The Canadian Partnership Against Cancer is building on Ontario’s success to help implement synoptic pathology reporting across Canada, strengthening provincial cancer registries and fostering cross-jurisdictional research and quality assurance initiatives.

Clinical research has continually found that the use of synoptic reporting improves the completeness of pathology reports [123, 4]. These conclusions have been upheld in research on synoptic reporting for surgery as well [5, 6].

An important goal of synoptic reporting implementation initiatives is equipping pathologists and surgeons with clinical documentation software that enables them to provide each other with specific, reliable and actionable data—through complete and consistent reports.

Read Full Post »

Tunable light sources

Larry H. Bernstein, MD, FCAP, Curator

LPBI


Putting Tunable Light Sources to the Test

Common goals of spectroscopy applications such as studying the chemical or biological properties of a material often dictate the requirements of the measurement system’s lamp, power supply and monochromator.

JEFF ENG AND JOHN PARK, PH.D., NEWPORT CORP.   http://www.photonics.com/Article.aspx?AID=58302

Many common spectroscopic measurements require the coordinated operation of a detection instrument and light source, as well as data acquisition and processing. Integration of individual components can be challenging and various applications may have different requirements. Conventional lamp-based tunable light sources are a popular choice for applications requiring a measurement system with this degree of capability.

Many types of tunable light sources are available, with differences in individual component performance translating to the performance of the system as a whole. Tunable light sources are finding themselves to be an especially ideal system for one application in particular: quantum efficiency and spectral responsivity characterization of photonic sensors, such as solar cells.

Xenon and mercury xenon lamps, two examples of DC arc lamps.

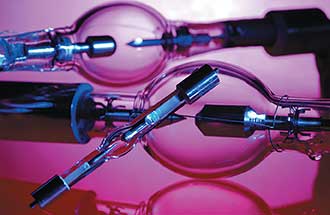
http://www.photonics.com/images/Web/Articles/2016/2/10/Light_Lamps.jpg

Xenon and mercury xenon lamps, two examples of DC arc lamps.

The tunable light source’s (TLS) versatility as both a broadband and high-resolution monochromatic light source makes the unit suitable for a variety of applications, such as the study of wavelength-dependent chemical or biological properties or wavelength-induced physical changes of materials. These light sources can also be used in color analysis and reflectivity measurements of materials for quality purposes.

Among their unique attributes, the TLS can produce monochromatic light from the UV to near-infrared (NIR). Lamp-based TLSs feature two major components: a light source and a monochromator. Common lamps used in TLSs are the DC arc lamp and quartz tungsten halogen (QTH) lamp. While both of these lamps have a broad emission spectrum, arc and QTH lamps differ in the characteristic wavelength emissions or relatively smooth shape of their spectral output curves, respectively. A stable power supply for the lamp is a critical component since most applications require high light output power stability1.

Smooth spectral output vs. monochromator throughput

DC arc lamps are excellent sources of continuous wave, broadband light. They consist of two electrodes (an anode and a cathode) separated by a gas such as neon, argon, mercury or xenon. Light is generated by ionizing the gas between the electrodes. The bright broadband emission from this short arc between the anode and cathode makes these lamps high-intensity point sources, capable of being collimated with the proper lens configuration.

DC arc lamps also offer the advantages of long lifetime, superior monochromator throughput (particularly in the UV range) and a smaller divergence angle. They are particularly well-suited for fiber coupling applications2. (See Figure 1.)

A xenon arc lamp housed in an Oriel Research lamp housing.

Figure 1. A xenon arc lamp housed in an Oriel Research lamp housing. Photo courtesy of Newport Corp.

Xenon (Xe) arc lamps, in particular, have a relatively smooth emission curve in the UV to visible spectrums, with characteristic wavelengths emitted from 380 to 750 nm. However, strong xenon peaks are emitted between 750 to 1000 nm.

Their sunlike emission spectrum and about 5800 K color temperature make them a popular choice for solar simulation applications. (See Figure 2.)

Arc lamps can have the following specialty characteristics:

Ozone-free: Wavelength emissions below about 260 nm create toxic ozone. Ideally, an arc lamp is operated outdoors or in a room with adequate ventilation to protect the user from the ozone created.

UV-enhanced: For applications requiring additional UV light intensity, UV-enhanced lamps should be used. These lamps provide the same visible to NIR performance of an arc lamp while providing high-intensity UV output due to changes in the material of the lamp’s glass envelope.

High-stability: High-stability arc lamps are made of a higher quality cathode than that typically used for arc lamp construction. As a result, no arc wander occurs, allowing the lamp to maintain consistent output intensity throughout its lifetime.

The spectral output of 3000-W Xe and 250-W QTH lamps used in Oriel’s Tunable Light Sources.

Figure 2. The spectral output of 3000-W Xe and 250-W QTH lamps used in Oriel’s Tunable Light Sources.Photo courtesy of Newport Corp.

QTH lamps produce light by heating a filament wire with an electric current. The hot filament wire is surrounded by a vacuum or inert gas to prevent oxidation. QTH lamps are not very efficient at converting electricity to light, but they offer very accurate color reproduction due to their continuous blackbody spectrum. These lamps are a popular alternative to arc lamps due to their higher output intensity stability and lack of intense UV light emission, spectral emission lines in their output curve and toxic ozone production. These advantages over traditional DC arc lamps make QTH lamps preferable for radiometric and photometric applications as well as excitation sources of visible to NIR light. QTH lamps are also easier to handle and install, and produce a smooth output spectrum. Selecting the most appropriate lamp type is a matter of deciding which performance criteria are most important.

Constant current vs. constant power

The power supply is a vital component for operating a DC arc or QTH lamp with minimum light ripple. The lamps are operated in either constant current or constant power mode and are used in applications such as radiometric measurements, where a stable light output is required for accurate measurement. Providing stable electrical power to the lamp is important since fluctuations in the wavelength and output intensity of the light source impact the accuracy of measurement.

There is very little difference in the short-term output stability when operating an arc lamp or QTH lamp in constant current or constant power mode. However, the differences appear as the lamp ages. For arc lamps, even with a stable power supply, deposits on the inside of the lamp envelope are visible as the electrodes degrade, which causes an unstable arc position, changing the electrical characteristics of the arc lamp. The distance between the cathode and anode of the arc lamp increases, raising the lamp’s operating voltage. For QTH lamps, deposits on the inside of the lamp envelope are visible as the lamp filament degrades, changing the electrical and spectral characteristics of the lamp.

In power mode, the lamp is operated at a constant power setting. As the voltage cannot be changed, the current is raised or lowered to maintain the power at the same level. As the lamp ages, the radiant output decreases. However, lamp lifetime is prolonged.

In current mode, the lamp is operated at a constant current setting. As the voltage cannot be changed, the power is raised or lowered to maintain the current at the same level. As the lamp ages, the input power required for operation is increased. This results in greater output power, which, to some extent, may help compensate for a darkening lamp envelope. However, the lamp’s lifetime is greatly reduced due to the increase in power.

Although power supplies are highly regulated, there are factors beyond the control of the power supply that may affect light output. Some of these factors include lamp aging, ambient temperature fluctuations and filament erosion. For applications in which high stability light output intensity is especially critical, optical feedback control of power supply is suggested in order to compensate for such factors3. (See Figure 3.)

Oriel’s OPS Series Power Supplies offer the option of operating a lamp in constant power, constant current or intensity operation modes.

Figure 3. Oriel’s OPS Series Power Supplies offer the option of operating a lamp in constant power, constant current or intensity operation modes. Photo courtesy of Newport Corp.

Diffraction gratings narrow the wavelength band

Monochromators use diffraction gratings to spatially isolate and select a narrow band of wavelengths from a wider wavelength emitting light source. They are a valuable piece of equipment because they can be used to create quasi-monochromatic light and also take high precision spectral measurements. A high precision stepper motor is typically used to select the desired wavelength and switch between diffraction gratings quickly, without sacrificing instrument performance.

Determining which slit width to use is based on the trade-off between light throughput and the resolution required for measurement. A larger slit width allows for more light throughput. However, more light throughput results in poorer resolution. When choosing a slit width at which to operate the monochromator, both the input and output ports must be set to the same slit width. (See Figure 4.) Focused light enters the monochromator through the entrance slit, and is redirected by the collimating mirror toward the grating. The grating directs the light toward the focusing mirror, which then redirects the chosen wavelength toward the exit slit. At the exit slits, quasi-monochromatic light is emitted4.

A fixed width slit being installed into an Oriel Cornerstone 130 monochromator.

Figure 4. A fixed width slit being installed into an Oriel Cornerstone 130 monochromator.Photo courtesy of Newport Corp.

Measuring quantum efficiencies

Measuring quantum efficiency (QE) over a range of different wavelengths to measure a device’s QE at each photon energy level is an ideal task for a tunable light source. The QE of a photoelectric material for photons with energy below the band gap is zero. The QE value of a light-sensing device such as a solar cell indicates the amount of current that the cell will produce when irradiated by photons of a particular wavelength. The principle of QE measurement is to count the proportion of carriers extracted from the material’s valence band to the number of photons impinging on the surface. To do this, it is necessary to shine a calibrated, tunable light on the cell, while simultaneously measuring the output current. The key to accurate measurement of the QE/internal photon to current efficiency is to accurately know how much scanning light is incident on the device under test and how much current is generated. Thus, measurement of light output with a NIST (National Institute of Standards and Technology) traceable calibrated detector is necessary prior to testing since illumination of an absolute optical power is required.

External quantum efficiency (EQE) is the ratio of the number of photons incident on a solar cell to the number of generated charge carriers. Internal quantum efficiency (IQE) also considers the internal efficiency — that is, the losses associated with the photons absorbed by nonactive layers of the cell. By comparison, EQE is much more straightforward to measure, and gives a direct parameter of how much output current will be contributed to the output circuit per incident photon at a given wavelength. IQE is a more in-depth parameter, taking into account the photoelectric efficiency of all composite layers of a material. In an IQE measurement, these losses from nonactive layers of the material are measured in order to calculate a net quantum efficiency — a much truer efficiency measurement.

Understanding the conversion efficiency as a function of the wavelength of light impingent on the cell makes QE measurement critical for materials research and solar cell design. With this data, the solar cell composition and topography can be modified to optimize conversion over the broadest possible range of wavelengths.

As a formula, it is given by IQE = EQE/(1 − R), where R is the reflectivity, direct and diffuse, of the solar cell. The IQE is an indication of the capacity of the active layers of the solar cell to make good use of the absorbed photons. It is always higher than the EQE, but should never exceed 100 percent, with the exception of multiple-exciton generation. Figure 5 illustrates how the tunable light source is used to illuminate the solar cell to perform an IQE measurement. The software controls all components of the measurement system, including the monochromator and data acquisition5.

A sample QE measurement system using the components of a tunable light source.

Figure 5. A sample QE measurement system using the components of a tunable light source. Photo courtesy of Newport Corp.

To measure quantum efficiency in 10-nm wavelength steps, the slit size of the monochromator is typically hundreds of micron in width. The slit width is reduced approximately half if 5-nm wavelength increments are desired. However, output power of the monochromator is reduced by more than 50 percent if the slit width is halved. Lowering optical power impacts QE measurement since a solar cell responds to this diminished optical power with low output current. This can result in a poor signal-to-noise ratio, making a QE measurement error more likely. The detection of low current requires very sensitive equipment with the ability to measure current down to the pico-ampere level. To make for an easier signal measurement, optical power is typically increased. A DC arc source is the better choice for QE measurements made in 5-nm increments or lower due to the lamp’s arc size resulting in better monochromator throughput. However, a QTH lamp is the better choice if greater than 0.1 percent light stability is required, with the trade-off of not being able to measure in as precise wavelength increments as if an arc lamp was used.

Balance between optical power and resolution is an important consideration as it impacts the quality of the QE measurement. The selection of lamp type and monochromator specifications are important considerations for TLS design. To be considered a suitable component for the majority of spectroscopic applications, high-output power and stability, long lifetime of the lamp, and broadband spectral emission with high resolution capability are required for the TLS.

Meet the authors

John Park, new product development manager at Newport Corp., has designed and developed numerous spectroscopy instruments for the photonics industry for over 10 years. He holds two granted patents and is a graduate from University of California, Irvine, with a Ph.D. in electrical engineering; email: john.park@newport.com. Jeff Eng is a product specialist for Oriel Spectroscopy Products at Newport Corp. His work experience includes application support, business-to-business sales and marketing activity of photonic light sources and detectors. He is a graduate of Rutgers University; email: jeff.eng@newport.com.

References

1. Newport Corp., Oriel Instruments TLS datasheet. Tunable Xe arch lamp sources.http://assets.newport.com/webDocuments-EN/images/39191.pdf.

2. Newport Corp., Oriel Instruments handbook: The Book of Photon Tools, light source section.

3. Newport Corp., Oriel Instruments OPS datasheet. OPS-A series arc lamp power supplies.http://assets.newport.com/webDocuments-EN/images/OPS-A%20Series%20Power%20Supply%20Datasheet.pdf.

4. J. M. Lerner and A. Thevenon (1988). The Optics of Spectroscopy. Edison, N.J.: Optical Systems/Instruments SA Inc.

5. K. Emery (2005). Handbook of Photovoltaic Science and Engineering, eds. A. Luque and S. Hegedus. Chapter 16: Measurement and characterization of solar cells and modules. Hoboken, N.J.: John Wiley & Sons Ltd.

Read Full Post »

Dialysis alternative

Curators: Larry Bernstein, MD and Jennifer Schwartz, Ursulin College and Cleveland Clinic


VU Inside: Dr. William Fissell’s Artificial Kidney

by | Feb. 12, 2016           http://news.vanderbilt.edu/2016/02/vu-inside-dr-william-fissell%E2%80%99s-artificial-kidney/

Vanderbilt is using a microchip to build a first-ever artificial kidney

https://youtu.be/5Qasy3YvvBE

Vanderbilt University Medical Center nephrologist and Associate Professor of Medicine Dr. William H. Fissell IV, is making major progress on a first-of-its kind device to free kidney patients from dialysis. He is building an implantable artificial kidney with microchip filters and living kidney cells that will be powered by a patient’s own heart. The bio-hybrid device will mimic a kidney to remove enough waste products, salt and water to keep a patient off dialysis,” said Fissell.

Fissell says the goal is to make it small enough, roughly the size of a soda can, to be implanted inside a patient’s body.

Nanotechnology

The key to the device is a microchip.

“It’s called silicon nanotechnology. It uses the same processes that were developed by the microelectronics industry for computers,” said Fissell.

The chips are affordable, precise and make ideal filters. Fissell and his team are designing each pore in the filter one by one based on what they want that pore to do. Each device will hold roughly fifteen microchips layered on top of each other.

But the microchips have another essential role beyond filtering.

“They’re also the scaffold in which living kidney cells will rest,” said Fissell.


close-up of microchip held by tweezers

http://news.vanderbilt.edu/files/Fissellmicrochip-585×299.jpg

An example of the microchip filter being used inside Fissell’s artificial kidney. (Vanderbilt University)


Living kidney cells

Fissell and his team use live kidney cells that will grow on and around the microchip filters. The goal is for these cells to mimic the natural actions of the kidney.

“We can leverage Mother Nature’s 60 million years of research and development and use kidney cells that fortunately for us grow well in the lab dish, and grow them into a bioreactor of living cells that will be the only ‘Santa Claus’ membrane in the world: the only membrane that will know which chemicals have been naughty and which have been nice. Then they can reabsorb the nutrients your body needs and discard the wastes your body desperately wants to get rid of,” said Fissell.

Avoiding organ rejection

Because this bio-hybrid device sits out of reach from the body’s immune response, it is protected from rejection.

“The issue is not one of immune compliance, of matching, like it is with an organ transplant,” said Fissell.

How it works

The device operates naturally with a patient’s blood flow.

The device operates naturally with a patient’s blood flow.

“Our challenge is to take blood in a blood vessel and push it through the device. We must transform that unsteady pulsating blood flow in the arteries and move it through an artificial device without clotting or damage.”

Fluid dynamics

And that’s where Vanderbilt biomedical engineer Amanda Buck comes in. Buck is using fluid dynamics to see if there are certain regions in the device that might cause clotting.

“It’s fun to go in and work in a field that I love, fluid mechanics, and get to see it help somebody,” said Buck.

She uses computer models to refine the shape of the channels for the smoothest blood flow. Then they rapidly prototype the new design using 3-D printing and test it to make the blood flow as smoothly as possible.


Amanda sitting at her desk looking at fluid dynamics models on a computer screen

http://news.vanderbilt.edu/files/AmandaBuckworking-585×299.jpg

Vanderbilt biomedical engineer Amanda Buck is using fluid dynamics to see if there are certain regions in the device that might cause clotting.


Future human trials

Fissell says he has a long list of dialysis patients eager to join a future human trial. Pilot studies of the silicon filters could start in patients by the end of 2017.

“My patients are absolutely my heroes,” said Fissell. “They come back again and again and they accept a crushing burden of illness because they want to live. And they’re willing to put all of that at risk for the sake of another patient.”

Federal investment

The National Institutes of Health awarded a four-year, $6 million grant to Fissell and his research partner Shuvo Roy from the University of California at San Francisco. The two investigators are longtime collaborators on this research. In 2003, the kidney project attracted its first NIH funding, and in 2012 the Food and Drug Administration selected the project for a fast-track approval program. The work is supported by NIH grant 1U01EB021214-01.

The National Kidney Foundation reports that in 2012, Federal Medicare dollars paid more than $87 billion caring for kidney disease patients (not including prescription medications).

Desperate need

Transplant of a human kidney is the best treatment for kidney failure, but donor kidneys are in short supply. According to the U.S. Organ Procurement and Transplantation Network, although more than 100,000 patients in the United States are on the waiting list for a kidney transplant, last year only 17,108 received one.

In all, the National Kidney Foundation says more than 460,000 Americans have end-stage renal disease and every day, 13 people die waiting for a kidney.

Read more about the NIH grant here.

By Amy Wolf

Media Inquiries: Craig Boerner, (615) 322-4747
craig.boerner@vanderbilt.edu

Media Inquiries:
Amy Wolf, (615) 322-NEWS
amy.wolf@vanderbilt.edu

Read Full Post »

IsomicroRNA

Larry H. Bernstein, MD, FCAP, Curator

LPBI


GEN Feb 15, 2016 (Vol. 36, No. 4)

MicroRNAs Rise from Trash to Treasure  

MicroRNAs Are More Plentiful and More Subtle In Action Than Was Once Suspected

Richard A. Stein, M.D., Ph.D.


One of the unexpected findings of the Human Genome Project was that over 98% of the human genome does not encode for proteins. Once dismissed as “junk” genomic material, non-protein-coding DNA is now appraised more highly.

Or to be more precise, at least some portions of non-protein-coding DNA are thought to serve important biological functions.

For example, some stretches of DNA give rise to a noncoding but still functional kind of RNA called microRNA. MicroRNAs have increasingly emerged in recent years as key regulators of biological processes and pathways.

During the years since their discovery, a key question in the biology of microRNAs has focused on the number of microRNAs encoded in the genome. Between 1993 and 2015, approximately 1,900 human genome loci were discovered to produce microRNAs and were added to miRBbase, the public database that catalogues and annotates microRNA molecules.

The cataloguing of microRNAs work has been pursued with extra urgency since 2004, the year the connection between microRNAs and human disease was first demonstrated. “When this connection was made, it launched a whole new field,” says Isidore Rigoutsos, Ph.D., professor of pathology, anatomy, and cell biology and director of the Computational Medicine Center at Thomas Jefferson University.


Another Set of MicroRNAs Emerge

“We wanted to know how many microRNA-producing loci really exist in humans,” recalls Dr. Rigoutsos. In a study published in 2015, Dr. Rigoutsos and colleagues analyzed datasets from 1,323 individuals that represented 13 different tissues and identified an additional 3,356 such genomic loci that produce (at least) 3,707 novel microRNs

“We basically tripled the number of locations in the human genome that are now known to encode microRNAs,” asserts Dr. Rigoutsos. Considering that each microRNA regulates up to hundreds of different mRNAs, and that each mRNA is regulated by tens of microRNAs, this finding adds a new layer of complexity to the regulatory dynamics of the human transcriptome.

The newly unveiled microRNAs and previously characterized microRNAs have distinct expression patterns. While 50–60% of the microRNAs previously deposited into the miRBase are expressed in multiple tissues, only about 10% of the newly discovered microRNAs are shared across multiple tissue types. Also, most of the newly found microRNAs show tissue-specific expression.

Using Argonaute CLIP-seq data, Dr. Rigoutsos and colleagues showed that similar percentages of the two sets of microRNAs were in complex with Argonaute proteins. “This shows that these novel microRNAs participate in RNA interference just as frequently as the miRBase microRNAs,” contends Dr. Rigoutsos.

In a comparative analysis between the human microRNA datasets and the chimpanzee, gorilla, orangutan, macaque, mouse, fruit fly, and mouse genomes, Dr. Rigoutsos and colleagues discovered that almost 95% of the newly unveiled microRNAs were primate-specific, and over 56% of them were found only in humans.

“We are seeing many human microRNAs that do not exist in the mouse,” states Dr. Rigoutsos. “This means that the mouse models engineered to capture human disease cannot recapitulate the interactions mediated by these microRNAs.


  • Interest in IsomiRs Grows

  • In the years since the biology of microRNAs started receiving increasing attention, the conventional view has been that one microRNA locus generates one microRNA. However, once deep sequencing became widely available, microRNA variants that showed differences at their 5′- or 3′-termini have been described.

    “It was initially presumed that these variants were likely the result of the enzyme Dicer not being sufficiently accurate when processing microRNA precursors,” notes Dr. Rigoutsos. Subsequent research revealed that microRNAs are more dynamic than previously thought, with each precursor being able to generate multiple mature microRNA species known as isomiRs.

    To gain insight into the biology of isomiRs, Dr. Rigoutsos and colleagues analyzed genomic datasets from 452 individuals participating in the 1000 Genomes Project. The datasets comprised five different populations and two races. In addition, each population was represented by an even number of men and women.

    This collection allowed the abundance of microRNA isoforms to be examined with respect to population, gender, and race. “We found that isomiRs have expression profiles that are population-, race-, and gender-dependent,” informs Dr. Rigoutsos.

    All the transcriptome data that this analysis was based on came from immortalized B cells. “These are cells that normally are not associated with gender differences, but molecularly we found, in these cells, differences between men and women of the same population and race,” explains Dr. Rigoutsos.

  • Expanding these observations to disease states, Dr. Rigoutsos and colleagues collected isomiR profiles from tissue affected by breast cancer, and compared them with isomiR profiles from control breast tissue. The investigators found that the isomiR profiles also depend on tissue state (healthy vs. diseased), on disease subtype, and on the patient’s race.

    For example, their analysis identified several miR-183-5p isoforms that were upregulated in white triple-negative breast cancer patients compared to control breast samples, but not in black/African-American triple-negative breast cancer patients. In an in vitro phase of this study, three isoforms of this microRNA species were overexpressed in human breast cancer cell lines.

    “We found very little overlap in the gene sets that were affected by each of these isoforms,” emphasizes Dr. Rigoutsos. Despite being generated simultaneously by the same locus, each of the three isoforms affected distinct groups of genes, thus exerting different effects on the transcriptome.

    “As the relative abundance of these isoforms changes ever so slightly from patient to patient, it will affect the corresponding gene groups slightly differently,” concludes Dr. Rigoutsos. “In the process, it creates a new molecular background in each patient.”

    MicroRNAs Point to Therapeutic Strategies against Colorectal Cancer

  • “We are using microRNAs as modulators to overcome chemotherapy resistance in colorectal cancer,” says Jingfang Ju, Ph.D., associate professor of pathology and co-director of translational research at Stony Brook University School of Medicine. Resistance to chemotherapy is one of the major challenges in the clinical management of malignancies, including colorectal cancer. Chemotherapy is usually unable to eliminate cancer stem cells, which may become even more resistant over time, and several microRNAs have been implicated in this process.  “We reasoned that we could provide new modulatory approaches to target this small cell population and allow chemotherapy, radiotherapy, or immunotherapy to eliminate resistant populations or at least prolong long-term survival,”  Dr. Ju said.
  • http://www.genengnews.com/Media/images/Article/StonyBrookUniv_JingfangJu5310853233.jpg

    This image shows how miR-129 may function as a tumor suppressor in colorectal cancer. In this model, which has been proposed by researchers at Stony Brook University’s Translational Research Laboratory, miR-129 suppresses the protein expression of three critical targets—BCL2, TS, and E2F3. Downregulation of BCL2 activates the intrinsic apoptosis pathway by cleaving caspase-9 and caspase-3. Downregulation of TS and E2F3 inhibits cell proliferation by impacting the cell cycle. Consequently, miR-129 exerts a strong antitumor phenotype by induction of apoptosis and impairment of proliferation in tumor cells. [Mihriban Karaayvaz, Haiyan Zhai, Jingfang Ju]


    In a retrospective study in which colorectal patient samples were used, Dr. Ju and colleagues revealed that hsa-miR-140-5p expression progressively decreases from normal tissues to primary colorectal cancer tissue, and that it shows a further decrease in liver and lymph node metastases. The experimental overexpression of hsa-miR-140-5p inhibited colorectal cancer stem cell growth by disrupting autophagy, and in a mouse model of disease it abolished tumor formation and metastasis.

    In addition to hsa-miR-140-5p, Dr. Ju and colleagues recently identified hsa-miR-129 and found that it, too, has therapeutic potential. Specifically, they showed that hsa-miR-129 enhanced the sensitivity of colorectal cancer cells to 5-fluorouracil, pointing toward its ability to function as a tumor suppressor.

    One of the mechanisms implicated in this process was the ability of miR-192 to inhibit protein translation of several important targets. These include Bcl-2 (B-cell lymphoma 2), a key anti-apoptotic protein; E2F3, a major cell cycle regulator; and thymidylate synthase, an enzyme that is inhibited by 5-fluorouracil.

    The NIH recently awarded a $3 million grant to establish the Long Island Bioscience Hub (LIBH), which is part of the NIH’s Research Evaluation and Commercialization Hub (REACH) program and represents a partnership between the Center for Biotechnology, Stony Brook University, Cold Spring Harbor Laboratory, and Brookhaven National Laboratory. One of the technology development grants, as part of the first funding cycle of this initiative, will support a feasibility investigation of hsa-miR-129-based therapeutics in colon cancer, an effort led by Dr. Ju. “We are further exploring this novel mechanism,” states Dr. Ju. “We anticipate conducting pharmacokinetic studies and moving to a clinical trial in the future.”

    MicroRNA Insights Gleaned from Host-Virus Interactions

    http://www.genengnews.com/Media/images/Article/MtSinaiHosp_Benjamin_tenOever1664523413.jpg

    At Mount Sinai Hospital’s Icahn School of Medicine, researchers used a codon-optimized version of VP55 produced from an adenovirus-based vector to study the impact of microRNA deletion on the response to virus infection. This image shows RNA in situ hybridization of fibroblasts expressing VP55 (top left), and that of mock-treated fibroblasts (bottom right). Ribosomal RNA, DNA, and microRNAs (miR-26) are depicted by red, blue (DAPI), and green fluorophores, respectively.

    “We observed that when a poxvirus is artificially engineered to encode a microRNA, the microRNA is destroyed along with all the microRNAs from the host cell,” says Benjamin R. tenOever, Ph.D., professor of microbiology at the Icahn School of Medicine, Mount Sinai Hospital. Previously, Dr. tenOever’s group reported that a single vaccinia virus-encoded gene product, VP55, is sufficient to achieve this effect. The group also found that the protein adds nontemplate adenosines to the 3′-end of microRNAs associated with the RNA-induced silencing complex.

    biology,” asserts Dr. tenOever.

    In a recent study, Dr. tenOever and colleagues used a codon-optimized version of VP55 produced from an adenovirus-based vector to study the impact microRNA deletion would have on our normal response to virus infection. “We found that after administration of the vector and rapid ablation of microRNA expression, there is very little that happens over the first one to two days,” informs Dr. tenOever. During the first 24–48 hours after VP55 delivery, the elimination of cellular microRNAs impacted less than 0.35% of the over 11,000 genes expressed in the cell. After 9 days, however, almost 20% of the genes showed significant changes in expression.

    “MicroRNAs are very powerful and influential in controlling the biology of the cell but they do so over the long term,” declares Dr. tenOever. These findings are in agreement with knowledge that has accumulated over the years about microRNA biology, which established that microRNAs play a central role in determining how cells differentiate during development.

    “While microRNAs can act on hundreds of mRNAs, their action requires several days of fine-tuning to have long-term consequences,” adds Dr. tenOever. This finding suggests miRNAs are unable to significantly contribute to the acute response to virus infection.

    The one exception to this observation was that, even though very few genes were affected in the first 48 hours after VP55 delivery, several genes encoding chemokines were impacted. These included chemokines responsible for recruiting antigen-presenting cells, neutrophils, and other immune cells.

    An in vivo analysis of mouse lung tissue 48 hours after vector administration confirmed that several cytokines were specifically upregulated, resulting in immune cell infiltration following the degradation of all microRNAs. These results indicate that the acute viral infection is largely independent of microRNAs, and that microRNAs are primarily involved in the adaptive response to infection and other longer term processes.

    • MicroRNA Biomarkers Reveal Molecular Pathways of Kidney Damage

      “Our approach involves looking at microRNAs from the perspective of biomarkers as a readout for kidney damage,” says Vishal S. Vaidya, Ph.D., associate professor of medicine and environmental health at Brigham and Women’s Hospital, Harvard Medical School, and Harvard T.H. Chan School of Public Health. “At the same time, we are exploring their utility as therapeutics.”

      A large number of medications and occupational toxins cause kidney damage, but many tests to assess kidney function and damage are not sufficiently sensitive or specific, opening the need for novel diagnostic strategies. MicroRNAs, which are differentially expressed between healthy and diseased states, are promising as early biomarkers for impaired renal function.

      “MicroRNAs can also provide information about which pathways are active and which targets can be druggable,” points out Dr. Vaidya.

      In a study that used microRNAs and proteins to provide a combined biomarker signature, Dr. Vaidya and colleagues examined two patient cohorts, one presenting with acetaminophen-induced kidney injury and the other one with cisplatin-induced kidney damage. “Protein biomarkers provide sensitivity, and microRNAs offer mechanistic insight,” explains Dr. Vaidya.

      This approach helped visualize metabolic pathways that are altered in the kidney during toxic injury. “The biggest challenge, from a therapeutic perspective, is that microRNAs regulate many mRNAs and, therefore, impact many proteins,” concludes Dr. Vaidya.

Read Full Post »

Is the Warburg effect an effect of deregulated space occupancy of methylome?

Larry H. Bernstein and Radoslov Rosov, co-curation

LPBI

UPDATED

8/20/2024

Editor Correction:  One of the co-curators names on this article was misspelled. The co-curators should be Larry H. Bernstein and  Radislov Rosov.

Therefore the correction version of the article title and authors should read

Is the Warburg effect an effect of deregulated space occupancy of methylome?

Larry H. Bernstein and Radoslov Rosov, co-curation

The editors of LPBI Group apologize for the confusion.


It would appear that pyruvate is directly used by cancer cell machinery for sustaining genome independence, and that CRISP-Cas9 system is essentially a modified CAD protein for making small bases.

13C-labeled biochemical probes for the study of cancer metabolism with dynamic nuclear polarization-enhanced magnetic resonance imaging

Lucia Salamanca-Cardona and Kayvan R. Keshari

Cancer & Metabolism 2015; 3:9          http://dx.doi.org:/10.1186/s40170-015-0136-2

In recent years, advances in metabolic imaging have become dependable tools for the diagnosis and treatment assessment in cancer. Dynamic nuclear polarization (DNP) has recently emerged as a promising technology in hyperpolarized (HP) magnetic resonance imaging (MRI) and has reached clinical relevance with the successful visualization of [1-13C] pyruvate as a molecular imaging probe in human prostate cancer. This review focuses on introducing representative compounds relevant to metabolism that are characteristic of cancer tissue: aerobic glycolysis and pyruvate metabolism, glutamine addiction and glutamine/glutamate metabolism, and the redox state and ascorbate/dehydroascorbate metabolism. In addition, a brief introduction of probes that can be used to trace necrosis, pH changes, and other pathways relevant to cancer is presented to demonstrate the potential that HP MRI has to revolutionize the use of molecular imaging for diagnosis and assessment of treatments in cancer.


Since the hallmark discovery of the Warburg effect in cancer cells in the 1920s, it has been widely accepted that the metabolic properties of cancer cells are vastly different from those of normal cells [1]. Starting from the observation that many cancerous (neoplastic) cells have higher rates of glucose utilization and lactate production, the development of tools and methods to correlate specific cellular metabolic processes to different types of cancer cells has received increased research focus [2, 3]. Several imaging techniques are currently in use for this purpose, including radiography, scintigraphy, positron emission tomography (PET), single-photon emission computed tomography (SPECT), and magnetic resonance (MR) [4, 5].

For more than 30 years, MR has been a revolutionary diagnostic tool, used in a wide range of settings from the central nervous system to cardiomyopathies and cancers. MR imaging (MRI) can outline molecular and cellular processes with high spatial resolution. Typically, MRI of body tissues is achieved via contrast visualization of the protons (1H) of water, which are present in high abundance in living systems. This can be extended to MR spectroscopy (MRS), which can further differentiate between less abundant, carbon-bearing, biological metabolites in vivo utilizing 1Hs of these compounds [6, 7]. However, despite its usefulness in imaging whole body tissues, 1H MRS has low spectral resolution and poor sensitivity for these less abundant metabolites. In addition,13C MRS is increasingly difficult, in comparison to 1H MRS, in that both the gyromagnetic ratio (approximately 25 % of 1H) and natural abundance (1.1 % of 1H) are significantly lower, making the detection of carbon-bearing compounds difficult [8, 9]. The low spectral resolution of 1H MRS for metabolites can be addressed by using 13C-enriched compounds, and with this direct 13C MRS, metabolic processes can be traced, utilizing enriched tags on specific carbons in a given metabolite [10]. While enrichment of molecules in 13C can also moderately address the sensitivity limitation of MRS, recent work in hyperpolarization (HP) provides a means of dramatically increasing sensitivity and enhancing signals, well beyond that of the equilibrium state obtained via MRS. [11, 12]. The focus of this review will be the introduction of this approach in the setting of cancer metabolism, delineating probes of interest, which have been applied to study metabolic processes in vivo.

Obtaining a hyperpolarized probe

In MR, a desired target is placed in a magnetic field where the nuclear spins of molecules are aligned with or against the direction of the magnetic field. The nuclear spins have thus different energies, and an MR signal is detected upon relaxation of nuclear spins of higher energy. At thermal equilibrium, the number of spins aligned with the magnetic field nearly equals the number of spins opposing the direction of the magnetic field. Thus, at thermal equilibrium, spin polarization is in the order of >0.0005 % resulting in a limited signal. Signal increases on the order of 100,000-fold can be achieved by hyperpolarizing the system via the redistribution of the spin population levels found at equilibrium [10, 13]. There are several techniques that have been used to achieve hyperpolarization of various nuclei: spin-exchange optical pumping of 3He and 129Xe, parahydrogen-induced polarization (PHIP), and dissolution dynamic nuclear polarization (DNP) [11,14, 15]. Both PHIP and DNP techniques can polarize biologically relevant nuclei like 13C and 15N, although there is a wider range of molecules that can be targeted for hyperpolarization using dissolution DNP [14, 1618].

The goal of DNP is the transfer of polarization from highly polarized unpaired electron spins to the nuclear spins of a desired target compound. This is achieved by applying an external magnetic field to a free-radical agent in order to polarize electron spins, followed by saturating the electron spin resonance via microwave irradiation in order to obtain polarization transfer. The free-radical agent is generally a stable organic compound that is compatible with aqueous buffers, which are used as solvent in order to obtain a homogeneous distribution of the radical [13]. Nearly 100 % of the electrons on the free-radical agent are polarized when the free-radical/solvent mixture is subjected to high magnetic fields (≥3.3 T) followed by rapid freezing to 1 K using liquid helium in order to obtain a sample frozen to an amorphous state, which is necessary for retention and transfer of polarization [18]. For biological applications, after transfer of electron spin polarization to the nuclei of interest has occurred, the preparation must exist in solution, which can be achieved utilizing a dissolution process in which the solid sample is rapidly melted via injection of a hot solvent, typically a biologically compatible buffer, into the frozen sample [13]. The dissolution process results in a liquid sample at room temperature, while still preserving the enhanced polarization obtained by the microwave irradiation of the frozen sample [8]. Additionally, the use of chelating agents (e.g., EDTA) with the solvent to eliminate trace metals and more recently the use of gadolinium (Gd) chelates with the DNP sample have been used to further enhance and retain polarization in the liquid sample, albeit with caution over potential toxic effects when applied in vivo and the potential for loss of hyperpolarization due to T 1 shortening [11, 19, 20]. More in-depth exploration of the technical aspects of probe development has been previously reviewed [8, 11].

Considerations in probe selection and current research

The usefulness of a molecule for hyperpolarized MRS is dependent on the polarization lifetime of the nucleus of interest, and this property is determined by the spin-lattice relaxation constant (T1) [21]. Dipolar coupling, the magnetic field range, and molecular size can also affect the T1 of a given nucleus. In general, high magnetic fields and large molecular weights decrease the T1. Dipole-dipole coupling of 13C with 1H is common in biologically relevant molecules, and it shortens relaxation times; therefore, carbon atoms directly bound to 1H are generally not useful as probes for HP. For example, all carbons present in glucose (an important substrate in cancer cells) have relaxation times shorter than 2 s [22]. On the other hand, carbonyl carbons of biologically relevant molecules generally have T1’s above 20 s even at high magnetic fields like [1-13C] pyruvic acid, which has relaxation times of 67, 48, and 44 s at 3, 11.7, and 14.1 T, respectively [2325]. Even carbons that are less oxidized than carbonyls, like the hemi-ketal in [2-13C] fructose have T1’s one order of magnitude higher than glucose carbons. Short spin-lattice relaxation times can sometimes be increased by deuterium enrichment of the sample. With this technique, protons that are directly bound to carbons are exchanged for deuterium atoms which results in the reduction of dipole-dipole relaxation, further preserving the hyperpolarized state [26]. This has resulted in increased T1’s of 13C nuclei in molecules such as glucose (T1 increased from 2 s to 10–14 s), providing the possibility of utilizing them in future metabolic studies [2729]. Despite the effect of deuterium enrichment, research efforts have largely focused on developing carbonyl-bearing molecules as molecular imaging probes. The focus of this review is to introduce representative compounds relevant to metabolism that are characteristic of cancer tissue and have been applied in the work of multiple groups: aerobic glycolysis, glutamine addiction, and the redox state.

Pyruvate and aerobic glycolysis

Of particular interest to cancer metabolism is the increased conversion of glucose to lactate as a result of modulated aerobic glycolysis. This process, also known as the Warburg effect, is characteristic of many tumors with altered metabolism where pyruvate generated from glucose metabolism via glycolysis is preferentially converted to lactate by lactate dehydrogenase (LDH) as opposed to entering the tricarboxylic acid cycle [1]. With this phenotype, cancer cells show a preference for lactate fermentation even in the presence of oxygen, thus bypassing oxidative respiration for ATP generation. Because of this, pyruvate has been the preferred probe for HP MRS research since it is an intermediate metabolite in pathways characteristic of aberrant metabolism in cancer cells, including increased lactate production as a result of aerobic glycolysis where detection of HP pyruvate-derived lactate can be used as a marker for cancer and response to treatment [30, 31] as well as an intermediate in amino acid metabolism (e.g., interconversion to alanine via transamination with glutamate) (Fig. 1). In addition, as mentioned before, carbonyl carbons in pyruvate have long relaxation times where even the methyl carbon can have T1’s above 50 s after deuterium enrichment [32]. The interconversion of pyruvate to lactate has been exploited for MRI by using [1-13C] pyruvate and detecting the accumulation of increased lactate in cancerous tissue as compared to surrounding benign tissue. Increased conversion of pyruvate to lactate and alanine has been demonstrated to precede MYC-driven tumorigenesis by using HP [1-13C] pyruvate in murine models [33]. Furthermore, in the same study, a decrease in the flux of alanine was observed at the tumor stage while a decrease in lactate conversion was indicative of tumor regression [33]. In transgenic adenocarcinoma of mouse prostate (TRAMP) models, in vivo studies using HP [1-13C] pyruvate demonstrated that hyperpolarized pyruvate and its metabolic products can be used non-invasively and with high specificity to obtain a profile of the histologic grade of prostate cancers [34]. In vivo imaging following hyperpolarized pyruvate has also been used to evaluate the role of glutaminase and LDH in human lymphoma models [35] as well as to elucidate metabolism of pyruvate in breast cancer [36] and renal cell carcinoma with treatment [30, 37].
http://static-content.springer.com/image/art%3A10.1186%2Fs40170-015-0136-2/MediaObjects/40170_2015_136_Fig1_HTML.gif
Flux of hyperpolarized [1-13C] pyruvate to [1-13C] lactate in prostate regions. a MR image from patient with prostate cancer showing regions of cancerous tissue and surrounding normal tissue. bd Localized dynamic hyperpolarized [1-13C]pyruvate and [1-13C]lactate spectral from voxels overlapping the contralateral region of prostate (turquoise), a region of prostate cancer (yellow), and a vessel outside the prostate (green). Adapted with permission from ref. [43]

Early work that utilized HP pyruvate to assess the response of tumors to treatment was conducted in mice xenografted with EL-4 lymphoma cells and treated with etoposide, a topoisomerase inhibitor that causes rapid cell death [38, 39]. In this study, tumor necrosis was correlated to a decrease in the flux of hyperpolarized lactate which was suggested to be due to a decrease in NAD+ and NADH in the intracellular pool as well as loss of LDH function. More recently, HP [1-13C] pyruvate has been used as a biomarker to evaluate early response to radiation therapy in glioma tumors by observing a decrease in hyperpolarized lactate suggested to be a result of changes in tumor perfusion which can be detected between 24 and 96 h following treatment [40, 41]. HP [1-13C] pyruvate has also been used to detect early response to temozolomide (TMZ) treatment on human glioblastoma rat models [42]. The study successfully showed for the first time detection of response to TMZ therapy 1 day after TMZ administration. The continued reports on using HP pyruvate as an imaging probe for assessing treatment response indicate the potential of the compound to become a standard in the field. Moreover, these studies demonstrate the usefulness of HP [1-13C] pyruvate as a tool for early assessment of therapy response, which can improve treatment selection at the clinical level. Pyruvate has also been validated as a metabolic imaging marker for use in humans [43]. In a two-phase study, patients with biopsy-proven prostate cancer of various histological grades were injected with HP [1-13C] pyruvate. In the first phase, a maximum dose level was determined to establish pharmacological safety of the HP probe while still injecting enough pyruvate to allow visualization. This addressed one of the major challenges faced in translating HP MRI to clinical applications: the potential toxicity of compounds that must be injected into patients. In the second phase, metabolism of pyruvate was visualized in real time and differences in the ratio of [1-13C] lactate to [1-13C] pyruvate between identified cancerous regions and normal tissue regions were successfully observed (Fig. 1ad). [1-13C] lactate in regions that did not contain tumor was not detected, confirming previous biopsy and preclinical studies that demonstrated low flux of [1-13C] pyruvate to lactate and low concentrations of lactate in benign prostate tissues [44, 45]. Preliminary results indicated the possibility of detecting previously unobserved cancerous regions by HP [1-13C] pyruvate, later confirmed to be Gleason 4+3 cancer by biopsy, though further investigation into the relationship between grade and metabolism in prostate cancer patients is needed. While there are challenges associated with translation to clinical use for HP [1-13C] pyruvate, the first in human study demonstrated the feasibility of hyperpolarization technology as a safe diagnostic tool and provides the potential for utilizing this approach in preclinical models with direct translation to the clinic.

Glutamine metabolism

Glutamine is an amino acid that plays an important cellular role as nitrogen donor in the form of an amide group for purine and pyrimidine biosynthesis, leaving a glutamate molecule in the process although glutamine can also be converted to glutamate by glutaminase in a reaction independent of nucleotide biosynthesis. Glutamate is the primary nitrogen donor for the biosynthesis of non-essential amino acids. Transaminases catalyze the transfer of the amine group from glutamate to α-ketoacids to synthesize alanine, aspartate (precursor for asparagine), serine (precursor for glycine and cysteine), ornithine (precursor for arginine), and proline which is derived from the glutamate carbon backbone. Glutamine is considered a non-essential amino acid as it can be recycled from glutamate and ammonia in a reaction catalyzed by glutamine synthetase; however, some cancer cells show increase consumption of glutamine and are unable to grow in the absence of exogenous glutamine [46, 47]. This metabolic characteristic of cells to require exogenous glutamine for growth has been termed “glutamine addiction” and has generated extensive research interest as an indicator of development of cancerous tissues [48]. In particular to the field of HP MRI, the conversion rate of glutamine to glutamate (Fig. 2) was explored in hepatocellular carcinoma (HCC) using a [5-13C] glutamine probe (Fig. 2) [49]. Using the ratio between [5-13C] glutamine and [5-13C] glutamate, it was demonstrated that HCC cells convert glutamine at a higher rate than normal cells supporting the notion of glutamine addiction. One important aspect of this study was the choice of [5-13C] glutamine as a probe as opposed to [1-13C] glutamine, which has a longer T1 (16.1 vs. 24.6 s at 9.4 T) [49, 50]. [5-13C] glutamine was selected because the chemical shift change obtained from [1-13C] in glutamine and glutamate is far too small, which could prevent proper identification and quantification of the peaks. This highlights the importance of understanding not only the target compound to be hyperpolarized but also the metabolic products to be detected and their resulting spectra in MR. This is further emphasized with studies that demonstrate the usefulness of [1-13C] glutamine as a source for [1-13C] glutamate in order to follow the metabolism of α-ketoglutarate to observe the metabolic state of the TCA cycle in transformed cells [51]. Furthermore, [1-13C] α-ketoglutarate has been hyperpolarized and used to visualize other metabolic events involving [1-13C] glutamate such as mutations in IDH1 expression in glioma tumors and pathways dependent on hypoxia-inducible factor (HIF) [5153]. More recently, [5-13C] glutamine has been used to visualize the metabolism of liver cancer in vivo and in vitro, as well as the treatment response of prostate cancer cells in vitro [54]. Based on the promise of glutamine as a biomarker for cancer diagnosis and treatment response, extending the spin-lattice relaxation time of the [5-13C] glutamine has been researched and successfully accomplished. The facile synthesis of [5-13C-4-2H2] glutamine has been reported, and its study showed that by relying on the effect of deuterium enrichment to lessen dipolar coupling effects, the T1 of [5-13C] glutamine could be increased from approximately 15 to 30 s [55]. Visualization of real-time conversion of glutamine to glutamate in SF188 cells was achieved using this probe, demonstrating the promise of [5-13C-4-2H2] glutamine as a probe for molecular imaging of metabolic events in real time. Further investigation of this probe applied to in vivo preclinical models will lay the foundation for its clinical translational potential in the future.
http://static-content.springer.com/image/art%3A10.1186%2Fs40170-015-0136-2/MediaObjects/40170_2015_136_Fig2_HTML.gif
Metabolism of [5-13C] glutamine to [5-13C] glutamate. a Time-dependent spectral data following conversion of [5-13C] glutamine to [5-13C] glutamate. The signals are from 13C-enriched [5-13C]glutamate at 181.5 ppm and [5-13C]glutamine at 178.5 ppm and from natural abundance 13C label in [1-13C]glutamate at 175.2 ppm and [1-13C]glutamine at 174.7 ppm. b Plot of the ratio of the signal intensities of [5-13C]glutamate/[5-13C]glutamine showing the ratio in hepatoma cells (shaded circle), cell lysate (square), and control (triangle). These results demonstrated that hepatoma cancer cells convert glutamine to glutamine at a higher rate than normal cells. Adapted with permission from ref. [49]

Dehydroascorbate as a redox sensor

Reactive oxygen species (ROS) like the hydroxyl radical, superoxide, and hydrogen peroxide have been shown to cause DNA damage and can lead to mutations that transform normal cells into cancerous cells [56]. The reduction/oxidation (redox) state, which is dependent on the balance between oxidizing equivalents like ROS and reducing cofactors, can provide insight into the physiological condition of the cell with respect to potential cancer transformations. Furthermore, the presence of ROS in tissue has been implicated to be a factor in developing resistance to radiation therapies [57]. During oxidative stress (i.e., when there is an increase in ROS), redox homeostasis is maintained by the action of antioxidant compounds, such as ascorbate (or vitamin C, VitC), which can scavenge for ROS and reduce the compounds to rid the cells of damaging agents [58]. In this process, ascorbate that is available to cells in high concentrations can be oxidized to dehydroascorbate (DHA) while reducing ROS. DHA can then be transported into the cell where DHA is reduced back to ascorbate resulting in a process of recycling ascorbate and DHA (Fig. 3) [59]. In this sense, the ratio of DHA to ascorbate can be used as a molecular marker to investigate the redox state and thus the physiological state of tissues. Additionally, conversion of DHA to ascorbate can be enzymatically catalyzed in an NADPH-dependent manner or via oxidation of glutathione (GSH) to glutathione sulfide (GSSG); thus, visualization of ascorbate/DHA metabolism offers a method for probing in vivo metabolism of NADPH as well as determination of GSSG to GSH ratio, both of which have been implicated to be indicators of oxidative stress in the cells, particularly for neurodegenerative, cardiovascular, and cancer diseases [6062]. Hyperpolarized [1-13C] DHA was successfully used in murine models to detect increased reducing capacity in prostate cancer with the purpose of developing a non-invasive, early diagnostic tool for improving selection of treatment therapies [62, 63]. DHA demonstrates a relatively long T1 at clinically relevant field strengths (>50 s at 3 T) and adequate chemical shift separation between it and its metabolic product ascorbate (δ = 3.8 ppm). Increased reduction of HP [1-13C] DHA to ascorbate was observed in tumor tissue compared to normal tissue as well as other metabolic organs (Fig. 3). This was additionally demonstrated in lymphoma cells, further supporting the potential for using DHA as a probe in living systems [64]. A following study validated these results, and the correlation between increased DHA reduction and glutathione was established in vivo, thus showing the utility of [1-13C] DHA as a molecular imaging probe to detect events that go beyond the direct metabolism of DHA [63]. Notwithstanding the potential of HP DHA as a diagnostic probe, the toxicity of DHA remains to be validated. Earlier studies on mammalian cells showed DHA toxicity starting at 10 mM, while a study carried on rats demonstrated neurological effects of DHA starting at injections of 50 mg/kg [65, 66]. However, as outlined above, successful use of DHA injections in rats and mice for hyperpolarization has been demonstrated without reported side effects on the animals. More research is needed to determine the parameters regarding the toxicity of DHA in larger animal models using pure formulations to assess its potential for clinical trials. Further work in DHA could demonstrate its applicability for the study of ROS and redox changes in model systems.
http://static-content.springer.com/image/art%3A10.1186%2Fs40170-015-0136-2/MediaObjects/40170_2015_136_Fig3_HTML.gif
Determination of redox state by imaging of HP [1-13C] ascorbate (VitC) and [1-13C] dehydroascorbate (DHA). Oxidative stress caused by ROS (1.) can be alleviated by oxidation of ascorbate to DHA (2.), and recycling of DHA to ascorbate can occur indirectly with oxidation of glutathione (3.) or directly with oxidation of NADH (4.). The ratio of [ascorbate] to [DHA] has been successfully used in mice models as a biomarker to determine pH in vivo. Adapted with permission from ref. [62]

Other metabolic imaging probes

While the three probes discussed earlier are the most well studied in metabolic events that are characteristic of cancer cells in general, other molecules have been evaluated in their potential to be used as biomarkers. Hyperpolarized bicarbonate (H13CO3) has been successfully used to determine the pH in extracellular matrix of lymphoma tumors in mice, and a correlation between acidic environments and cancer was established [67]. The relaxation times for bicarbonate compounds at 3 T are between 34 and 50 s, which is enough time to detect the rapid conversion of H13CO3 and 13CO2 catalyzed by carbonic anhydrase [23]. The attractive feature of this probe is based on how ubiquitous acidic extracellular environments are to a wide variety of diseases; thus, HP bicarbonate has the potential for clinical translation beyond cancer research, though extensive work will be necessary to generate a preparation which will result in an adequate dose for the clinic [68, 69]. More recently, the potential of α-ketoisocaproate (KIC) as a molecular probe for in vivo detection of branched chain amino acid transaminase (BCAT) has been explored. BCAT catalyzes the conversion of KIC to leucine, and its expression has been suggested to correlate to genetic characterization of certain tumors. In a pilot study, HP α-keto-[1-13C]-isocaproate was shown to have a T1 of 100 s so its metabolism can be sensitively traced for over a minute after injection [70]. In the same study, metabolism of HP [1-13C] KIC to [1-13C] leucine by BCAT was observed in murine lymphoma tumor tissue but was absent in rat mammary adenocarcinoma with a correlation between BCAT expression and [1-13C] leucine signal detection [70]. Additionally, in the same models, [1-13C] pyruvate conversion to [1-13C] lactate and [1-13C] alanine was detected in both types of tumors. These findings show the promise of using [1-13C] KIC as a discriminative probe in addition to pyruvate in order to diagnose different types of cancer [71, 72]. Furthermore, the correlation between BCAT expression and [1-13C] leucine detection was also shown in rat brain tissue, confirming the usefulness of HP [1-13C] KIC in assessing BCAT activity in vivo [73]. Choline is another compound that has been evaluated as a molecular imaging probe since elevated choline and choline-derived metabolites have been correlated by 1H-MRS imaging to cancer in the brain, breast, colon, cervix, and prostate [7476]. Despite its potential as a global marker for cancer because of the long T1 relaxation times that can be achieved with deuterium and 15N enrichment [77, 78], HP applications of 13C enriched choline are limited due to the small change in chemical shifts of choline and choline-derived metabolites as well as its potential toxicity [16, 79, 80]. It has been shown that choline toxicity occurs at doses of 53 mg/kg in mice, although a recent study successfully detected HP 13C choline in vivo without adverse effects in rats at doses of 50 mg/kg by using atropine to prevent cholinergic intoxication [81, 82] though metabolic products have been difficult to visualize in vivo. As mentioned earlier, the usefulness of glucose as a probe is limited due to the short relaxation times of all the carbons present in the molecule and although the T1’s can be increased through deuterium enrichment, the lifetime of the probe remains a hurdle for clinical applications [27, 28]. Thus, fructose (a pentose analog of glucose) has been successfully used as an alternative to probe glycolytic pathways [83] in TRAMP models where differences in HP [2-13C] fructose uptake and metabolism was visualized in tumor regions compared to surrounding normal tissues. Like choline, the limiting factor in the usefulness of [2-13C] fructose for in vivo studies is in small chemical shifts between the metabolite and its phosphorylated product. Finally, tumor necrosis can be used as a measure of treatment response, particularly early necrosis. HP [1,4-,13C] malate has been visualized in lymphoma mice models after injection of HP [1,4-13C] fumarate [84]. In normal cells, fumarate has a slow rate of transport into the mitochondria; however, in necrotic cells where the mitochondrial membrane is degraded, fumarase has access to the HP fumarate and its ubiquitous cofactor, water, thus facilitating rapid conversion to malate. Preliminary studies have shown the potential for its use in animal models though further work is required to determine the necessary density of necrotic cells for detection and the timings required for adequate visualization in patients.

Conclusions

The application of hyperpolarized 13C imaging has been extensively investigated in preclinical models, and the successful demonstration of HP [1-13C] pyruvate in patients with prostate cancer has validated the potential of HP MRI as a safe diagnostic and treatment assessment tool. Application of other probes beyond pyruvate is still in its infancy, particularly because of the need to further study the currently developed models under conditions that are relevant to a clinical setting (i.e., lower magnetic fields) as well as to study the necessary parameters (probe toxicity dose limits, safety limits for rapid injection) to withstand the necessary hurdles to translation. Nevertheless, these vast research findings are promising and indicate an eventual translation to humans. Furthermore, there is a large variety of biologically relevant molecules that have the potential to be hyperpolarized (Fig. 4), and molecular imaging of metabolic events in real time using not only one single probe but a combination of relevant probes could become an invaluable tool in elucidating so far undiscovered metabolic and proteomic interactions that play a role in cancer development and treatment. This gives HP MRI the great potential to revolutionize current molecular imaging technologies.
http://static-content.springer.com/image/art%3A10.1186%2Fs40170-015-0136-2/MediaObjects/40170_2015_136_Fig4_HTML.gif
Metabolic pathways with compounds that can be used as molecular imaging probes for HP MRI. A wide variety of metabolic pathways have already been visualized or have the potential to be visualized using hyperpolarization technology that can be applied to different pathological states of the cell including cardiovascular disease and a large variety of cancers. 1. Metabolism of C1 (red dots) in pyruvate. Theasterisks on selected compounds represent enrichment of 13C in the second pass of pyruvate in TCA cycle. 2. Metabolism of C1 (brown dots) in DHA using a pool of NADPH derived from the pentose phosphate pathway. 3. Metabolism of C1 (blue dots) and C5 (green dots) of glutamine. 4. Metabolism of C1 and C4 (purple dots) of fumarate unrelated to TCA metabolites. 5. Metabolism of extracellular bicarbonate (gray dots). MTC1 monocarboxylate transporter 1, MTC4 monocarboxylate transporter 4,System ASC amino acid transporter, GLUTs glucose transporters, DCT dicarboxylate transporter, DHARdehydroascorbate reductase, GR glutathione reductase, GSH glutathione, GSSG glutathione disulfide,LDH lactate dehydrogenase, ALT alanine transaminase, CA carbonic anhydrase, PC pyruvate carboxylase,PDH pyruvate dehydrogenase, CS citrate synthase, GLS glutaminase, GLDH glutamate dehydrogenase,IDH isocitrate dehydrogenase, OGDC oxoglutarate dehydrogenase complex, SCS succinyl CoA synthetase, SQR succinate dehydrogenase, FH fumarate hydratase, MDH malate dehydrogenase, FUMfumarase. Cofactors have been omitted for brevity

Abbreviations

ALT:   alanine transaminase;   BCAT:  branched chain amino acid transaminase;   DHA:  dehydroascorbate;   DNP:  dynamic nuclear polarization;   EDTA:  ethylenediaminetetraacetic acid;   GSH:  glutathione;   GSSG:   glutathione sulfide;   HCC:  hepatocellular carcinoma;   HIF:  hypoxia-inducible factor;   HP:  hyperpolarized/hyperpolarization;   IDH:  isocitrate dehydrogenase;   KIC:  ketoisocaproate;   LDH:  lactate dehydrogenase;   MR: magnetic resonance;   MRI:  Magnetic resonance imaging;   MRS:  magnetic resonance spectroscopy;   NAD(H):  nicotinamide adenine dinucleotide;   NADP(H):  nicotinamide adenine dinucleotide phosphate;   PET:  positron emission tomography;   ROS:  reactive oxygen species;   SPECT:  single-photon emission computed tomography;   TRAMP:  transgenic adenocarcinoma of mouse prostate

References

  1. Warburg O. On the origin of cancer cells. Science. 1956;123:309–14.View ArticlePubMed
  2. Gatenby RA, Gillies RJ. Why do cancers have high aerobic glycolysis? Nat Rev Cancer. 2004;4(11):891–9.View ArticlePubMed
  3. Vander Heiden MG, Cantley LC, Thompson CB. Understanding the Warburg effect: the metabolic requirements of cell proliferation. Science. 2009;324:1029–33.View ArticlePubMed CentralPubMed
  4. Shie P, Cardarelli R, Brandon D, Erdman W, AbdulRahim N. Meta-analysis: comparison of F-18 fluorodeoxyglucose-positron emission tomography and bone scintigraphy in the detection of bone metastases in patients with breast cancer. Clin Nucl Med. 2008;33:97–101.View ArticlePubMed
  5. Frangioni JV. New technologies for human cancer imaging. J Clin Oncol. 2008;26:4012–21.View ArticlePubMed CentralPubMed
  6. Castillo M, Kwock L, Mukherji SK. Clinical applications of proton MR spectroscopy. Am J Neuroradiol. 1996;17:1–16.PubMed
  7. Barker PB, Bizzi A, De Stefano N, Gullapalli R, Lin DD. Clinical MR spectroscopy: techniques and applications. Cambridge University Press; 2009.
  8. Comment A, Merritt ME. Hyperpolarized magnetic resonance as a sensitive detector of metabolic function. Biochemistry. 2014;53:7333–57.View ArticlePubMed
  9. Rider OJ, Tyler DJ. Clinical implications of cardiac hyperpolarized magnetic resonance imaging. J Cardiov Magn Reson. 2013;15:93.View Article
  10. Golman K, Olsson LE, Axelsson O, Månsson S, Karlsson M, Petersson JS. Molecular imaging using hyperpolarized 13C. Br J Radiol. 2003;76 Suppl 2:S118–S27.View ArticlePubMed

….. more

sjwilliamspa commented on Is the Warburg effect an effect of deregulated space occupancy of methylome?

Is the Warburg effect an effect of deregulated space occupancy of methylome? Larry H. Bernstein and Radoslav Bozov, …

It would be an interesting figure, although I am not sure anyone has been able to measure it, is the spatial distribution of lactate and pyruvate over the tumor as a function of diffusion distance such as a heat map to see if pyruvate and lactate levels have a gradiant over a solid tumor. I am not sure it would but interesting to see where tumor cells, which undergo Warburg type metabolic phenotype actually exist, if it is a function of angiogenesis or a function of the proliferative capacity of cells in situ.

Response by LHB…

Radoslav Bozov has repeatedly referred to the real problem of space/time in the required experimental view that is intractable, as seen by Erwin Schroedinger.  It is confounded by
the restrictions imposed by research, and to an extent also the dilemma of location and velocity.

I think it is to an extent also inherent in the modern revelations of autophagy and apoptosis that were not part of the view in the mid 20th century.  However, the work of B. Chance led to a substantially better understanding of the hydride transfer in the NAD/NADH.  What is overlooked is the important role cited by NO Kaplan of NADPH/NADP vs NADH/NAD associated with synthetic and, alternatively, catabolic processes in the cell. What role the pyridine nucleotide transhydrogenase would play is anyones guess.   In any case the proliferation of malignant cells is dependent on NADPH.  This would limit the NAD/NADH related reactions. The effect in the cytoplasm is PYR –> LAC, with generation of NAD from NADH.  In addition, the type of isoenzyme favored should be consequential.  For instance, the M-type LDH does not form an abortive ternary complex LDH*NAD+*PYR. In addition, Bernstein, Everse and Grisham showed that in cancer there is an aberrant cytoplasmic MDH.

Read Full Post »

« Newer Posts - Older Posts »