Neutrophil Serine Proteases in Disease and Therapeutic Considerations
Larry H. Bernstein, MD, FCAP, Curator
LPBI
| SERPINB1 Regulates the activity of the neutrophil proteases elastase, cathepsin G, proteinase-3, chymase, chymotrypsin, and kallikrein-3. Belongs to the serpin family. Ov-serpin subfamily. Note: This description may include information from UniProtKB. |
|||||||||||
| Chromosomal Location of Human Ortholog: 6p25 | |||||||||||
| Cellular Component: extracellular space; membrane; cytoplasm | |||||||||||
| Molecular Function: serine-type endopeptidase inhibitor activity | |||||||||||
| Reference #: P30740 (UniProtKB) | |||||||||||
| Alt. Names/Synonyms: anti-elastase; EI; ELANH2; ILEU; LEI; Leukocyte elastase inhibitor; M/NEI; MNEI; Monocyte/neutrophil elastase inhibitor; Peptidase inhibitor 2; PI-2; PI2; protease inhibitor 2 (anti-elastase), monocyte/neutrophil derived; serine (or cysteine) proteinase inhibitor, clade B (ovalbumin), member 1; Serpin B1; serpin peptidase inhibitor, clade B (ovalbumin), member 1; SERPINB1 | |||||||||||
| Gene Symbols: SERPINB1 | |||||||||||
| Molecular weight: 42,742 Da | |||||||||||
|
SERPIN PEPTIDASE INHIBITOR, CLADE B (OVALBUMIN), MEMBER 1; SERPINB1 |
|||||||||||
| Alternative titles; symbols | |||||||||||
| PROTEASE INHIBITOR 2, MONOCYTE/NEUTROPHIL DERIVED; ELANH2 ELASTASE INHIBITOR, MONOCYTE/NEUTROPHIL; EI |
|||||||||||
| HGNC Approved Gene Symbol: SERPINB1 | |||||||||||
| Cloning and Expression | |||||||||||
| Monocyte/neutrophil elastase inhibitor (EI) is a protein of approximately 42,000 Mr with serpin-like functional properties. Remold-O’Donnell et al. (1992) cloned EI cDNA and identified 3 EI mRNA species of 1.5, 1.9, and 2.6 kb in monocyte-like cells and no hybridizing mRNA in lymphoblastoid cells lacking detectable EI enzymatic activity. The cDNA open reading frame encoded a 379-amino acid protein. Its sequence established EI as a member of the serpin superfamily. Sequence alignment indicated that the reactive center P1 residue is cys-344, consistent with abrogation of elastase inhibitory activity by iodoacetamide and making EI a naturally occurring cys-serpin. |
|||||||||||
|
Mapping |
|||||||||||
| In the course of studying 4 closely linked genes encoding members of the ovalbumin family of serine proteinase inhibitors (Ov-serpins) located on 18q21.3, Schneider et al. (1995) investigated the mapping of elastase inhibitor. They prepared PCR primer sets of the gene, and by using the NIGMS monochromosomal somatic cell hybrid panel, showed that the EI gene maps to chromosome 6. By amplifying DNA of a somatic cell hybrid panel, Evans et al. (1995) unambiguously localized ELANH2 to chromosome 6. |
|||||||||||
| http://www.phosphosite.org/getImageAction.do?id=27292293
|
|||||||||||
| REFERENCES | |||||||||||
|
|||||||||||
The neutrophil serine protease inhibitor SerpinB1 protects against inflammatory lung injury and morbidity in influenza virus infection
Dapeng Gong1,2, Charaf Benarafa1,2, Kevan L Hartshorn3 and Eileen Remold-O’Donnell1,2
J Immunol April 2009; 182(Meeting Abstract Supplement) 43.10
http://www.jimmunol.org/cgi/content/meeting_abstract/182/1_MeetingAbstracts/43.10
SerpinB1 is an efficient inhibitor of neutrophil serine proteases. SerpinB1-/- mice fail to clear bacterial lung infection with increased inflammation and neutrophil death. Here, we investigated the role of serpinB1 in influenza virus infection, where infiltrating neutrophils and monocytes facilitate virus clearance but can also cause tissue injury. Influenza virus (H3N2 A/Phil/82) infection caused greater and more protracted body weight loss in serpinB1-/- vs. WT mice (20% vs. 15%; nadir on day 4 vs. day 3). Increased morbidity was not associated with defective virus clearance. Cytokines (IFN, TNF, IL-17, IFN, G-CSF) and chemokines (MIP-1, KC, MIP-2) were increased in serpinB1-/- mice vs. WT on days 2-7 post-infection but not on day 1. In WT mice, histology indicated large infiltration of neutrophils peaking on day 1 and maximal airway injury on day 2 that resolved on day 3 coincident with the influx of monocytes/macrophages. In serpinB1-/- mice, neutrophils also peaked on day 1; epithelial injury was severe and sustained with accumulation of dead cells on day 2 and 3. Immunophenotyping of lung digests on day 2 and 3 showed delayed recruitment of monocytes, macrophages and DC in serpinB1-/- mice, but increase of activated CD4 (day 2-3) and CD8 (day 3) T cells. Our findings demonstrate that serpinB1 protects against morbidity and inflammatory lung injury associated with influenza infection.
The neutrophil serine protease inhibitor serpinb1 preserves lung defense functions in Pseudomonas aeruginosainfection
Charaf Benarafa 1 , 2 , Gregory P. Priebe 3 , 4 , and Eileen Remold-O’Donnell 1 , 2
JEM July 30, 2007; 204(8): 1901-1909 http://dx.doi.org:/10.1084/jem.20070494
Neutrophil serine proteases (NSPs; elastase, cathepsin G, and proteinase-3) directly kill invading microbes. However, excess NSPs in the lungs play a central role in the pathology of inflammatory pulmonary disease. We show that serpinb1, an efficient inhibitor of the three NSPs, preserves cell and molecular components responsible for host defense against Pseudomonas aeruginosa. On infection, wild-type (WT) and serpinb1-deficient mice mount similar early responses, including robust production of cytokines and chemokines, recruitment of neutrophils, and initial containment of bacteria. However, serpinb1−/− mice have considerably increased mortality relative to WT mice in association with late-onset failed bacterial clearance. We found that serpinb1-deficient neutrophils recruited to the lungs have an intrinsic defect in survival accompanied by release of neutrophil protease activity, sustained inflammatory cytokine production, and proteolysis of the collectin surfactant protein–D (SP-D). Coadministration of recombinant SERPINB1 with the P. aeruginosa inoculum normalized bacterial clearance inserpinb1−/− mice. Thus, regulation of pulmonary innate immunity by serpinb1 is nonredundant and is required to protect two key components, the neutrophil and SP-D, from NSP damage during the host response to infection.
Neutrophils are the first and most abundant phagocytes mobilized to clear pathogenic bacteria during acute lung infection. Prominent among their antimicrobial weapons, neutrophils carry high concentrations of a unique set of serine proteases in their granules, including neu trophil elastase (NE), cathepsin G (CG), and proteinase-3. These neutrophil serine proteases (NSPs) are required to kill phagocytosed bacteria and fungi (1, 2). Indeed, neutrophils lacking NE fail to kill phagocytosed pathogens, and mice deficient for NE and/or CG have increased mortality after infection with pulmonary pathogens (3, 4). However, NSPs in the lung airspace can have a detrimental effect in severe inflammatory lung disease through degradation of host defense and matrix proteins (5–7). Thus, understanding of the mechanisms that regulate NSP actions during lung infections associated with neutrophilia will help identify strategies to balance host defense and prevent infection-induced tissue injury.
SERPINB1, also known as monocyte NE inhibitor (8), is an ancestral serpin super-family protein and one of the most efficient inhibitors of NE, CG, and proteinase-3 (9, 10). SERPINB1 is broadly expressed and is at particularly high levels in the cytoplasm of neutrophils (11, 12). SERPINB1 has been found complexed to neutro phil proteases in lung fluids of cystic fibrosis patients and in a baboon model of bronchopulmonary dysplasia (13, 14). Although these studies suggest a role for SERPINB1 in regulating NSP activity, it is unclear whether these complexes reflect an important physiological role for SERPINB1 in the lung air space.
RESULTS
To define the physiological importance of SERPINB1 in shaping the outcome of bacterial lung infection, we generated mice deficient for serpinb1 (serpinb1−/−) by targeted mutagenesis in embryonic stem (ES) cells (Fig. 1, A–C). Crossings of heterozygous mice produced WT (+/+), heterozygous (+/−), and KO (−/−) mice for serpinb1 at expected Mendelian ratios (25% +/+, 51% +/−, and 24% −/−; n = 225; Fig. 1 D), indicating no embryonic lethality. Bone marrow neutrophils of serpinb1−/− mice lacked expression of the protein, whereas heterozygous serpinb1+/− mice had reduced levels compared with WT mice (Fig. 1 E). Importantly, levels of the cognate neutrophil proteases NE and CG, measured as antigenic units, were not altered by deletion of serpinb1 (Fig. 1 F). When maintained in a specific pathogen-free environment, serpinb1−/− mice did not differ from WT littermates in growth, litter size, or life span (followed up to 12 mo), and no gross or histopathological defects were observed at necropsy in 8-wk-old mice.
6–8-wk-old animals were intranasally inoculated with the nonmucoid Pseudomonas aeruginosa strain PAO1. Using two infection doses (3 × 10⁶ and 7 × 10⁶ CFU/mouse),serpinb1−/− mice had a significantly lower survival probability and a shorter median survival time compared with WT mice (Fig. 2 A). Further groups of infected mice were used to evaluate bacterial clearance. At 6 h after infection, the bacteria were similarly restricted in mice of the two genotypes, suggesting that the serpinb1−/− mice have a normal initial response to infection. At 24 h, the median bacterial count in the lungs of serpinb1−/− mice was five logs higher than that of the WT mice (P < 0.001), and the infection had spread systemically in serpinb1−/− mice but not in WT mice, as shown by high median CFU counts in the spleen (Fig. 2 B). Histological examination at 24 h after infection revealed abundant neutrophil infiltration in the lungs of both WT and serpinb1−/− mice, and consistent with the bacteriological findings, numerous foci of bacterial colonies and large areas of alveolar exudates were found in serpinb1−/− mice only (Fig. 2 C). When challenged with the mucoid P. aeruginosa clinical strain PA M57-15 isolated from a cystic fibrosis patient, WT mice cleared >99.9% of the inoculum within 24 h, whereas serpinb1-deficient mice failed to clear the infection (Fig. 2 D). Thus, the NSP inhibitor serpinb1 is essential for maximal protection against pneumonia induced by mucoid and nonmucoid strains of P. aeruginosa.
Figure 2.
Serpinb1−/− mice fail to clear P. aeruginosalung infection. (A) Kaplan-Meier survival curves of WT (+/+) and serpinb1-deficient (−/−) mice intranasally inoculated with nonmucoid P. aeruginosa strain PAO1. Increased mortality of serpinb1−/− mice was statistically significant (P = 0.03 at 3 × 10⁶CFU/mouse; P < 0.0001 at 7 × 10⁶CFU/mouse). (B) CFUs per milligram of lung (left) and splenic (right) tissue determined 6 and 24 h after inoculation with 3 × 10⁶ CFUP. aeruginosa PAO1 in WT (+/+, filled circles) and serpinb1−/− (−/−, open circles) mice. Each symbol represents a value for an individual mouse. Differences between median values (horizontal lines) were analyzed by the Mann-Whitney U test. Data below the limit of detection (dotted line) are plotted as 0.5 CFU × dilution factor. (C) Lung sections stained with hematoxylin and eosin show bacterial colonies (arrowheads) and alveolar exudate in lungs of serpinb1−/− mice 24 h after infection with P. aeruginosa PAO1. Bars, 50 μm. (D) Total CFUs in the lung and spleen 24 h after inoculation with 2 × 10⁸ CFU of the mucoid P. aeruginosa strain PA M57-15 in WT (+/+, filled circles) and serpinb1−/− (−/−, open circles) mice. Differences between median values (horizontal lines) were analyzed by the Mann-Whitney U test.
To verify specificity of the gene deletion, we tested whether delivering rSERPINB1 would correct the defective phenotype. Indeed, intranasal instillation of rSERPINB1 to serpinb1−/− mice at the time of inoculation significantly improved clearance of P. aeruginosa PAO1 from the lungs assessed at 24 h and reduced bacteremia compared with infectedserpinb1−/− mice that received PBS instead of the recombinant protein (Fig. S1 A, available at http://www.jem.org/cgi/content/full/jem.20070494/DC1). We have previously demonstrated that rSERPINB1 has no effect on the growth of P. aeruginosa in vitro (15) and does not induce bacterial aggrega tion (16). Also, rSERPINB1 mixed with PAO1 had no effect on adherence of the bacteria to human bronchial epithelial and corneal epithelial cell lines (unpublished data). Therefore, the improved bacterial clearance in treated serpinb1−/− mice is not related to a direct antibacterial role for rSERPINB1 but rather to reducing injury induced by excess neutrophil proteases. In addition, previous in vivo studies in WT rats showed that rSERPINB1 can protect against elastase-induced lung injury (17) and accelerate bacterial clearance two- to threefold in the Pseudomonas agar bead model (15).
Evidence of excess NSP action was examined in the lungs of infected serpinb1−/− mice by measuring surfactant protein–D (SP-D). SP-D, a multimeric collagenous C-type lectin produced by alveolar epithelial cells, is highly relevant as a host defense molecule, because it functions as an opsonin in microbial clearance (18) and acts on alveolar macrophages to regulate pro- and antiinflammatory cytokine production (19). SP-D is also relevant as an NSP target because it is degraded in vitro by trace levels of each of the NSPs (16, 20). SP-D levels in lung homogenates of WT and serpinb1−/− mice were similar 6 h after P. aeruginosa infection. At 24 h, SP-D levels were reduced in the lungs ofserpinb1−/− mice compared with WT mice, as indicated by immunoblots. A lower molecular mass band indicative of proteolytic degradation is also apparent (Fig. 3 A). Densitometry analysis of the 43-kD SP-D band relative to β-actin indicated that the reduction of SP-D level was statistically significant (+/+, 45 ± 6 [n = 8]; −/−, 10 ± 2 [n = 8]; P < 0.0001 according to the Student’s t test). Furthermore, rSERPINB1 treatment ofP. aeruginosa–infected serpinb1−/− mice partly prevented the degradation of SP-D in lung homogenates compared with nontreated mice (Fig. S1 B). As a further test of the impact of serpinb1 deletion on NSP activity, isolated neutrophils of serpinb1−/− mice were treated with LPS and FMLP and tested for their ability to cleave recombinant rat SP-D (rrSP-D) in vitro. The extent of rrSP-D cleavage by serpinb1−/− neutrophils was fourfold greater than by WT neutrophils, as determined by densitometry. The cleavage was specific for NSPs because it was abrogated by rSERPINB1 and diisopropyl fluorophosphate (Fig. 3 B). Collectively, these findings indicate a direct role for serpinb1 in regulating NSP activity released by neutrophils and in preserving SP-D, an important-host defense molecule.
Efficient clearance of P. aeruginosa infection requires an early cytokine and chemokine response coordinated by both resident alveolar macrophages and lung parenchymal cells (21, 22). The IL-8 homologue keratinocyte-derived chemokine (KC) and the cytokines TNF-α, IL-1β, and G-CSF were measured in cell-free bronchoalveolar (BAL) samples. Although the tested cytokines were undetectable in sham-infected mice of both genotypes (unpublished data), comparable induc tion of these cytokines was observed in BAL of WT and serpinb1−/− mice at 6 h after infection, demonstrating that there is no early defect in cytokine production in serpinb1−/− mice. At 24 h, levels of TNF-α, KC, and IL-1β were sustained or increased in serpinb1−/− mice and significantly higher than cytokine levels in WT mice. G-CSF levels at 24 h were elevated to a similar extent in BAL of WT and KO mice (Fig. 3 C). However, G-CSF levels were significantly higher in the serum of serpinb1−/− mice (WT, 336 ± 80 ng/ml; KO, 601 ± 13 ng/ml; n = 6 of each genotype; P < 0.01). In addition, serpinb1−/− mice that were treated at the time of infection with rSERPINB1 had cytokine levels in 24-h lung homogenates that were indistinguishable from those of infected WT mice (Fig. S1 C). The increased cytokine production in the lungs of infected serpinb1−/− mice may be caused by failed bacterial clearance but also by excess NSPs, which directly induce cytokine and neutrophil chemokine production in pulmonary parenchymal cells and alveolar macrophages (23, 24).
Neutrophil recruitment to the lungs was next examined as a pivotal event of the response to P. aeruginosa infection (25). Lung homogenates were assayed for the neutrophil-specific enzyme myeloperoxidase (MPO) to quantify marginating, interstitial, and alveolar neutrophils. Neutrophils in BAL fluid were directly counted as a measure of neutrophil accumulation in the alveolar and airway lumen. MPO in lung homo genates was undetectable in uninfected mice and was comparably increased in mice of both genotypes at 6 h, suggesting normal early serpinb1−/− neutrophil margination and migration into the interstitium. However, by 24 h after infection, MPO levels in lung homogenates remained high in WT mice but were significantly decreased in serpinb1−/− mice (Fig. 4 A). Importantly, the content of MPO per cell was the same for isolated neutrophils of WT andserpinb1−/− mice (+/+, 369 ± 33 mU/106 cells; −/−, 396 ± 27 mU/106 cells). The numbers of neutrophils in BAL were negligible in uninfected mice and were similarly increased in WT and serpinb1−/− mice at 6 h after infection. Neutrophil counts in BAL further increased at 24 h, but the mean BAL neutrophil numbers were significantly lower in serpinb1−/− mice compared with WT mice (Fig. 4 B). The evidence from the 6-h quantitation of MPO in homogenates and neutrophils in BAL strongly suggests that neutrophil recruitment is not defective in infected serpinb1−/− mice. Moreover, the high levels of cytokines and neutrophil chemoattractant KC in serpinb1−/− mice at 24 h (Fig. 3 C) also suggest that, potentially, more neutrophils should be recruited. Therefore, to examine neutrophil recruitment in serpinb1−/− mice, we used a noninfectious model in which neutrophils are mobilized to migrate to the lung after intranasal delivery of P. aeruginosa LPS. MPO levels in lung homogenate and neutrophil numbers in BAL were not statistically different in WT and serpinb1−/− mice 24 h after LPS instillation (Fig. 4, C and D). Furthermore, the number of circulating blood neutrophils and recruited peritoneal neutrophils after injection of sterile irritants glycogen and thioglycollate did not differ in WT and serpinb1−/− mice (unpublished data). Alveolar macrophage numbers were similar in uninfected mice of both genotypes (∼5 × 10⁵ cells/mouse) and did not substantially change upon infection. Collectively, these findings show that neutrophil recruitment to the lungs in response to P. aeruginosa infection is not defective in serpinb1−/− mice, and therefore, the recovery of lower numbers of serpinb1−/− neutrophils at 24 h after infection suggests their decreased survival.
To examine the putative increased death of serpinb1−/− neutrophils in the lungs after P. aeruginosa infection, lung sections were analyzed by immunohistochemistry. Caspase-3–positive leukocytes were more relevant in the alveolar space of serpinb1−/− mice compared with WT mice at 24 h after infection, suggesting increased neutrophil apoptosis (Fig. 5 A). The positive cells were counted in 50 high power fields (hpf’s), and mean numbers of caspase-3–stained cells were increased in the lungs of serpinb1−/− mice (1.8 ± 0.2 cells/hpf) compared with WT mice (0.4 ± 0.1 cells/hpf; P < 0.0001). To characterize neutrophils in the alveoli and airways, neutrophils in BAL were identified in flow cytometry by forward scatter (FSC) and side scatter and were stained with annexin V (AnV) and propidium iodide (PI). At 24 h after infection, the proportion of late apoptotic/necrotic neutrophils (AnV+PI+) was increased at the expense of viable neutrophils (AnV−PI−) in the BAL of serpinb1−/− mice compared with WT mice (Fig. 5 B). Neutrophil fragments in BAL were also identified in flow cytometry by low FSC (FSClow) within the neutrophil population defined by the neutrophil marker Gr-1. The number of neutrophil fragments (FSClow, Gr-1+) relative to intact neutrophils was increased two- to threefold at 24 h after infection for serpinb1−/− compared with WT mice (Fig. 5 C). Moreover, free MPO in BAL supernatants was increased in serpinb1−/− mice compared with WT mice at 24 h after infection, indicating increased PMN lysis or degranulation (Fig. 5 D).
Finally, we questioned whether the enhanced death of serpinb1−/− pulmonary neutrophils was a primary effect of gene deletion or a secondary effect caused by, for example, bacteria or components of inflammation. To address this, neutrophils were collected using the noninfectious LPS recruitment model and were cultured in vitro to allow for spontaneous cell death. After 24 h, the percentages of apoptotic and necrotic neutrophils evaluated by microscopy were increased in serpinb1−/− neutrophils compared with WT neutrophils (Fig. 6, A–C). A similar increase in apoptotic cells was observed using AnV/PI staining and measurements of hypodiploid DNA (unpublished data). Moreover, live cell numbers from serpinb1−/− mice remaining in culture after 24 h were significantly decreased compared with WT mice (Fig. 6 D). The in vitro findings indicate that enhanced death of pulmonary neutrophils of infected serpinb1−/− mice is at least in part a cell-autonomous defect likely mediated by unchecked NSP actions.
In this paper, we have demonstrated that serpinb1, an intracellular serpin family member, regulates the innate immune response and protects the host during lung bacterial infection. Serpinb1 is among the most potent inhibitors of NSPs and is carried at high levels within neutrophils. Serpinb1-deficient mice fail to clear P. aeruginosa PAO1 lung infection and succumb from systemic bacterial spreading. The defective immune function in serpinb1−/− mice stems at least in part from an increased rate of neutrophil necrosis, reducing the number of phagocytes and leading to increased NSP activity in the lungs with proteolysis of SP-D. In addition, serpinb1-deficient mice also have impaired clearance of the mucoid clinical strain PA M57-15. Interestingly, mucoid strains of P. aeruginosa are cleared with a very high efficiency from the lungs of WT and cystic fibrosis transmembrane conductance regulator–deficient mice (26). The phenotype of serpinb1−/− mice reproduces major pathologic features of human pulmonary diseases characterized by excessive inflammation, massive neutrophil recruitment to the air space, and destruction of cellular and molecular protective mechanisms. Importantly, serpinb1 deficiency may be helpful as an alternative or additional model of the inflammatory lung pathology of cystic fibrosis.
The present study documents a key protective role for serpinb1 in regulating NSP actions in the lung. This role has previously been attributed to the NSP inhibitors α1-antitrypsin and secretory leukocyte protease inhibitor, which are found in the airway and alveolar lining fluid (27, 28). However, patients with α1-antitrypsin deficiency do not present with pulmonary infection secondary to innate immune defects despite increased NSP activity that leads to reduced lung elasticity and emphysema. Moreover, there is so far no evidence that deficiency in secretory leukocyte protease inhibitor results in failure to clear pulmonary infection. Because synthesis and storage of NSPs in granules is an event that exclusively takes place in bone marrow promyelocytes (29), the regulation of NSPs in the lung relies entirely on NSP inhibitors. Thus, the extent of the innate immune defect inserpinb1−/− mice and the normalization of bacterial clearance with topical rSERPINB1 treatment indicate that serpinb1 is required to regulate NSP activity in the airway fluids and that, during acute lung infection associated with high neutrophilic recruitment, there is insufficient compensation by other NSP inhibitors. The devastating effects of NSPs when released in the lungs by degranulating and necrotic neutrophils are well documented in human pulmonary diseases (5, 6, 30). Therefore, our findings clearly establish a physiological and nonredundant role for serpinb1 in regulating NSPs during pulmonary infection.
NSPs also cleave molecules involved in apoptotic cell clearance, including the surfactant protein SP-D and the phosphatidylserine receptor on macrophages (31, 32), thereby tipping the balance further toward a detrimental outcome. The increased numbers of leukocytes with active caspase-3 in the alveolar space of P. aeruginosa–infectedserpinb1−/− mice suggest that the removal of apoptotic cells may be inadequate during infection. SP-D has been shown to stimulate phagocytosis of P. aeruginosa by alveolar macrophages in vitro (33), and SP-D–deficient mice were found to have defective early (6-h) clearance of P. aeruginosa from the lung (34). Although the destruction of SP-D alone may not entirely account for the defective phenotype of serpinb1−/− mice, loss of SP-D likely diminishes bacterial clearance and removal of apop totic neutrophils.
Given that NSPs also mediate bacterial killing, why would NSP excess lead to a failed bacterial clearance? In the NE KO mice, the decreased killing activity of neutrophils is a direct consequence of the loss of the bactericidal activity of NE. The absence of an early bacterial clearance defect at 6 h after infection in serpinb1−/− mice suggests that there is initially normal bacterial killing. The current understanding is that the compartmentalization of the NSPs is crucial to the outcome of their actions: on the one hand, NSPs are protective when killing microbes within phagosomes, and on the other hand, extracellular NSPs destroy innate immune defense molecules such as lung collectins, immunoglobulins, and complement receptors. We have shown that the regulation of NSP activity is essential and that cytoplasmic serpinb1 provides this crucial shield. Neutrophils undergoing cell death gradually transition from apoptosis, characterized by a nonpermeable plasma membrane, to necrosis and lysis, where cellular and granule contents, including NSPs, are released. The increased pace of serpinb1−/− neutrophil cell death strongly suggests that unopposed NSPs may precipitate neutrophil demise and, therefore, reduce the neutrophil numbers leading to a late-onset innate immune defect. High levels of G-CSF, a prosurvival cytokine for neutrophils, also indicate that increased cell death is likely independent or downstream of G-CSF.
In conclusion, serpinb1 deficiency unleashes unbridled proteolytic activity during inflammation and thereby disables two critical components of the host response to bacterial infection, the neutrophil and the collectin SP-D. The phenotype of the infectedserpinb1-deficient mouse, characterized by a normal early antibacterial response that degenerates over time, highlights the delicate balance of protease–antiprotease systems that protect the host against its own defenses as well as invading microbes during infection-induced inflammation.
Proteinase 3 and neutrophil elastase enhance inflammation in mice by inactivating antiinflammatory progranulin
K Kessenbrock,1 LFröhlich,2 M Sixt,3 …., A Belaaouaj,5 J Ring,6,7 M Ollert,6 R Fässler,3 and DE. Jenne1
J Clin Invest. 2008 Jul 1; 118(7): 2438–2447. http://dx.doi.org:/10.1172/JCI34694
Neutrophil granulocytes form the body’s first line of antibacterial defense, but they also contribute to tissue injury and noninfectious, chronic inflammation. Proteinase 3 (PR3) and neutrophil elastase (NE) are 2 abundant neutrophil serine proteases implicated in antimicrobial defense with overlapping and potentially redundant substrate specificity. Here, we unraveled a cooperative role for PR3 and NE in neutrophil activation and noninfectious inflammation in vivo, which we believe to be novel. Mice lacking both PR3 and NE demonstrated strongly diminished immune complex–mediated (IC-mediated) neutrophil infiltration in vivo as well as reduced activation of isolated neutrophils by ICs in vitro. In contrast, in mice lacking just NE, neutrophil recruitment to ICs was only marginally impaired. The defects in mice lacking both PR3 and NE were directly linked to the accumulation of antiinflammatory progranulin (PGRN). Both PR3 and NE cleaved PGRN in vitro and during neutrophil activation and inflammation in vivo. Local administration of recombinant PGRN potently inhibited neutrophilic inflammation in vivo, demonstrating that PGRN represents a crucial inflammation-suppressing mediator. We conclude that PR3 and NE enhance neutrophil-dependent inflammation by eliminating the local antiinflammatory activity of PGRN. Our results support the use of serine protease inhibitors as antiinflammatory agents.
Neutrophils belong to the body’s first line of cellular defense and respond quickly to tissue injury and invading microorganisms (1). In a variety of human diseases, like autoimmune disorders, infections, or hypersensitivity reactions, the underlying pathogenic mechanism is the formation of antigen-antibody complexes, so-called immune complexes (ICs), which trigger an inflammatory response by inducing the infiltration of neutrophils (2). The subsequent stimulation of neutrophils by C3b-opsonized ICs results in the generation of ROS and the release of intracellularly stored proteases leading to tissue damage and inflammation (3). It is therefore important to identify the mechanisms that control the activation of infiltrating neutrophils.
Neutrophils abundantly express a unique set of neutrophil serine proteases (NSPs), namely cathepsin G (CG), proteinase 3 (PR3; encoded by Prtn3), and neutrophil elastase (NE; encoded by Ela2), which are stored in the cytoplasmic, azurophilic granules. PR3 and NE are closely related enzymes, with overlapping and potentially redundant substrate specificities different from those of CG. All 3 NSPs are implicated in antimicrobial defense by degrading engulfed microorganisms inside the phagolysosomes of neutrophils (4–8). Among many other functions ascribed to these enzymes, PR3 and NE were also suggested to play a fundamental role in granulocyte development in the bone marrow (9–11).
While the vast majority of the enzymes is stored intracellularly, minor quantities of PR3 and NE are externalized early during neutrophil activation and remain bound to the cell surface, where they are protected against protease inhibitors (12, 13). These membrane presented proteases were suggested to act as path clearers for neutrophil migration by degrading components of the extracellular matrix (14). This notion has been addressed in a number of studies, which yielded conflicting results (15–17). Thus, the role of PR3 and NE in leukocyte extravasation and interstitial migration still remains controversial.
Emerging data suggest that externalized NSPs can contribute to inflammatory processes in a more complex way than by simple proteolytic tissue degradation (18). For instance, recent observations using mice double-deficient for CG and NE indicate that pericellular CG enhances IC-mediated neutrophil activation and inflammation by modulating integrin clustering on the neutrophil cell surface (19, 20). Because to our knowledge no Prtn3–/– mice have previously been generated, the role of this NSP in inflammatory processes has not been deciphered. Moreover, NE-dependent functions that can be compensated by PR3 in Ela2–/–animals are still elusive.
One mechanism by which NSPs could upregulate the inflammatory response has recently been proposed. The ubiquitously expressed progranulin (PGRN) is a growth factor implicated in tissue regeneration, tumorigenesis, and inflammation (21–23). PGRN was previously shown to directly inhibit adhesion-dependent neutrophil activation by suppressing the production of ROS and the release of neutrophil proteases in vitro (23). This antiinflammatory activity was degraded by NE-mediated proteolysis of PGRN to granulin (GRN) peptides (23). In contrast, GRN peptides may enhance inflammation (23) and have been detected in neutrophil-rich peritoneal exudates (24). In short, recent studies proposed PGRN as a regulator of the innate immune response, but the factors that control PGRN function are still poorly defined and its relevance to inflammation needs to be elucidated in vivo.
In the present study, we generated double-deficient Prtn3–/–Ela2–/– mice to investigate the role of these highly similar serine proteases in noninfectious neutrophilic inflammation. We established that PR3 and NE are required for acute inflammation in response to subcutaneous IC formation. The proteases were found to be directly involved in early neutrophil activation events, because isolated Prtn3–/–Ela2–/– neutrophils were poorly activated by ICs in vitro. These defects in Prtn3–/–Ela2–/– mice were accompanied by accumulation of PGRN. We demonstrated that PGRN represents a potent inflammation-suppressing factor that is cleaved by both PR3 and NE. Our data delineate what we believe to be a previously unknown proinflammatory role for PR3 and NE, which is accomplished via the local inactivation of antiinflammatory PGRN.
Generation of Prtn3–/–Ela2–/– mice.
To analyze the role of PR3 and NE in neutrophilic inflammation, we generated a Prtn3–/–Ela2–/– mouse line by targeted gene disruption in embryonic stem cells (see Supplemental Figure 1; supplemental material available online with this article; doi: 10.1172/JCI34694DS1). Positive recombination of the Prtn3/Ela2locus was proven by Southern blotting of embryonic stem cell clones (Figure (Figure1A).1A). Prtn3–/–Ela2–/– mice showed no expression of mRNA for PR3 and NE in bone marrow cells, as assessed by RT-PCR (Figure (Figure1B).1B). The successful elimination of PR3 and NE was confirmed at the level of proteolytic activity in neutrophil lysates using a PR3/NE-specific chromogenic substrate (Supplemental Figure 3) as well as by casein zymography (Figure (Figure1C).1C). The substantially reduced casein degradation by heterozygous neutrophils indicates gene-dosage dependence of PR3/NE activities. Furthermore, PR3 and NE deficiency was proven by Western blotting using cell lysates from bone marrow–derived neutrophils, while other enzymes stored in azurophilic granula, such as CG and myeloperoxidase (MPO), were normally detected (Figure (Figure1D).1D). Crossing of heterozygous Prtn3+/–Ela2+/– mice resulted in regular offspring of WT, heterozygous, and homozygous genotype according to the Mendelian ratio. Despite the absence of 2 abundant serine proteases, and in contrast to expectations based on previous reports (9–11), we found unchanged neutrophil morphology (Figure (Figure1E)1E) and regular neutrophil populations in the peripheral blood of the mutant mice, the latter as assessed via flow cytometry to determine the differentiation markers CD11b and Gr-1 (Figure (Figure1F)1F) (25, 26). Moreover, Prtn3–/–Ela2–/– mice demonstrated normal percentages of the leukocyte subpopulations in the peripheral blood, as determined by the Diff-Quick staining protocol and by hemocytometric counting (Supplemental Figure 2, A and B). Hence, the proteases are not crucially involved in granulopoiesis, and ablating PR3 and NE in the germ line represents a valid approach to assess their biological significance in vivo.
Generation and characterization of Prtn3–/–Ela2–/– mice.
PR3 and NE are dispensable for neutrophil extravasation and interstitial migration.
To examine neutrophil infiltration into the perivascular tissue, we applied phorbol esters (croton oil) to the mouse ears. At 4 h after stimulation, we assessed the neutrophil distribution in relation to the extravascular basement membrane (EBM) by immunofluorescence microscopy of fixed whole-mount specimens (Figure (Figure2A).2A). We found that Prtn3–/–Ela2–/– neutrophils transmigrated into the interstitium without retention at the EBM (Figure (Figure2B),2B), resulting in quantitatively normal and widespread neutrophil influx compared with WT mice (Figure (Figure2C).2C). Moreover, we analyzed chemotactic migration of isolated neutrophils through a 3-dimensional collagen meshwork in vitro (Supplemental Video 1) and found unhampered chemotaxis toward a C5a gradient, based on the directionality (Figure (Figure2D)2D) and velocity (Figure (Figure2E)2E) of Prtn3–/–Ela2–/–neutrophils. These findings led us to conclude that PR3 and NE are not principally required for neutrophil extravasation or interstitial migration.
PR3 and NE are not principally required for neutrophil extravasation and interstitial migration.
Reduced inflammatory response to ICs in Prtn3–/–Ela2–/– mice.
The formation of ICs represents an important trigger of neutrophil-dependent inflammation in many human diseases (2). To determine the role of PR3 and NE in this context, we induced a classic model of subcutaneous IC-mediated inflammation, namely the reverse passive Arthus reaction (RPA) (27). At 4 h after RPA induction, we assessed the cellular inflammatory infiltrates by histology using H&E-stained skin sections (Figure (Figure3A).3A). Neutrophils, which were additionally identified by Gr-1 immunohistochemistry, made up the vast majority of all cellular infiltrates (Figure (Figure3A).3A). We found that neutrophil infiltration to the sites of IC formation was severely diminished in Prtn3–/–Ela2–/– mice. Indeed, histological quantification revealed significantly reduced neutrophil influx in Prtn3–/–Ela2–/– mice compared with WT mice, while Ela2–/– mice showed marginally reduced neutrophil counts (Figure (Figure3B).3B). These results indicate that PR3 and NE fulfill an important proinflammatory function during IC-mediated inflammation.
http://www.ncbi.nlm.nih.gov/pmc/articles/PMC2430496/bin/JCI0834694.f3.jpg
Impaired inflammatory response to locally formed ICs inPrtn3–/–Ela2–/– mice.
(A) Representative photomicrographs of inflamed skin sections 4 h after IC formation. Neutrophils were identified morphologically (polymorphic nucleus) in H&E stainings and by Gr-1 staining (red). The cellular infiltrates were located to the adipose tissue next to the panniculus carnosus muscle (asterisks) and were primarily composed of neutrophil granulocytes. Scale bars: 200 μm. (B) Neutrophil infiltrates in lesions from Prtn3–/–Ela2–/– mice were significantly diminished compared with Ela2–/– mice and WT mice. Neutrophil influx in Ela2–/–mice was slightly, but not significantly, diminished compared with WT mice. Results are mean ± SEM infiltrated neutrophils per HPF. *P < 0.05.
PR3 and NE enhance neutrophil activation by ICs in vitro.
PR3 and NE enhance neutrophil activation by ICs in vitro.
Because PR3 and NE were required for the inflammatory response to IC (Figure (Figure3),3), but not to phorbol esters (Figure (Figure2),2), we considered the enzymes as enhancers of the neutrophil response to IC. We therefore assessed the oxidative burst using dihydrorhodamine as a readout for cellular activation of isolated, TNF-α–primed neutrophils in the presence of ICs in vitro. While both WT and Prtn3–/–Ela2–/– neutrophils showed a similar, approximately 20-min lag phase before the oxidative burst commenced, the ROS production over time was markedly reduced, by 30%–40%, in the absence of PR3 and NE (Figure (Figure4A).4A). In contrast, oxidative burst triggered by 25 nM PMA was not hindered in Prtn3–/–Ela2–/– neutrophils (Figure (Figure4B),4B), which indicated no general defect in producing ROS. We also performed a titration series ranging from 0.1 to 50 nM PMA and found no reduction in oxidative burst activity in Prtn3–/–Ela2–/– neutrophils at any PMA concentration used (Supplemental Figure 4). These data are consistent with our in vivo experiments showing that neutrophil influx to ICs was impaired (Figure (Figure3),3), whereas the inflammatory response to phorbol esters was normal (Figure (Figure2,2, A–C), in Prtn3–/–Ela2–/– mice. To compare neutrophil priming in WT and Prtn3–/–Ela2–/–neutrophils, we analyzed cell surface expression of CD11b after 30 min of incubation at various concentrations of TNF-α and found no difference (Supplemental Figure 5). Moreover, we observed normal neutrophil adhesion to IC-coated surfaces (Supplemental Figure 6A) and unaltered phagocytosis of opsonized, fluorescently labeled E. coli bacteria (Supplemental Figure 6, B and C) in the absence of both proteases. We therefore hypothesized that PR3 and NE enhance early events of adhesion-dependent neutrophil activation after TNF-α priming and binding of ICs. It is important to note that Ela2–/– neutrophils were previously shown to react normally in the same setup (20). Regarding the highly similar cleavage specificities of both proteases, we suggested that PR3 and NE complemented each other during the process of neutrophil activation and inflammation.
http://www.ncbi.nlm.nih.gov/pmc/articles/PMC2430496/bin/JCI0834694.f4.jpg
Impaired oxidative burst and PGRN degradation by IC-activatedPrtn3–/–Ela2–/– neutrophils.
Oxidative burst as the readout for neutrophil activation by ICs was measured over time. (A) While no difference was observed during the initial 20-min lag phase of the oxidative burst, Prtn3–/–Ela2–/– neutrophils exhibited diminished ROS production over time compared with WT neutrophils. (B) Bypassing receptor-mediated activation using 25 nM PMA restored the diminished oxidative burst of Prtn3–/–Ela2–/–neutrophils. Results are presented as normalized fluorescence in AU (relative to maximum fluorescence produced by WT cells). Data (mean ± SD) are representative of 3 independent experiments each conducted in triplicate. (C) Isolated mouse neutrophils were activated by ICs in vitro and tested for PGRN degradation by IB. In the cellular fraction, the PGRN (~80 kDa) signal was markedly increased in Prtn3–/–Ela2–/–cells compared with WT and Ela2–/– neutrophils. Intact PGRN was present in the supernatant (SN) of IC-activated Prtn3–/–Ela2–/–neutrophils only, not of WT or Ela2–/– cells. (D and E) Exogenous administration of 100 nM PGRN significantly reduced ROS production of neutrophils activated by ICs (D), but not when activated by PMA (E). Data (mean ± SD) are representative of 3 independent experiments each conducted in triplicate.
Antiinflammatory PGRN is degraded by PR3 and NE during IC-mediated neutrophil activation.
PGRN inhibits neutrophil activation by ICs in vitro.
Both PR3 and NE process PGRN in vitro.
PR3 and NE are major PGRN processing enzymes of neutrophils.
PGRN inhibits IC-mediated inflammation in vivo.
PGRN is a potent inhibitor of IC-stimulated inflammation in vivo.
PR3 and NE cleave PGRN during inflammation in vivo.
Finally, we aimed to demonstrate defective PGRN degradation in Prtn3–/–Ela2–/– mice during neutrophilic inflammation in vivo. For practical reasons, we harvested infiltrated neutrophils from the inflamed peritoneum 4 h after casein injection and subjected the lysates of these cells to anti-PGRN Western blot. Intact, inhibitory PGRN was detected in Prtn3–/–Ela2–/– neutrophils, but not in WT cells (Figure (Figure6D).6D). These data prove that neutrophilic inflammation is accompanied by proteolytic removal of antiinflammatory PGRN and that the process of PGRN degradation is essentially impaired in vivo in the absence of PR3 and NE.
Chronic inflammatory and autoimmune diseases are often perpetuated by continuous neutrophil infiltration and activation. According to the current view, the role of NSPs in these diseases is mainly associated with proteolytic tissue degradation after their release from activated or dying neutrophils. However, recent observations suggest that NSPs such as CG may contribute to noninfectious diseases in a more complex manner, namely as specific regulators of inflammation (18). Here, we demonstrate that PR3 and NE cooperatively fulfilled an important proinflammatory role during neutrophilic inflammation. PR3 and NE directly enhanced neutrophil activation by degrading oxidative burst–suppressing PGRN. These findings support the use of specific serine protease inhibitors as antiinflammatory agents.
Much attention has been paid to the degradation of extracellular matrix components by NSPs. We therefore expected that ablation of both PR3 and NE would cause impaired neutrophil extravasation and interstitial migration. Surprisingly, we found that the proteases were principally dispensable for these processes:Prtn3–/–Ela2–/– neutrophils migrated normally through a dense, 3-dimensional collagen matrix in vitro and demonstrated regular extravasation in vivo when phorbol esters were applied (Figure (Figure2).2). This finding is in agreement with recent reports that neutrophils preferentially and readily cross the EBM through regions of low matrix density in the absence of NE (28).
Conversely, we observed that PR3 and NE were required for the inflammatory response to locally formed ICs (Figure (Figure3).3). Even isolated Prtn3–/–Ela2–/– neutrophils were challenged in performing oxidative burst after IC stimulation in vitro (Figure (Figure4A),4A), showing that the proteases directly enhanced the activation of neutrophils also in the absence of extracellular matrix. However, when receptor-mediated signal transduction was bypassed by means of PMA, neutrophils from Prtn3–/–Ela2–/– mice performed normal oxidative burst (Figure (Figure4B),4B), indicating that the function of the phagocyte oxidase (phox) complex was not altered in the absence of PR3 and NE. These findings substantiate what we believe to be a novel paradigm: that all 3 serine proteases of azurophilic granules (CG, PR3, and NE), after their release in response to IC encounter, potentiate a positive autocrine feedback on neutrophil activation.
In contrast to CG, the highly related proteases PR3 and NE cooperate in the effacement of antiinflammatory PGRN, leading to enhanced neutrophil activation. Previous studies already demonstrated that PGRN is a potent inhibitor of the adhesion-dependent oxidative burst of neutrophils in vitro, which can be degraded by NE (23). Here, we showed that PR3 and NE play an equally important role in the regulation of PGRN function. Ela2–/– neutrophils were sufficiently able to degrade PGRN. Only in the absence of both PR3 and NE was PGRN degradation substantially impaired, resulting in the accumulation of antiinflammatory PGRN during neutrophil activation in vitro (Figure (Figure4C)4C) and neutrophilic inflammation in vivo (Figure (Figure6D).6D). Moreover, we provided in vivo evidence for the crucial role of PGRN as an inflammation-suppressing mediator, because administration of recombinant PGRN potently inhibited the neutrophil influx to sites of IC formation (Figure (Figure6,6, A–C). Hence, the cooperative degradation of PGRN by PR3 and NE is a decisive step for the establishment of neutrophilic inflammation.
The molecular mechanism of PGRN function is not yet completely understood, but it seems to interfere with integrin (CD11b/CD18) outside-in signaling by blocking the function of pyk2 and thus dampens adhesion-related oxidative burst even when added after the initial lag phase of oxidase activation (23). PGRN is produced by neutrophils and stored in highly mobile secretory granules (29). It was recently shown that PGRN can bind to heparan-sulfated proteoglycans (30), which are abundant components of the EBM and various cell surfaces, including those of neutrophils. Also, PR3 and NE are known to interact with heparan sulfates on the outer membrane of neutrophils, where the enzymes appear to be protected against protease inhibitors (12, 13, 31). These circumstantial observations support the notion that PGRN cleavage by PR3 and NE takes place at the pericellular microenvironment of the neutrophil cell surface.
Impaired outside-in signaling most likely reduced the oxidative burst in Prtn3–/–Ela2–/– neutrophils adhering to ICs. In support of this hypothesis, we excluded an altered response to TNF-α priming (Supplemental Figure 5) as well as reduced adhesion to immobilized ICs and defective endocytosis of serum-opsonized E. coli in Prtn3–/–Ela2–/– neutrophils (Supplemental Figure 6). MPO content and processing was also unchanged in Prtn3–/–Ela2–/– neutrophils (Figure (Figure1D);1D); hence, the previously discussed inhibitory effect of MPO on phox activity (32, 33) does not appear to be stronger in neutrophils lacking PR3 and NE. Because there was no difference in the lag phase of the oxidative burst, initial IC-triggered receptor activation was probably not affected by either PRGN or PR3/NE. Our concept is consistent with all these observations and takes into account that PGRN unfolds its suppressing effects in the second phase, when additional membrane receptors, endogenous PGRN, and some PR3/NE from highly mobile intracellular pools are translocated to the cell surface. The decline and cessation of ROS production suggested to us that outside-in signaling was not sustained and that active oxidase complexes were no longer replenished in the absence of PR3 and NE. Our present findings, however, do not allow us to exclude other potential mechanisms, such as accelerated disassembly of the active oxidase complex.
http://www.ncbi.nlm.nih.gov/pmc/articles/PMC2430496/bin/JCI0834694.f7.jpg
Proposed function of PR3 and NE in IC-mediated inflammation.
TNF-α–primed neutrophils extravasate from blood vessels, translocate PR3/NE to the cellular surface, and discharge PGRN to the pericellular environment (i). During transmigration of interstitial tissues (ii), neutrophil activation is initially suppressed by relatively high pericellular levels of antiinflammatory PGRN (green shading), which is also produced locally by keratinocytes and epithelial cells of the skin. Until IC depots are reached, neutrophil activation is inhibited by PGRN. Surface receptors (e.g., Mac-1) recognize ICs, which results in signal transduction (black dotted arrow) and activation of the phox. The molecular pathway of PGRN-mediated inhibition is not completely understood, but it may interfere with integrin signaling after IC encounter (green dotted line inside the cell). Adherence of neutrophils to ICs (iii) further increases pericellular PR3 and NE activity. PR3 and NE cooperatively degrade PGRN in the early stage of neutrophilic activation to facilitate optimal neutrophil activation (red shading), resulting in sustained integrin signaling (red arrow) and robust production of ROS by the phox system. Subsequently, neutrophils release ROS together with other proinflammatory mediators and chemotactic agents, thereby enhancing the recruitment of further neutrophils and establishing inflammation (iv). In the absence of PR3/NE, the switch from inflammation-suppressing (ii) to inflammation-enhancing (iii) conditions is substantially delayed, resulting in diminished inflammation in response to ICs (iv).
NSPs are strongly implicated as effector molecules in a large number of destructive diseases, such as emphysema or the autoimmune blistering skin disease bullous pemphigoid (14, 35–37). Normally, PR3/NE activity is tightly controlled by high plasma levels of α1-antitrypsin. This balance between proteases and protease inhibitors is disrupted in patients with genetic α1-antitrypsin deficiency, which represents a high risk factor for the development of emphysema and certain autoimmune disorders (38). The pathogenic effects of NSPs in these diseases have so far been associated with tissue destruction by the proteases after their release from dying neutrophils. Our findings showed that PR3 and NE were already involved in much earlier events of the inflammatory process, because the enzymes directly regulated cellular activation of infiltrating neutrophils by degrading inflammation-suppressing PGRN. This concept is further supported by previous studies showing increased inflammation in mice lacking serine protease inhibitors such as SERPINB1 or SLPI (39, 40). Blocking PR3/NE activity using specific inhibitors therefore represents a promising therapeutic strategy to treat chronic, noninfectious inflammation. Serine protease inhibitors as antiinflammatory agents can interfere with the disease process at 2 different stages, because they attenuate both early events of neutrophil activation and proteolytic tissue injury caused by released NSPs.
Editorial: Serine proteases, serpins, and neutropenia
J Leuko Biol July 2011; 90(1): 3-4 http://dx.doi.org:/10.1189/jlb.1010592
Cyclic neutropenia and severe congenital neutropenia are autosomal-dominant diseases usually attributable to mutations in the gene for neutrophil elastase orELANE. Patients with these diseases are predisposed to recurrent and life-threatening infections [1]. Neutrophil elastase, the product of the ELANE gene, is a serine protease that is synthesized and packaged in the primary granules of neutrophils. These granules are formed at the promyelocytes stage of neutrophil development. Synthesis of mutant neutrophil elastase in promyelocytes triggers the unfolded protein response and a cascade of intracellular events, which culminates in death of neutrophil precursors through apoptosis [2]. This loss of cells causes the marrow abnormality often referred to as “maturation arrest” [3, 4].
Neutrophil elastase is one of the serine proteases normally inhibited by serpinB1. In this issue of JLB, Benarafa and coauthors [5] present their intriguing studies of serpinB1 expression in human myeloid cells and their extensive investigations ofSERPINB1−/− mice. They observed that serpinB1 expression parallels protease expression. The peak of serpinB1 expression occurs in promyelocytes. Benarafa et al. [5] found that SERPINB1−/− mice have a deficiency of postmitotic neutrophils in the bone marrow. This change was accompanied by an increase in the plasma levels of G-CSF. The decreased supply of marrow neutrophils reduced the number of neutrophils that could be mobilized to an inflammatory site. Using colony-forming cell assays, they determined that the early myeloid progenitor pool was intact. Separate assays showed that maturing myeloid cells were being lost through accelerated apoptosis of maturing neutrophils in the marrow. The authors concluded that serpinB1 is required for maintenance of a healthy reserve of marrow neutrophils and a normal acute immune response [5].
This paper provides new and fascinating insights for understanding the mechanism for neutropenia. It also suggests opportunities to investigate potential therapies for patients with neutropenia and prompts several questions. As inhibition of the activity of intracellular serine proteases is the only known function of serpinB1, the findings reported by Benarafa et al. [5] suggest that uninhibited serine proteases perturbed neutrophil production severely. The SERPINB1−/− mice used in their work have accelerated apoptosis of myeloid cells, a finding suggesting that uninhibited serine proteases or mutant neutrophil elastase perturb myelopoiesis by similar mechanisms. It is now important to determine whether the defect in the SERPINB1−/− mice is, indeed, attributable to uninhibited activity of normal neutrophil elastase, other neutrophil proteases, or another mechanism. ″Double-knockout″ studies in mice deficient in neutrophil elastase and serpinB1 might provide an answer.
This report provides evidence regarding the intracellular mechanisms for the apoptosis of myeloid cells and indicates that other studies are ongoing. The key antiapoptotic proteins, Mcl-1, Bcl-XL, and A1/Bfl-I, are apparently not involved. A more precise understanding of the mechanisms of cell death is important for development of targeted therapies for neutropenia. It is also important to discover whether only cells of the neutrophil lineage are involved or whether monocytes are also affected. In cyclic and congenital neutropenia, patients failed to produce neutrophils, but they can produce monocytes; in fact, they overproduce monocytes and have significantly elevated blood monocyte counts. Neutropenia with monocytosis is probably attributable to differences in the expression of ELANE in the two lineages. Benarafa et al. [5] reported that human bone marrow monocytes contain substantially less serpinB1 than marrow neutrophils, suggesting that the expression of serpinB1 and the serine proteases are closely coordinated.
This report shows the importance of the marrow neutrophil reserves in the normal response to infections. Compared with humans, healthy mice are always neutropenic, but they have a bigger marrow neutrophil reserve, and their mature neutrophils in the marrow and blood look like human band neutrophils. These differences are well known, but they are critical for considering the clinical inferences that can be made from this report. For example, although theSERPINB1−/− mice were not neutropenic, human SERPINB1−/− might cause neutropenia because of physiological differences between the species. If some but not all mutations in SERPINB1 cause neutropenia, we might gain a better understanding about how serpinB1 normally inhibits the neutrophil’s serine proteases.
We do not know if some or all of the mutant neutrophil elastases can be inhibited by serpinB1. We do not know whether cyclic or congenital neutropenia are attributable to defects in this interaction. However, we do know that there are chemical inhibitors of neutrophil elastase that can abrogate apoptosis of myeloid cells in a cellular model for congenital neutropenia [6]. It would be interesting to see if these chemical inhibitors can replace the natural inhibitor and normalize neutrophil production in the SERPINB1−/− mice. This would provide evidence to support use of chemical protease inhibitors as a treatment for cyclic and congenital neutropenia.
Concerns with the use of G-CSF for the treatment of cyclic and congenital neutropenia are how and why some of these patients are at risk of developing leukemia. Are the SERPINB1−/− mice with a hyperproliferative marrow and high G-CSF levels also at risk of developing myeloid leukemia?
This is a very provocative paper, and much will be learned from further studies of the SERPINB1−/− mice.
SerpinB1 is critical for neutrophil survival through cell-autonomous inhibition of cathepsin G
Mathias Baumann1,2, Christine T. N. Pham3, and Charaf Benarafa1
Blood May 9, 2013; 121(19) http://www.bloodjournal.org/content/121/19/3900
Key Points
- Serine protease inhibitor serpinB1 protects neutrophils by inhibition of their own azurophil granule protease cathepsin G.
- Granule permeabilization in neutrophils leads to cathepsin G–mediated death upstream and independent of apoptotic caspases.
Abstract
Bone marrow (BM) holds a large reserve of polymorphonuclear neutrophils (PMNs) that are rapidly mobilized to the circulation and tissues in response to danger signals. SerpinB1 is a potent inhibitor of neutrophil serine proteases neutrophil elastase (NE) and cathepsin G (CG). SerpinB1 deficiency (sB1−/−) results in a severe reduction of the BM PMN reserve and failure to clear bacterial infection. Using BM chimera, we found that serpinB1 deficiency in BM cells was necessary and sufficient to reproduce the BM neutropenia ofsB1−/− mice. Moreover, we showed that genetic deletion of CG, but not NE, fully rescued the BM neutropenia in sB1−/− mice. In mixed BM chimera and in vitro survival studies, we showed that CG modulates sB1−/− PMN survival through a cell-intrinsic pathway. In addition, membrane permeabilization by lysosomotropic agent L-leucyl-L-leucine methyl ester that allows cytosolic release of granule contents was sufficient to induce rapid PMN death through a CG-dependent pathway. CG-mediated PMN cytotoxicity was only partly blocked by caspase inhibition, suggesting that CG cleaves a distinct set of targets during apoptosis. In conclusion, we have unveiled a new cytotoxic function for the serine protease CG and showed that serpinB1 is critical for maintaining PMN survival by antagonizing intracellular CG activity.
Introduction
Polymorphonuclear neutrophil (PMN) granulocytes are essential components of the innate immune response to infection. PMNs are relatively short-lived leukocytes that originate from hematopoietic stem cells in the bone marrow (BM) in a process called granulopoiesis. Granulopoiesis proceeds through a proliferative phase followed by a maturation phase. After maturation, the BM retains a large reserve of mature PMNs, which includes over 90% of the mature PMNs in the body while only a small proportion (1%-5%) is in the blood.1,2 Even in noninflammatory conditions, granulopoiesis is remarkable as >1011 PMNs are produced daily in an adult human, only to be disposed of, largely unused, a few hours later.3 There is evidence that the majority of PMNs produced never reach circulation and die within the BM.4 Congenital or acquired forms of neutropenia are associated with the highest risks of bacterial and fungal infection,5 indicating a strong evolutionary pressure to maintain granulopoiesis at high levels and sustain a large mobilizable pool of PMNs in the BM.
In steady state, PMNs die by apoptosis, a form of programmed cell death that allows for the safe disposal of aging PMNs and their potentially toxic cargo. Like in other cells, caspases participate in the initiation, amplification, and execution steps of apoptosis in PMNs.6,7 Interestingly, noncaspase cysteine proteases calpain and cathepsin D were reported to induce PMN apoptosis through activation of caspases.8⇓⇓–11 In addition, PMNs carry a unique set of serine proteases (neutrophil serine proteases [NSPs]) including elastase (NE), cathepsin G (CG), and proteinase-3 (PR3) stored active in primary granules. There is strong evidence for a role of NSPs in killing pathogens and inducing tissue injury when released extracellularly.12⇓–14 In contrast, the function of NSPs in PMN homeostasis and cell death remains elusive. In particular, no defects in granulopoiesis or PMN homeostasis have been reported in mice deficient in cathepsin G (CG−/−),15 neutrophil elastase (NE−/−),16,17 or dipeptidylpeptidase I (DPPI−/−), which lack active NSPs.18 We have recently shown that mice lacking the serine protease inhibitor serpinB1 (sB1−/−) have reduced PMN survival in the lungs following Pseudomonas infection and that these mice have a profound reduction in mature PMN numbers in the BM.19,20SerpinB1, also known as monocyte NE inhibitor, is expressed at high levels in the cytoplasm of PMNs and is one of the most potent inhibitors of NE, CG, and PR3.21,22 In this study, we tested the hypothesis that serpinB1 promotes PMN survival by inhibiting 1 or several NSPs, and we discovered a novel regulatory pathway in PMN homeostasis in vivo.
http://d3md5dngttnvbj.cloudfront.net/content/bloodjournal/121/19/3900/F1.medium.gif
Figure 1
Defective PMN reserve in BM chimera depends on serpinB1 deficiency in the hematopoietic compartment. Flow cytometry analysis of major BM leukocyte subsets of lethally irradiated mice was performed 8 to 10 weeks after BM transfer. (A) Irradiated WT (CD45.1) mice were transferred with WT (●) or sB1−/− (○) BM cells. (B) Irradiated WT (●) andsB1−/− (○) mice both CD45.2 were transferred with WT (CD45.1) BM cells. Each circle represents leukocyte numbers for 1 mouse and horizontal line indicates the median. Median subsets numbers were compared by the Mann-Whitney test (*P < .05; ***P < .001).
CG regulates neutrophil numbers in the BM
Because serpinB1 is an efficient inhibitor of NE, CG, and PR3, we then examined PMN numbers in mice deficient in 1 or several NSPs in combination with serpinB1 deletion. As expected, sB1−/− mice had significantly reduced numbers and percentage of mature PMNs in the BM compared with WT and heterozygous sB1+/− mice. In addition, PMN numbers were normal in mice deficient in either DPPI, NE, or CG (Figure 2A). DPPI is not inhibited by serpinB1 but is required for the activation of all NSPs, and no NSP activity is detectable in DPPI−/− mice.18,23 PMN counts in DPPI−/−.sB1−/− BM were significantly higher than in sB1−/− BM, suggesting that 1 or several NSPs contribute to the PMN survival defect. To examine the role of NSPs in this process, we crossed several NSP-deficient strains with sB1−/− mice. We found that NE.CG.sB1−/− mice had normal PMN numbers indicating that these NSPs play a key role in the defective phenotype of sB1−/− PMNs (Figure 2A). Furthermore, CG.sB1−/− mice showed normal PMN numbers whereasNE.sB1−/− mice retained the BM neutropenia phenotype indicating that CG, but not NE, plays a significant role in the death of sB1−/− PMNs (Figure 2A). In addition, the double-deficient NE.sB1−/− mice had significantly lower BM myelocyte numbers than sB1−/− mice while the myelocyte numbers in singly deficient NE−/− and sB1−/− BM were normal (Figure 2B). These results suggest that NE may promote myeloid cell proliferation, an activity that is revealed only when serpinB1 is absent. This complex interaction between sB1 and NE requires further investigation. On the other hand, B-cell and monocyte numbers and relative percentage in the BM were largely similar in all genotypes (supplemental Figure 2). Total numbers of blood leukocytes, erythrocytes, and platelets were normal in mice deficient in NSPs and/or serpinB1 (supplemental Figure 3). PMN numbers in blood were normal insB1−/− mice in steady state and combined deficiency of NSPs did not significantly alter these numbers (Figure 2C). Taken together, our results indicate that serpinB1 likely sustains the survival of postmitotic PMNs through its interaction with CG.
Figure 2
PMN and myelocyte numbers in BM and blood of mice deficient in NSPs and serpinB1.
http://d3md5dngttnvbj.cloudfront.net/content/bloodjournal/121/19/3900/F2.medium.gif
CG-mediated PMN death proceeds independent of caspase activity
Figure 4
sB1−/− PMN death mediated by CG does not require caspase activity
http://d3md5dngttnvbj.cloudfront.net/content/bloodjournal/121/19/3900/F4.medium.gif
Granule membrane permeabilization induces CG-mediated death in PMNs
To test whether granule disruption contributes to the serpinB1-regulated CG-dependent cell death, BM cells were treated with the lysosomotropic agent LLME. LLME accumulates in lysosomes where the acyl transferase activity of DPPI generates hydrophobic (Leu-Leu)n-OMe polymers that induce lysosomal membrane permeabilization (LMP) and cytotoxicity in granule-bearing cells such as cytotoxic T lymphocytes, NK cells, and myeloid cells.29,30
Figure 5
LMP induces CG-mediated death in PMNs
http://d3md5dngttnvbj.cloudfront.net/content/bloodjournal/121/19/3900/F5.medium.gif
G-CSF therapy increases sB1−/− PMN numbers via enhanced granulopoiesis
G-CSF therapy is an effective long-term treatment in many cases of severe congenital neutropenia and it is also used to prevent chemotherapy-induced febrile neutropenia by enhancing PMN production. In addition, G-CSF delays neutrophil apoptosis by differentially regulating proapoptotic and antiapoptotic factors.10 To test whether G-CSF could rescue sB1−/− PMN survival defect, WT and sB1−/− mice were treated with therapeutic doses of G-CSF or saline for 5 days and BM and blood PMNs were analyzed 24 hours after the last injection. Total counts of myelocytes and PMNs were significantly increased in the BM of treated mice compared with their respective untreated genotype controls (Figure 6A-B). The increase in myelocyte numbers was identical in G-CSF–treated WT and sB1−/− mice, indicating that G-CSF–induced granulopoiesis proceeds normally in sB1−/−myeloid progenitors (Figure 6B).
Figure 6
In vivo G-CSF therapy increases PMN numbers in BM of sB1−/− mice.
SerpinB1 is a member of the clade B serpins, a subfamily composed of leaderless proteins with nucleocytoplasmic localization. Clade B serpins are often expressed in cells that also carry target proteases, which led to the hypothesis that intracellular serpins protect against misdirected granule proteases and/or protect bystander cells from released proteases.31 We previously reported that deficiency in serpinB1 is associated with reduced PMN survival in the BM and at inflammatory sites.19,20 The evidence presented here demonstrates that the cytoprotective function of serpinB1 in PMNs is based on the inhibition of granule protease CG. Deficiency in CG was sufficient to rescue the defect of sB1−/− mice as illustrated by normal PMN counts in the BM of double knockout CG.sB1−/− mice. We also showed that the protease-serpin interaction occurred within PMNs. Indeed, WT PMNs had a greater survival over sB1−/− PMNs in mixed BM chimera, whereas the survival of CG.sB1−/− PMNs was similar to WT PMNs after BM transfer. SerpinB1 is an ancestral clade B serpin with a conserved specificity determining reactive center loop in all vertebrates.32 Furthermore, human and mouse serpinB1 have the same specificity for chymotrypsin-like and elastase-like serine proteases.21,22 Likewise, human and mouse CG have identical substrate specificities and the phenotype of CG−/− murine PMN can be rescued by human CG.33 Therefore, it is highly likely that the antagonistic functions of CG and serpinB1 in cellular homeostasis observed in mice can be extended to other species.
Extracellular CG was previously reported to promote detachment-induced apoptosis (anoikis) in human and mouse cardiomyocytes.34 This activity is mediated through the shedding and transactivation of epidermal growth factor receptor and downregulation of focal adhesion signaling.35,36 In our study, exogenous human CG also induced PMN death in vitro but these effects were not enhanced in sB1−/− PMNs and the neutropenia associated with serpinB1 deficiency was principally cell intrinsic. How intracellular CG induces PMN death remains to be fully investigated. However, our studies provide some indications on the potential pathways. Like other NSPs, the expression of CG is transcriptionally restricted to the promyelocyte stage during PMN development and NSPs are then stored in active form in primary azurophil granules.37 Because serpinB1 is equally efficient at inhibiting NE, CG, and PR3, it was surprising that deletion of CG alone was sufficient to achieve a complete reversal of the PMN survival defect in CG.sB1−/− mice. A possible explanation would be that CG gains access to targets more readily than other granule proteases. There is evidence that binding to serglycin proteoglycans differs between NE and CG resulting in altered sorting of NE but not CG into granules of serglycin-deficient PMNs.38 Different interactions with granule matrix may thus contribute to differential release of CG from the granules compared with other NSPs. However, because sB1−/− PMNs have similar levels of CG and NE as WT PMNs20 and because LLME-induced granule permeabilization likely releases all granule contents equally, we favor an alternative interpretation where CG specifically targets essential cellular components that are not cleaved by the other serpinB1-inhibitable granule proteases. Upon granule permeabilization, we found that CG can induce cell death upstream of caspases as well as independent of caspases. CG was previously shown to activate caspase-7 in vitro and it functions at neutral pH, which is consistent with a physiological role in the nucleocytoplasmic environment.39 Cell death induced by lysosomal/granule membrane permeabilization has previously been linked to cysteine cathepsins in other cell types. However, these proteases appear to depend on caspase activation to trigger apoptosis and they function poorly at neutral pH, questioning their potential role as regulators of cell death.40 In contrast, CG-mediated cell death is not completely blocked by caspase inhibition, which is a property reminiscent of granzymes in cytotoxic T cells.41 In fact, CG is phylogenetically most closely related to serine proteases granzyme B and H.42 Granzymes have numerous nuclear, mitochondrial, and cytoplasmic target proteins leading to cell death41 and we anticipate that this may also be the case for CG.
……
G-CSF therapy is successfully used to treat most congenital and acquired neutropenia through increased granulopoiesis, mobilization from the BM, and increased survival of PMNs. Prosurvival effects of G-CSF include the upregulation of antiapoptotic Bcl-2 family members, which act upstream of the mitochondria and the activation of effector caspases. In sB1−/− mice, G-CSF levels in serum are fourfold higher than in WT mice in steady state and this is accompanied by an upregulation of the antiapoptotic Bcl-2 family member Mcl-1 in sB1−/− PMNs.19 Here, G-CSF therapy significantly increased granulopoiesis in both WT and sB1−/− mice. However, the PMN numbers in treated sB1−/− BM and blood were significantly lower than those of treated WT mice, indicating only a partial rescue of the survival defect. This is consistent with our findings that CG-mediated death can proceed independent of caspases and can thus bypass antiapoptotic effects mediated by G-CSF.
CG has largely been studied in association with antimicrobial and inflammatory functions due to its presence in PMNs.12⇓–14,49 In this context, we have previously shown that serpinB1 contributes to prevent increased mortality and morbidity associated with production of inflammatory cytokines upon infection with Pseudomonas aeruginosa and influenza A virus.20,50 In this study, we demonstrate that serpinB1 inhibition of the primary granule protease CG in PMNs is essential for PMN survival and this ultimately regulates PMN numbers in vivo. Our findings also extend the roles of CG from antimicrobial and immunoregulatory functions to a novel role in inducing cell death.
Neutrophil Elastase, Proteinase 3, and Cathepsin G as Therapeutic Targets in Human Diseases
Brice Korkmaz, Marshall S. Horwitz, Dieter E. Jenne and Francis Gauthier
Pharma Rev Dec 2010; 62(4):726-759 http://dx.doi.org:/10.1124/pr.110.002733
Polymorphonuclear neutrophils are the first cells recruited to inflammatory sites and form the earliest line of defense against invading microorganisms. Neutrophil elastase, proteinase 3, and cathepsin G are three hematopoietic serine proteases stored in large quantities in neutrophil cytoplasmic azurophilic granules. They act in combination with reactive oxygen species to help degrade engulfed microorganisms inside phagolysosomes. These proteases are also externalized in an active form during neutrophil activation at inflammatory sites, thus contributing to the regulation of inflammatory and immune responses. As multifunctional proteases, they also play a regulatory role in noninfectious inflammatory diseases. Mutations in the ELA2/ELANE gene, encoding neutrophil elastase, are the cause of human congenital neutropenia. Neutrophil membrane-bound proteinase 3 serves as an autoantigen in Wegener granulomatosis, a systemic autoimmune vasculitis. All three proteases are affected by mutations of the gene (CTSC) encoding dipeptidyl peptidase I, a protease required for activation of their proform before storage in cytoplasmic granules. Mutations of CTSC cause Papillon-Lefèvre syndrome. Because of their roles in host defense and disease, elastase, proteinase 3, and cathepsin G are of interest as potential therapeutic targets. In this review, we describe the physicochemical functions of these proteases, toward a goal of better delineating their role in human diseases and identifying new therapeutic strategies based on the modulation of their bioavailability and activity. We also describe how nonhuman primate experimental models could assist with testing the efficacy of proposed therapeutic strategies.
Human polymorphonuclear neutrophils represent 35 to 75% of the population of circulating leukocytes and are the most abundant type of white blood cell in mammals (Borregaard et al., 2005). They are classified as granulocytes because of their intracytoplasmic granule content and are characterized by a multilobular nucleus. Neutrophils develop from pluripotent stem cells in the bone marrow and are released into the bloodstream where they reach a concentration of 1.5 to 5 × 10⁹ cells/liter. Their half-life in the circulation is only on the order of a few hours. They play an essential role in innate immune defense against invading pathogens and are among the primary mediators of inflammatory response. During the acute phase of inflammation, neutrophils are the first inflammatory cells to leave the vasculature, where they migrate toward sites of inflammation, following a gradient of inflammatory stimuli. They are responsible for short-term phagocytosis during the initial stages of infection (Borregaard and Cowland, 1997; Hampton et al., 1998; Segal, 2005). Neutrophils use complementary oxidative and nonoxidative pathways to defend the host against invading pathogens (Kobayashi et al., 2005).
The three serine proteases neutrophil elastase (NE1), proteinase 3 (PR3), and cathepsin G (CG) are major components of neutrophil azurophilic granules and participate in the nonoxidative pathway of intracellular and extracellular pathogen destruction. These neutrophil serine proteases (NSPs) act intracellularly within phagolysosomes to digest phagocytized microorganisms in combination with microbicidal peptides and the membrane-associated NADPH oxidase system, which produces reactive oxygen metabolites (Segal, 2005). An additional extracellular antimicrobial mechanism, neutrophil extracellular traps (NET), has been described that is made of a web-like structure of DNA secreted by activated neutrophils (Papayannopoulos and Zychlinsky, 2009) (Fig. 1). NETs are composed of chromatin bound to positively charged molecules, such as histones and NSPs, and serve as physical barriers that kill pathogens extracellularly, thus preventing further spreading. NET-associated NSPs participate in pathogen killing by degrading bacterial virulence factors extracellularly (Brinkmann et al., 2004;Papayannopoulos and Zychlinsky, 2009).
http://pharmrev.aspetjournals.org/content/62/4/726/F1.small.gif
Fig. 1.
Polymorphonuclear neutrophil. Quiescent (A) and chemically activated (B) neutrophils purified from peripheral blood. C, PMA-activated neutrophils embedded within NET and neutrophil spreading on insoluble elastin.
In addition to their involvement in pathogen destruction and the regulation of proinflammatory processes, NSPs are also involved in a variety of inflammatory human conditions, including chronic lung diseases (chronic obstructive pulmonary disease, cystic fibrosis, acute lung injury, and acute respiratory distress syndrome) (Lee and Downey, 2001; Shapiro, 2002; Moraes et al., 2003; Owen, 2008b). In these disorders, accumulation and activation of neutrophils in the airways result in excessive secretion of active NSPs, thus causing lung matrix destruction and inflammation. NSPs are also involved in other human disorders as a consequence of gene mutations, altered cellular trafficking, or, for PR3, autoimmune disease. Mutations in the ELA2/ELANE gene encoding HNE are the cause of human cyclic neutropenia and severe congenital neutropenia (Horwitz et al., 1999, 2007). Neutrophil membrane-bound proteinase 3 (mPR3) is the major target antigen of anti-neutrophil cytoplasmic autoantibodies (ANCA), which are associated with Wegener granulomatosis (Jenne et al., 1990). All three proteases are affected by mutation of the gene (CTSC) encoding dipeptidyl peptidase I (DPPI), which activates several granular hematopoietic serine proteases (Pham and Ley, 1999; Adkison et al., 2002). Mutations of CTSC cause Papillon-Lefèvre syndrome and palmoplantar keratosis (Hart et al., 1999; Toomes et al., 1999).
…….
Fully processed mature HNE, PR3, and CG isolated from azurophilic granules contain, respectively, 218 (Bode et al., 1986; Sinha et al., 1987), 222 (Campanelli et al., 1990b), and 235 (Salvesen et al., 1987; Hof et al., 1996) residues. They are present in several isoforms depending on their carbohydrate content, with apparent mass of 29 to 33 kDa upon SDS-polyacrylamide gel electrophoresis (Twumasi and Liener, 1977; Watorek et al., 1993). HNE and PR3 display two sites of N-glycosylation, whereas CG possesses only one. NSPs are stored mainly in neutrophil azurophilic granules, but HNE is also localized in the nuclear envelope, as revealed by immunostaining and electron microscopy (Clark et al., 1980;Benson et al., 2003), whereas PR3 is also found in secretory vesicles (Witko-Sarsat et al., 1999a). Upon neutrophil activation, granular HNE, PR3, and CG are secreted extracellularly, although some molecules nevertheless remain at the cell surface (Owen and Campbell, 1999; Owen, 2008a). The mechanism through which NSPs are sorted from the trans-Golgi network to the granules has not been completely defined, even though an intracellular proteoglycan, serglycin, has been identified as playing a role in elastase sorting and packaging into azurophilic granules (Niemann et al., 2007). Unlike HNE and CG, PR3 is constitutively expressed on the membranes of freshly isolated neutrophils (Csernok et al., 1990; Halbwachs-Mecarelli et al., 1995). Stimulation of neutrophils at inflammatory sites triggers intracytoplasmic granules to translocate to the phagosomes and plasma membrane, thereby liberating their contents. The first step of the translocation to the target membrane depends on cytoskeleton remodeling and microtubule assembly (Burgoyne and Morgan, 2003). This is followed by a second step of granule tethering and docking, which are dependent on the sequential intervention of SNARE proteins (Jog et al., 2007).
…….
Exposure of neutrophils to cytokines (TNF-α), chemoattractants (platelet-activating factor, formyl-Met-Leu-Phe, or IL-8), or bacterial lipopolysaccharide leads to rapid granule translocation to the cell surface with secretion of HNE, PR3, and CG into the extracellular medium (Owen and Campbell, 1999). A fraction of secreted HNE, PR3, and CG is detected at the surface of activated neutrophils (Owen et al., 1995a, 1997; Campbell et al., 2000). Resting purified neutrophils from peripheral blood express variable amounts of PR3 on their surface. A bimodal, apparently genetically determined, distribution has been observed with two populations of quiescent neutrophils that express or do not express the protease at their surface (Halbwachs-Mecarelli et al., 1995; Schreiber et al., 2003). The percentage of mPR3-positive neutrophils ranges from 0 to 100% of the total neutrophil population within individuals. Furthermore, the percentage of mPR3-positive neutrophils remains stable over time and is not affected by neutrophil activation (Halbwachs-Mecarelli et al., 1995).
The mechanism through which HNE and CG are associated with the outer surface of the plasma membrane of neutrophils mainly involves electrostatic interactions with the sulfate groups of chondroitin sulfate- and heparan sulfate-containing proteoglycans (Campbell and Owen, 2007). These two proteases are released from neutrophil cell surfaces by high concentrations of salt (Owen et al., 1995b, 1997;Korkmaz et al., 2005a) and after treatment with chondroitinase ABC and heparinase (Campbell and Owen, 2007). Membrane PR3 is not solubilized by high salt concentrations, which means that its membrane association is not charge dependant (Witko-Sarsat et al., 1999a; Korkmaz et al., 2009). Unlike HNE and CG, PR3 bears at its surface a hydrophobic patch formed by residues Phe166, Ile217, Trp218, Leu223, and Phe224 that is involved in membrane binding (Goldmann et al., 1999; Hajjar et al., 2008) (Fig. 3B). Several membrane partners of PR3 have been identified, including CD16/FcγRIIIb (David et al., 2005; Fridlich et al., 2006), phospholipid scramblase-1, a myristoylated membrane protein with translocase activity present in lipid rafts (Kantari et al., 2007), CD11b/CD18 (David et al., 2003), and human neutrophil antigen NB1/CD177 (von Vietinghoff et al., 2007; Hu et al., 2009), a 58- to 64-kDa glycosyl-phosphatidylinositol anchored surface receptor belonging to the urokinase plasminogen activator receptor superfamily (Stroncek, 2007). NB1 shows a bimodal distribution that superimposes with that of PR3 on purified blood neutrophils (Bauer et al., 2007). Active, mature forms of PR3 but not pro-PR3 can bind to the surface of NB1-transfected human embryonic kidney 293 cells (von Vietinghoff et al., 2008) and Chinese hamster ovary cells (Korkmaz et al., 2008b). Interaction involves the hydrophobic patch of PR3 because specific amino acid substitutions disrupting this patch in the closely related gibbon PR3 prevent binding to NB1-transfected cells (Korkmaz et al., 2008b). Decreased interaction of pro-PR3 with NB1-transfected cells is explained by the topological changes affecting the activation domain containing the hydrophobic patch residues. Together, these results support the hydrophobic nature of PR3-membrane interaction.
……..
Roles in Inflammatory Process Regulation
NSPs are abundantly secreted into the extracellular environment upon neutrophil activation at inflammatory sites. A fraction of the released proteases remain bound in an active form on the external surface of the plasma membrane so that both soluble and membrane-bound NSPs are able to proteolytically regulate the activities of a variety of chemokines, cytokines, growth factors, and cell surface receptors. Secreted proteases also activate lymphocytes and cleave apoptotic and adhesion molecules (Bank and Ansorge, 2001; Pham, 2006; Meyer-Hoffert, 2009). Thus, they retain pro- and anti-inflammatory activities, resulting in a modulation of the immune response at sites of inflammation.
…….
Processing of Cytokines, Chemokines, and Growth Factors.
Processing and Activation of Cellular Receptors.
Induction of Apoptosis by Proteinase 3.
Physiological Inhibitors of Elastase, Proteinase 3, and Cathepsin G
During phagocytosis and neutrophil turnover, HNE, PR3, and CG are released into the extracellular space as active proteases. The proteolytic activity of HNE, PR3, and CG seems to be tightly regulated in the extracellular and pericellular space to avoid degradation of connective tissue proteins including elastin, collagen, and proteoglycans (Janoff, 1985). Protein inhibitors that belong to three main families, the serpins, the chelonianins, and the macroglobulins, ultimately control proteolytic activity of HNE, PR3, and CG activities. The individual contributions of these families depend on their tissue localization and that of their target proteases. The main characteristics of HNE, PR3, and CG physiological inhibitors are presented in Table 2.
Serine Protease Inhibitors
Serpins are the largest and most diverse family of protease inhibitors; more than 1000 members have been identified in human, plant, fungi, bacteria, archaea, and certain viruses (Silverman et al., 2001; Mangan et al., 2008). They share a similar highly conserved tertiary structure and similar molecular weight of approximately 50 kDa. Human serpins belong to the first nine clades (A–I) of the 16 that have been described based on phylogenic relationships (Irving et al., 2000; Silverman et al., 2001; Mangan et al., 2008). For historical reasons, α1-protease inhibitor (α1-PI) was assigned to the first clade. Clade B, also known as the ov-serpin clan because of the similarity of its members to ovalbumin (a protein that belongs to the serpin family but lacks inhibitory activity), is the second largest clan in humans, with 15 members identified so far. Ov-serpin clan members are generally located in the cytoplasm and, to a lesser extent, on the cell surface and nucleus (Remold-O’Donnell, 1993).
Serpins play important regulatory functions in intracellular and extracellular proteolytic events, including blood coagulation, complement activation, fibrinolysis, cell migration, angiogenesis, and apoptosis (Potempa et al., 1994). Serpin dysfunction is known to contribute to diseases such as emphysema, thrombosis, angioedema, and cancer (Carrell and Lomas, 1997; Lomas and Carrell, 2002). Most inhibitory serpins target trypsin-/chymotrypsin-like serine proteases, but some, termed “cross-class inhibitors,” have been shown to target cysteine proteases (Annand et al., 1999). The crystal structure of the prototype plasma inhibitor α1-PI revealed the archetype native serpin fold (Loebermann et al., 1984). All serpins typically have three β-sheets (termed A, B, and C) and eight or nine α-helices (hA–hI) arranged in a stressed configuration. The so-called reactive center loop (RCL) of inhibitory molecules determines specificity and forms the initial encounter complex with the target protease (Potempa et al., 1994; Silverman et al., 2001). Serpins inhibit proteases by a suicide substrate inhibition mechanism. The protease initially recognizes the serpin as a potential substrate using residues of the reactive center loop and cleaves it between P1 and P1′ This cleavage allows insertion of the cleaved RCL into the β-sheet A of the serpin, dragging the protease with it and moving it over 71 Å to the distal end of the serpin to form a 1:1 stoichiometric covalent inhibitory complex (Huntington et al., 2000). Such cleavage generates a ∼4-kDa C-terminal fragment that remains noncovalently bound to the cleaved serpin. Displacement of the covalently attached active site serine residue from its catalytic partner histidine explains the loss of catalytic function in the covalent complex. The distortion of the catalytic site structure prevents the release of the protease from the complex, and the structural disorder induces its proteolytic inactivation (Huntington et al., 2000). Covalent complex formation between serpin and serine proteases triggers a number of conformational changes, particularly in the activation domain loops of the bound protease (Dementiev et al., 2006).
………
Pathophysiology of Elastase, Proteinase 3 and Cathepsin G in Human Diseases
In many instances, the initiation and propagation of lung damage is a consequence of an exaggerated inappropriate inflammatory response, which includes the release of proteases and leukocyte-derived cytotoxic products (Owen, 2008b;Roghanian and Sallenave, 2008). Inflammation is a physiological protective response to injury or infection consisting of endothelial activation, leukocyte recruitment and activation, vasodilation, and increased vascular permeability. Although designed to curtail tissue injury and facilitate repair, the inflammatory response sometimes results in further injury and organ dysfunction. Inflammatory chronic lung diseases, chronic obstructive pulmonary disease, acute lung injury, acute respiratory distress syndrome, and cystic fibrosis are syndromes of severe pulmonary dysfunction resulting from a massive inflammatory response and affecting millions of people worldwide. The histological hallmark of these chronic inflammatory lung diseases is the accumulation of neutrophils in the microvasculature of the lung. Neutrophils are crucial to the innate immune response, and their activation leads to the release of multiple cytotoxic products, including reactive oxygen species and proteases (serine, cysteine, and metalloproteases). The physiological balance between proteases and antiproteases is required for the maintenance of the lung’s connective tissue, and an imbalance in favor of proteases results in lung injury (Umeki et al., 1988; Tetley, 1993). A number of studies in animal and cell culture models have demonstrated a contribution of HNE and related NSPs to the development of chronic inflammatory lung diseases. Available preclinical and clinical data suggest that inhibition of NSP in lung diseases suppresses or attenuates the contribution of NSP to pathogenesis (Chughtai and O’Riordan, 2004; Voynow et al., 2008; Quinn et al., 2010). HNE could also participate in fibrotic lung remodeling by playing a focused role in the conversion of latent transforming growth factor-β into its biologically active form (Chua and Laurent, 2006; Lungarella et al., 2008).
Anti-Neutrophil Cytoplasmic Autoantibody-Associated Vasculitides
ANCA-associated vasculitides encompasses a variety of diseases characterized by inflammation of blood vessels and by the presence of autoantibodies directed against neutrophil constituents. These autoantibodies are known as ANCAs (Kallenberg et al., 2006). In Wegener granulomatosis (WG), antibodies are mostly directed against PR3. WG is a relatively uncommon chronic inflammatory disorder first described in 1931 by Heinz Karl Ernst Klinger as a variant of polyarteritis nodosa (Klinger, 1931). In 1936, the German pathologist Friedrich Wegener described the disease as a distinct pathological entity (Wegener, 1936, 1939). WG is characterized by necrotizing granulomatous inflammation and vasculitis of small vessels and can affect any organ (Fauci and Wolff, 1973; Sarraf and Sneller, 2005). The most common sites of involvement are the upper and lower respiratory tract and the kidneys. WG affects approximately 1 in 20,000 people; it can occur in persons of any age but most often affects those aged 40 to 60 years (Walton, 1958; Cotch et al., 1996). Approximately 90% of patients have cold or sinusitis symptoms that fail to respond to the usual therapeutic measures and that last considerably longer than the usual upper respiratory tract infection. Lung involvement occurs in approximately 85% of the patients. Other symptoms include nasal membrane ulcerations and crusting, saddle-nose deformity, inflammation of the ear with hearing problems, inflammation of the eye with sight problems, and cough (with or without hemoptysis).
Hereditary Neutropenias
Neutropenia is a hematological disorder characterized by an abnormally low number of neutrophils (Horwitz et al., 2007). The normal neutrophil count fluctuates across human populations and within individual patients in response to infection but typically lies in the range of 1.5 to 5 × 10⁹ cells/liter. Neutropenia is categorized as severe when the cell count falls below 0.5 × 10⁹ cells/liter. Hence, patients with neutropenia are more susceptible to bacterial infections and, without prompt medical attention, the condition may become life-threatening. Common causes of neutropenia include cancer chemotherapy, drug reactions, autoimmune diseases, and hereditary disorders (Berliner et al., 2004; Schwartzberg, 2006).
Papillon-Lefèvre Syndrome
……….
New Strategies for Fighting Neutrophil Serine Protease-Related Human Diseases
Administration of therapeutic inhibitors to control unwanted proteolysis at inflammation sites has been tested as a therapy for a variety of inflammatory and infectious lung diseases (Chughtai and O’Riordan, 2004). Depending on the size and chemical nature of the inhibitors, they may be administered orally, intravenously, or by an aerosol route. Whatever the mode of administration, the access of therapeutic inhibitors to active proteases is often hampered by physicochemical constraints in the extravascular space and/or by the partitioning of proteases between soluble and solid phases.
……….
Concluding Remarks
NSPs were first recognized as protein-degrading enzymes but have now proven to be multifunctional components participating in a variety of pathophysiological processes. Thus, they appear as potential therapeutic targets for drugs that inhibit their active site or impair activation from their precursor. Overall, the available preclinical and clinical data suggest that inhibition of NSPs using therapeutic inhibitors would suppress or attenuate deleterious effects of inflammatory diseases, including lung diseases. Depending on the size and chemical nature of inhibitors, those may be administered orally, intravenously, or by aerosolization. But the results obtained until now have not been fully convincing because of the poor knowledge of the biological function of each protease, their spatiotemporal regulation during the course of the disease, the physicochemical constraints associated with inhibitor administration, or the use of animal models in which NSP regulation and specificity differ from those in human. Two different and complementary approaches may help bypass these putative problems. One is to target active proteases by inhibitors at the inflammatory site in animal models in which lung anatomy and physiology are close to those in human to allow in vitro and in vivo assays of human-directed drugs/inhibitors. The other is to prevent neutrophil accumulation at inflammatory sites by impairing production of proteolytically active NSPs using an inhibitor of their maturation protease, DPPI. Preventing neutrophil accumulation at the inflammatory sites by therapeutic inhibition of DPPI represents an original and novel approach, the exploration of which has just started (Méthot et al., 2008). Thus pharmacological inactivation of DPPI in human neutrophils could well reduce membrane binding of PR3 and, as a consequence, neutrophil priming by pathogenic auto-antibodies in WG. In addition, it has been recognized that the intracellular level of NSPs depends on their correct intracellular trafficking. In the future, pharmacological targeting of molecules specifically involved in the correct intracellular trafficking of each NSP could possibly regulate their production and activity, a feature that could be exploited as a therapeutic strategy for inflammatory diseases.
…….


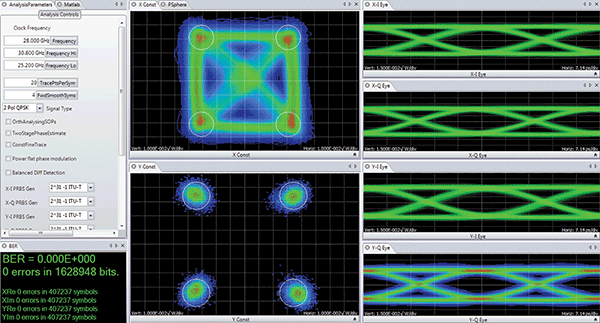