Feeds:
Posts
Comments

Archive for December, 2013

Innovators can exit with an idea How to Monetizing Patents and ideas: yazamIP.com launches Idea Lab

Reporter: Aviva Lev-Ari, PhD, RN

 The IDEA as Entry and as Exit Point

1. yazamIP.com launches Idea Lab, enabling innovators to exit without necessarily establishing a startup.

If you: (A) have a track record of innovation and have a solution for a significant technical problem, and (B) are interested in either of the options below, both have no cost to you: (i) a $1,000,000 “exit” from your idea without necessarily leaving your “day-job”; (ii) having proven innovation, patent and business experts work with you to establish a robust patent portfolio based on your idea. And you maintain the option to spin off the strong portfolio into a startup for you to build the market.

Then yazamIP.com’s Idea Lab is for you. See http://www.yazamip.com/valuations

2. Tel Aviv University’s Ramot raises $17m from Tata & SanDisk.http://yazamip.com/node/84

3. Elvis Presley IP sells. http://yazamip.com/node/82

4. Innovation and patents are helping to increase gun sales.http://yazamip.com/node/85

Want to get a valuation on your patent? See http://yazamip.com/valuations

Do not forget to contact yazamIP.com to inquire about our most generous “referral a patent” fee arrangement.

NEWS AND DEVELOPMENTS from yazamIP.com
1. yazamIP.com launches patent valuation service. http://www.yazamip.com/valuations2. yazamIP.com client initiates patent infringement action against Sony.http://www.yazamip.com/node/74

3. Twitter has only 9 patents pre-IPO, a fact that has investors worried.http://www.yazamip.com/node/73

4. Marijuana-related patents? Now that is a market to corner!http://www.yazamip.com/node/77

SERVICES
  1. If the companies are in distress and have US patents then we can sell them for the inventor
  2. If the patents are being infringed upon, we can see how we can help the inventor get compensated
  3. If the inventors have great ideas that they have not turned into companies yet, we would consider investing in them to convert the ideas into patent portfolios

Reply to

“Monte Silver, yazamip.com, Idea Lab” <info@yazamip.com>

SOURCE

From: “Monte Silver, yazamip.com, Idea Lab via LinkedIn” <member@linkedin.com>
Reply-To: “Monte Silver, yazamip.com, Idea Lab” <info@yazamip.com>
Date: Sun, 8 Dec 2013 13:51:06 +0000 (UTC)
To: “Aviva Lev-Ari, PhD, RN” <AvivaLev-Ari@alum.berkeley.edu>
Subject: yazamIP.com launches Idea Lab.  Innovators can exit with an idea

Read Full Post »

In Cambridge, MA — Boehringer Ingelheim Venture Fund Gmbh Establishes U.S. Operations

Reporter: Aviva Lev-Ari, PhD, RN

Ridgefield, Conn., (December 2, 2013):  Boehringer Ingelheim today announced that the Boehringer Ingelheim Venture Fund GmbH (BIVF) has opened a U.S. office in the premier biotech hub of Kendall Square in Cambridge, Mass. BIVF is a private equity fund created to invest in biotech and start-up companies which provide ground-breaking therapeutic approaches and technologies to help drive innovation in medical science.

The U.S. office will be led by Martin Heidecker, who will operate from Cambridge as well as Boehringer Ingelheim’s Fremont, California site, located in the heart of the San Francisco Bay Area biotech cluster. BIVF will invest up to approximately $13 million dollars per company, with a total fund volume of $130 million dollars.

“What makes BIVF unique is that we can help establish companies from the beginning, which can foster a conducive environment for innovation and enable greater success. Our U.S. presence means more opportunities for break-through biomedical initiatives, and we are looking forward to uncovering top talent in this exciting and entrepreneurial U.S. market,” said Heidecker.

BIVF will provide added-value expertise beyond capital investment, leveraging Boehringer Ingelheim’s extensive drug discovery, scientific and managerial proficiency. The team will specifically seek out investment opportunities unrelated to Boehringer Ingelheim’s key therapeutic areas.  BIVF’s ultimate goal is to enhance those companies invested in, delivering success for them and generating revenues to finance further new investment to benefit patients.

About Boehringer Ingelheim
The Boehringer Ingelheim group is one of the world’s 20 leading pharmaceutical companies. Headquartered in Ingelheim, Germany, it operates globally with 140 affiliates and more than 46,000 employees. Since it was founded in 1885, the family-owned company has been committed to researching, developing, manufacturing and marketing novel medications of high therapeutic value for human and veterinary medicine.

Social responsibility is a central element of Boehringer Ingelheim’s culture. Involvement in social projects, caring for employees and their families, and providing equal opportunities for all employees form the foundation of the global operations. Mutual cooperation and respect, as well as environmental protection and sustainability are intrinsic factors in all of Boehringer Ingelheim’s endeavors.

In 2012, Boehringer Ingelheim achieved net sales of about $19.1 billion (14.7 billion euro). R&D expenditure in the business area Prescription Medicines corresponds to 22.5% of its net sales.

For more information please visit www.us.boehringer-ingelheim.com.

SOURCE


Read Full Post »

Larry, H. Bernstein, MD, FCAP, Author and Curator
Http://pharmaceuticalintelligence.com/2013-12-4/larryhbern/Vitamin_D_-_Binding_Protein_and_Vitamin_D_Status

Vitamin D–Binding Protein and Vitamin D Status of Black Americans and White Americans

CE Powe, MK Evans, J Wenger, AB Zonderman, AH Berg, M Nalls, H Tamez, et al.
N Engl J Med 21 Nov,2013; 369:1991-2000
http://dx.doi.org/10.1056/NEJMoa1306357

Summary

BACKGROUND

Low levels of total 25-hydroxyvitamin D are common among black Americans. Vitamin D–binding protein has not been considered in the assessment of vitamin D deficiency.

METHODS

In the Healthy Aging in Neighborhoods of Diversity across the Life Span cohort of blacks and whites (2085 participants), we measured
  • levels of total 25-hydroxyvitamin D,
  • vitamin D–binding protein, and
  • parathyroid hormone as well as
  • bone mineral density (BMD).

We genotyped study participants for two common polymorphisms in the vitamin D–binding protein gene (rs7041 and rs4588). We estimated levels of bioavailable 25-hydroxyvitamin D in homozygous participants. 

RESULTS

Mean (±SE) levels of both total 25-hydroxyvitamin D and vitamin D–binding protein were lower in blacks than in whites (total 25-hydroxyvitamin D, 15.6±0.2 ng per milliliter vs. 25.8±0.4 ng per milliliter, P<0.001; vitamin D–binding protein, 168±3 μg per milliliter vs. 337±5 μg per milliliter, P<0.001).
  • Genetic polymorphisms independently appeared to explain 79.4% and 9.9% of the variation in levels of vitamin D–binding protein and total 25-hydroxyvitamin D, respectively.
  • BMD was higher in blacks than in whites (1.05±0.01 g per square centimeter vs. 0.94±0.01 g per square centimeter, P<0.001).
  • Levels of parathyroid hormone increased with decreasing levels of total or bioavailable 25-hydroxyvitamin D (P<0.001 for both relationships),
    • yet within each quintile of parathyroid hormone concentration, blacks had significantly lower levels of total 25-hydroxyvitamin D than whites.

Among homozygous participants, blacks and whites had similar levels of bioavailable 25-hydroxyvitamin D overall (2.9±0.1 ng per milliliter and 3.1±0.1 ng per milliliter, respectively; P=0.71) and

  • within quintiles of parathyroid hormone concentration.

CONCLUSIONS

Community-dwelling black Americans, as compared with whites, had low levels of total 25-hydroxyvitamin D and vitamin D–binding protein,
  • resulting in similar concentrations of estimated bioavailable 25-hydroxyvitamin D.

Racial differences in the prevalence of common genetic polymorphisms provide a likely explanation for this observation. (Funded by the National Institute on Aging and others.)


Read Full Post »

Larry, H. Bernstein, MD, FCAP, Author and Curator

http://pharmaceuticalintelligence.com/2013-12-04/larryhbern/Reprogramming_Induced_Pleuripotent_Stem_Cells

Picking the Lock on Pluripotency

Kevin Eggan, Ph.D.
N Engl J Med 28 Nov 2013; 369:2150-2151 http://dx.doi.org/10.1056/NEJMcibr1311880

Induced pluripotent stem (iPS) cells are obtained by reprogramming somatic cells. This powerful disease-modeling research tool is central to certain experimental approaches to therapy. A recent study showed that iPS cells can be generated with a very high degree of efficiency.

FIGURE 1  http://dx.doi.org/nejmcibr1311880_f1

nejmcibr1311880_f1   A Potent Provision of Induced Pluripotent Stem Cells.

A Potent Provision of Induced Pluripotent Stem Cells

Generation of Induced Pluripotent Stem Cells from CD34+ Cells across Blood Drawn from Multiple Donors with Non-Integrating Episomal Vectors

AA Mack, S Kroboth,  D Rajesh,  Wen Bo Wang
Published: November 22, 2011  PLoS ONE 6(11): e27956   http://dx.doi.org/10.1371/journal.pone.0027956

The methodology to create induced pluripotent stem cells (iPSCs) affords the opportunity to generate cells specific to the individual providing the host tissue. However, existing methods of reprogramming as well as the types of source tissue have significant limitations that preclude the ability to generate iPSCs in a scalable manner from a readily available tissue source. We present the first study whereby iPSCs are derived in parallel from multiple donors using episomal, non-integrating, oriP/EBNA1-based plasmids from freshly drawn blood. Specifically, successful reprogramming was demonstrated from a single vial of blood or less using cells expressing the early lineage marker CD34 as well as from unpurified peripheral blood mononuclear cells. From these experiments, we also show that proliferation and cell identity play a role in the number of iPSCs per input cell number. Resulting iPSCs were further characterized and deemed free of transfected DNA, integrated transgene DNA, and lack detectable gene rearrangements such as those within the immunoglobulin heavy chain and T cell receptor loci of more differentiated cell types. Furthermore, additional improvements were made to incorporate completely defined media and matrices in an effort to facilitate a scalable transition for the production of clinic-grade iPSCs.

Citation: Mack AA, Kroboth S, Rajesh D, Wang WB (2011) Generation of Induced Pluripotent Stem Cells from CD34+ Cells across Blood Drawn from Multiple Donors with Non-Integrating Episomal Vectors. PLoS ONE 6(11): e27956. doi:10.1371/journal.pone.0027956

Introduction

Fibroblasts have been a predominate source material for the development of the process to generate induced pluripotent stem cells (iPSCs) given their ability to expand, endure for multiple passages in culture, and receptiveness to efficient infection by viruses expressing a combination of transcription factors for reprogramming [1]–[6]. However, fibroblasts from skin biopsies require invasive surgical procedures, are labor intensive and isolating a sufficient number for reprogramming takes time. In addition, the ability to generate iPSCs from skin appears inversely correlated with the age of the donor likely due to increasing exposure to external mutagens [7]. There is value, therefore, in alternative tissue sources to generate iPSCs that minimize the risk for additional mutation, involve less invasive procedures, and are amenable to industrialization to increase availability across an extensive population range.


A blood draw is an ideal starting point to generate donor-specific iPSCs because it is minimally invasive and established procedures are already in place for acquisition and handling [8]. Lymphocytes comprise a large fraction of the peripheral blood mononuclear cell (PBMC) population but pose at least two potential limitations. First, they are subject to intrinsic DNA rearrangements such as those that occur in B and T cells at the V, D, and J gene segments as well as T cell receptor (TCR) loci to generate a diverse repertoire of antigen-specific surface immunoglobulins. These rearrangements are subsequently perpetuated in iPSCs generated from them and their impact on iPSC function is currently unknown [9], [10]. Second, some research has indicated that host cell types may influence functional properties of iPSCs [11], [12]. For example, while embryonic stem (ES) cells and progenitor cells derived from bone marrow successfully differentiate into B cells, iPSCs derived from B cells have demonstrated resistance to this ability [13], [14], [15]. Therefore, choosing an early lineage cell type that lacks DNA rearrangements alleviates the potential risk of reduced ability to differentiate.

Somatic cells that are characteristically more progenitor-like with respect to the expression of early lineage markers, such as CD34, appear more susceptible to reprogramming, and they too can be isolated from blood [16]. For example, Haase and colleagues successfully isolated and reprogrammed early progenitor cells isolated from cord blood. The ability to reprogram cells from peripheral blood, however, expands the range of host cells available for reprogramming especially when acquisition of cord blood-derived material is not an option. However, the amount of CD34+ cells represents less than 0.1% of the population of PBMCs thus limiting the amount of source material available for reprogramming. To generate enough starting material to perform reprogramming trials, Loh and colleagues relied on patients treated with granulocyte-colony stimulating factor (G-CSF) to expand the number of CD34+ cells in circulating peripheral blood and ultimately generated iPSCs from these cells [17]. The acquisition of blood that does not require donors to receive these agents would be more desirable to avoid the negative side effects associated with them [18]. Studies have also shown that cells from mobilized blood demonstrate functional differences when compared with cells from non-mobilized samples indicating changes to properties intrinsic to the cell [19]. For example, epigenetic and genetic anomalies (i.e. aneuploidy) have been detected in cells derived from patients mobilized with G-CSF [20], [21]. These observations increase the likelihood that similar genetic modifications would carry over into iPSCs generated from mobilized CD34+ cells and potentially impact their function.

The method to generate iPSCs from cord and mobilized peripheral blood has predominately relied on viral-based methods to introduce reprogramming factors [16], [17]. Resulting clones thus have transgenes integrated into their genomes that may alter the function of iPSCs, increase the risk of cancer, and hinder their potential for clinical application. Improvements to reprogramming methods have been made to eliminate integrated transgenes including a recent study examining the reprogramming potential of blood-derived cells using a previously described episomal, oriP/EBNA1-based transfection method [2], [22], [23]. We capitalized on the oriP/EBNA1-method but made modifications to accommodate the reprogramming of CD34+ cells derived from actual vials of blood collected across multiple donors. The oriP/EBNA1-based vectors contribute to the replication and retention of plasmids during each cell division long enough for reprogramming to occur and are lost over time resulting in cells free of transfected DNA and integrated transgenes [24], [25]. Importantly, reprogramming can be achieved through a single transfection. Herein we demonstrate the ability to generate iPSCs from a single vial of blood or less using an improved process of reprogramming that incorporates fully defined conditions to generate iPSCs free of gene rearrangements and transgene elements.

Results


Hematopoietic progenitor cells from non-mobilized, peripheral blood are expandable


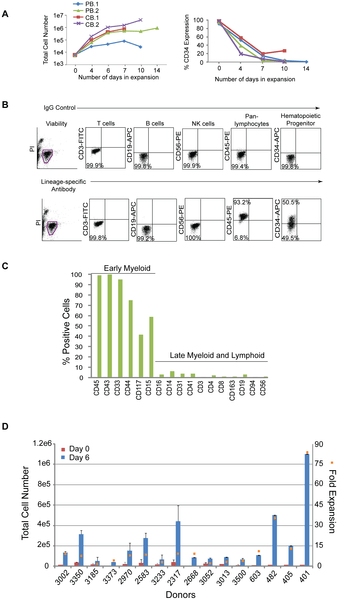
Hematopoietic progenitor cells expressing CD34 represent a small fraction of the population and limit the number of cells available for reprogramming; therefore, a modified formulation of a media used to expand cord blood cells was tested on CD34+ cells isolated from peripheral blood [26]. CD34+ cells from two non-mobilized, peripheral (PB.1 and PB.2) blood donors were tested in comparison to CD34+ cells from two cord blood donors (CB.1 and CB.2). Cells were placed into untreated, 24-well culture plates at 1.2×10⁴ per ml of expansion media (StemSpan basal medium; 300 ng/ml each of SCF, Flt3, TPO; 100 ng/ml IL-6; 10 ng.ml IL-3) and fed 3 to 4 days later. The total number of cells from peripheral blood expanded 170-fold and 680-fold from cord blood after 10 to 14 days in culture (Figure 1A, left hand panel). The percentage of CD34+ cells in the peripheral and cord blood samples peaked in less than 1 week (CB data not shown; Figure 1A, right hand panel). The expression profile of expanding populations was determined by flow cytometry for all donors examined herein (Figure 1B). Phenotypic analysis of the resulting peripheral blood culture PB.2 after 10 days of expansion revealed predominately early progenitor cells expressing CD43, CD45, CD33, CD44, CD15, and CD117 and marginal levels of T (CD3, CD4, CD8), NK (CD56, CD94), B (CD19), macrophage (CD163), megakaryocyte (CD41), and monocyte (CD14) cells (Figure 1C).

Figure 1. Hematopoietic cells enriched for CD34 expression are expandable.
journal.pone.0027956.g001  Figure 1. Hematopoietic cells enriched for CD34 expression are expandable


A. Graphs depict the expansion of purified cells from either two peripheral (PB.1 and PB.2) or cord (CB.1 or CB.2) blood donors over time (lefthand panel) along with the percentages of the total population that are CD34+ (righthand panel). B. Representative profile of a purified population of cells after 6 days of expansion by flow cytometry on cells isolated from Donor 3002. Flow cytometry plots from control staining using IgG antibodies (upper plots) are compared to plots with antibodies specific to lineage markers (lower plots). C. The graph represents an extended analysis by flow cytometry of the characteristic profile of PB.2 cells after 10 days of expansion. The % positive indicates the fraction of the population expressing the cell surface markers on the x-axis. D. The total number of CD34+ cells across 16 different donors was assessed beginning at 0 and 6 days of expansion (left side y-axis). The fold expansion (right side y-axis, orange squares) was determined by dividing the total number of cells at day 6 divided by the number of cells at day 0 after purification. The average percent of CD34 expression across all 16 donors was 48+/−19%.     http://dx.doi.org/10.1371/journal.pone.0027956.g001

These expansion conditions were then applied to cells acquired from a single vial of blood collected from multiple donors. PBMCs were isolated, frozen down immediately, or directly purified for CD34+ cells and seeded for expansion. On average, 1×10⁷ PBMCs were recovered per 8 ml vial of blood and yielded approximately 2×10⁴ cells after purification for CD34-expressing cells (data not shown). Although the magnitude of expansion was variable, cells from all of the donors demonstrated expansion ranging from 3 to 83-fold after 6 days in culture and approximately 48+/−19% of that population expressed CD34 (Figure 1D).

Optimizing the generation of iPSCs with small molecules and a defined matrix

The total number of purified cells isolated from a single, 8 ml vial of blood can be as little as 2×10⁴ CD34+ cells; therefore, a range of CD34+ cell numbers was tested to determine transfection efficiency from low cell numbers. The efficiency of transfection was determined by transfecting an oriP/EBNA1-containing plasmid encoding GFP into expanded CD34+ cells and assessing them by flow cytometry. Viability was determined by identifying the fraction of viable cells that did not stain positively for trypan blue the day after transfection divided by the total number of input cells. Viability was approximately 30% when 1×10⁴ to 1×10⁵ input cells were used for transfection (data not shown). Cell numbers at 1×10⁴ and 3×10⁴ resulted in an efficiency of 30% and was 40% when using 6×10⁴ and 1×10⁵ cells (Figure 2A). Cells expanded for only 3 days demonstrated a two-fold increase in transfection efficiency. Over 90% of those cells also co-expressed GFP and CD34 while only 18% of the cells transfected after 6 days of expansion co-expressed both markers (Figure 2B, C). These results support the notion that the conditions selected for this protocol favor the transfection of CD34+ cells present in the population.

Figure 2. Identifying optimal transfection conditions for CD34+ cells.

journal.pone.0027956.g002   Figure 2. Identifying optimal transfection conditions for CD34+ cells.

A. PBMCs (donor GG) were isolated and purified for CD34-expression and expanded for 6 days. A range of cell numbers were transfected with a control, oriP/EBNA1-based plasmid expressing GFP. Transfection efficiency was determined by calculating the percentage of viable cells expressing GFP detectable by flow cytometry (n = 6). B. PBMCs (donor A2389) were isolated, purified for CD34-expression and expanded for 3 or 6 days. 6×10⁴ to 1×10⁵ cells were transfected with the control, GFP-expressing plasmid. The graph depicts the percent of the total population that is GFP-positive along with the absolute number of total cells (n = 3). C. The graph represents the fraction of cells in B that co-express GFP and CD34 when transfected at 3 or 6 days of expansion (n = 3).    http//dx.doi.org/10.1371/journal.pone.0027956.g002

We anticipated variability in reprogramming efficiency given the differences already observed across donors for other cell types tested and with other methods of reprogramming. Therefore, we optimized the matrix, media, and plasmid combinations used for reprogramming. Firstly, a common source of variation occurs when MEFs or matrigel are used because both are undefined, cumbersome to prepare, and vary from lot-to-lot. Therefore, we established a defined matrix by testing a variety of commercially available possibilities. Recombinant protein fragments containing the active domains of human fibronectin (RetroNectin) or vitronectin consistently supported iPSC formation the best among those tested. Second, the efficiency of colony formation on RetroNectin-coated plates improved significantly when used in combination with StemSpan SFEM media, N2, B27, and a cocktail of small molecules that included PD0325901, CHIR99021, A-83-01, and HA-100 (Figure 3A). These molecules have been described previously as inhibitors of MEK, GSK3β, TGFβ, and ROCK pathways, respectively [27], [28]. Patches of adherent cells appeared within one week and became a positive indicator for progression into iPSCs since hematopoietic cells are typically cultured in suspension. The following week many of the colonies exhibited overt characteristics typical of an iPSC and stained positively for the common pluripotency markers Tra-1-81 and alkaline phosphatase (AP) (Figure 3A). The borders of the colonies were compact and the nucleoli more visible when cultures were transitioned to defined, TeSR2 media without small molecules 1.5 to 2 weeks following transfection. Thirdly, episomal oriP/EBNA1-based plasmids were used to deliver Oct4, Sox2, Klf4, C-myc, Nanog, Lin28, and SV40 Large T-antigen as previously described (Set 1; Figure 3B) [2]. Different combinations of reprogramming plasmids were also tested to determine whether a boost in reprogramming efficiency was possible. Based on previous reports indicating the benefit of L-myc in reprogramming trials, we modified plasmid combination Set 1 and substituted L-myc in place of C-myc (Set 2, Figure 3B) [29], [30]. While an improvement was not observed when C-myc was substituted for L-myc in the combination of plasmids represented in Set 1 (data not shown), an equal to or two-fold improvement was observed with plasmid Set 2 expressing L-myc (Figure 3C). Optimizing a range of input cell numbers for transfection also revealed more consistent generation of iPSCs when transfecting greater than 5×10⁴ cells (Figure 3D).

Figure 3. Plasmid transfections to optimize reprogramming efficiency.

journal.pone.0027956.g003  Figure 3. Plasmid transfections to optimize reprogramming efficiency.

A. Representative reprogramming trial from freshly drawn blood (donor 3002) using combination plasmid Set 2 for transfection. A single well is shown from a 6-well plate that contains colonies staining positively for AP activity (i). The white arrowhead highlights the colony magnified in panel ii that also stained positively for Tra-1-81 expression (green), panel iii. B. Schematic of the plasmid sets successfully used for reprogramming trials. Set 1 contains a combination of two plasmids for transfection whereby a 20 kb plasmid that either contains C- or L-myc is depicted. Set 2 includes a three plasmid combination for transfection. C. CD34+ cells purified from four different donors were expanded for 6 days and transfected using the plasmid combination that expresses either Set 1 or Set 2 plasmid sets to compare the total number of resulting iPSCs. D. Reprogramming trials were performed using plasmid Set 2 to transfect a range of cell numbers expanded for 6 days (donor GG, n = 6).  http://dx.doi.org/10.1371/journal.pone.0027956.g003


Optimization of iPSCs generated from CD34+ cells isolated from fresh, whole blood across multiple donors

The next step was to confirm iPSCs could be generated from actual vials of human blood, ensure cell numbers optimized for expansion and transfection are applicable across multiple donors, and determine whether the starting volume of blood can be minimized. Colonies emerging during reprogramming were scored positive by their ability to express Tra1-81 and exhibit a classic embryonic stem (ES) cell-like morphology. After colonies were picked from the reprogramming cultures, a subset of them were further characterized to confirm their pluripotency. Reprogramming efficiency was calculated in two ways 1) the number of iPSCs divided by the total volume of blood collected from each donor and 2) the total number of iPSCs divided by the number of cells for transfection multiplied by 1×10⁵ cells. The first calculation incorporates the whole process beginning from the blood collection to the generation of an iPSC. The second calculation removes the variability incurred during the isolation of PBMCs, purification, and expansion and focuses on the number of iPSCs generated per number of cells placed into transfection.

We tested blood collected across donors spanning a range of ethnicities, ages, and genders to confirm iPSCs could be generated from CD34+ cells purified from fresh blood draws (Table 1). Six of these donors provided up to 55 ml of blood, and PBMCs from them were either isolated and used directly for purification, expansion, and reprogramming or frozen down after isolation. iPSCs were successfully generated from all six donors regardless of whether they were from fresh or frozen cells despite the lower efficiency of reprogramming, less than 1 iPSC per ml of blood (Table 2). Next, smaller volumes of blood representative of a single vial were obtained from six different donors to test parameters established in earlier experiments such as the number of cells for transfection and plasmid combinations. The cell numbers used for transfection from donors 3052, 3233, and 3373 ranged from 2×10⁴ to 4×10⁴ which fall below the minimum, 5×10⁴ cells, established with our optimization studies. These experiments resulted in less than one iPSC per ml of blood (Table 2). Also, transfections with cells from donors 2583, 2970, and 3185 represent early trials performed with plasmid Set 1 expressing C-myc before Set 2 plasmids expressing L-myc were fully optimized which may have resulted in more iPSCs.

Table 1. Diversity across the set of donors used for reprogramming trials to generate iPSCs.
http://dx.doi.org/10.1371/journal.pone.0027956.t001

Table 2. Optimizing reprogramming from a range of blood volumes across multiple donors.
http://dx.doi.org/10.1371/journal.pone.0027956.t002

The next step was to then extend the insights acquired from these donors and verify the robustness of our protocol against ten new donors. The average number of iPSCs per ml of blood and per 1×10⁵ cells across these donors indeed improved after incorporating experience with handling and the testing performed on the earlier donor samples (Table 3). Furthermore, these experiments were extended to test even smaller volumes of blood from a subset of the same donors in Table 3. CD34+ cells purified from approximately 4 ml of blood were sufficient to generate iPSCs from all six donors tested, and CD34+ cells from approximately 2 ml of blood from four out of six of these donors generated iPSCs (Table 4). These results demonstrate that iPSCs can be generated from CD34+ isolated from tractable volumes of blood using this non-intergrating and feeder-free method of reprogramming.

Table 3. Improved reprogramming across multiple donors from a single vial of blood.
http://dx.doi.org/10.1371/journal.pone.0027956.t003


Table 4. The efficiency of reprogramming CD34+ cells beginning from 4 ml of blood or less.
http://dx.doi.org/10.1371/journal.pone.0027956.t004


iPSCs derived from peripheral blood are pluripotent and free of transgene elements

Multiple iPSCs from each of the donors that were reprogrammed from Tables 2, 3, and 4 were selected for further characterization to confirm their pluripotency. The clones exhibited a normal karyotype, were positive for Tra-1-81 and SSEA-4 expression by flow cytometry as well as endogenous genes DNMT3B, REX1, TERT, UTF1, Oct4, Sox2, Nanog, Lin28, Klf4, and C-myc (Table 5, Figure 4A–C). Clones did not exhibit integrated transgene or episomal elements and loss of episomal DNA occurred, on average, within 7–10 passages (Table 5, Figure 4D,E). A PCR screen did not reveal rearrangements pertaining to immunoglobulin heavy chain (IgH) or a subset of T cell receptor (TCR) gene segments (Table 5, Figure 4F). The lack of rearrangements supports the notion that the protocol selectively favors the production of iPSCs from hematopoietic progenitors rather than more differentiated cell types. When used for in vitro directed differentiation at passage 15, donor 2939 iPSC clones 4 and 5, which have lost episomal plasmids, were competent to form neurons (Figure 5G). Furthermore, five iPS clones from three different donors also formed teratomas after injection into immunodeficient (SCID) mice (Figure 4G). Interestingly, the presence of residual episomal plasmids did not appear to hinder the ability to form teratomas since clone 6 from donor 2970 did not lose transfected plasmids until passage 18, well after injection into mice for teratoma studies.

Figure 4. Characterization of iPSCs derived from CD34+ blood cells.

journal.pone.0027956.g004  Figure 4. Characterization of iPSCs derived from CD34+ blood cells.

A subset of iPSC clones were characterized for pluripotency. The experiments demonstrated in this figure provide representative examples of the types of results observed for characterization studies using iPS clones 4 and/or 5 derived from donors 2939 and 3389. A. Cytogenetic analysis on G-banded metaphase cells from iPS clone 4 exhibiting a normal karyotype. B and C. RT-PCR confirms the endogenous expression of classic pluripotency genes and the absence of expression from transgenes. A standard in-house iPS line served as the positive control k. D. Clones were deemed free of episomal (E) DNA and genomic integration (G) by PCR. E. PCR was used to track the loss of oriP/EBNA1-based plasmids at multiple passages using primers that amplify EBNA1. A control plasmid at 1 and 20 copies per genome was used to establish the sensitivity of the PCR at 1 copy per 3,000 cells. F. PCR screen using primers specific for the joining region and all three of the conserved framework regions (FR1, FR2 and FR3) to amplify immunoglobulin heavy chain (IgH) gene rearrangements and two assays with primers specific to the T cell receptor (TCR) gamma gene rearrangement. G. Representative image of donor 2939 clone 5 differentiated in vitro into neurons (i). Clone 5 also demonstrated differentiation into all three germ layers: ii) epithelium iii) endoderm iv) mesoderm v) ectoderm vi) endoderm from teratomas formed when iPSCs were injected into immunodeficient, SCID mice.
http://dx.doi.org/10.1371/journal.pone.0027956.g004

Figure 5. The presence of CD34+ cells correlates with reprogramming efficiency.

journal.pone.0027956.g005  Figure 5. The presence of CD34+ cells correlates with reprogramming efficie

A. CD34+ cells from four different blood donors were expanded for 3, 6, 9, or 13 days. A large volume of blood was collected from donors 3096, 2849, and 3389 to ensure sufficient cell numbers to perform these studies. Expanding CD34+ cells using plasmid DNA combination Set 2. The efficiency of reprogramming was calculated as the total number of iPSCs exhibiting morphological features characteristic of an ES cell and an ability to stain positively for Tra-1-81 divided by the total number of cells used for transfection. Black Squares depict the percentage of the population expressing CD34 at the indicated days of expansion. B. Representative reprogramming trial whereby both the positive (i) and negative (ii) fraction following purification were used for reprogramming. Panel (i) shows one well of a 6-well plate that contains successfully reprogrammed colonies from donor 2939 based on their ability to demonstrate AP activity. The CD34-depleted fraction from donor 2939 was unable to form colonies as indicated by the lack of AP staining when performed in parallel with the purified population panel, ii. Panels iii and iv magnify the colony in panel (i) marked by a white arrowhead and demonstrates expression of Tra-1-81 (green), panel iv.
http://dx.doi.org/10.1371/journal.pone.0027956.g005

Table 5. Characterization of insert-free iPS clones derived from fresh blood.
http://dx.doi.org/10.1371/journal.pone.0027956.t005

Reprogramming efficiency correlates with the amount of CD34-expression

The isolation of CD34+ cells from PBMCs creates an additional step in our process and others have demonstrated successful reprogramming directly from PBMCs without the need for purification [22]. Therefore, several experiments to determine whether a correlation exists between CD34+ cells and reprogramming efficiency were performed. First, the expanding CD34+ populations were screened by flow cytometry for characterization prior to transfection. T, B, and NK cells were undetectable after 3 and 6 days of expansion demonstrated by their lack of CD3, 19, and 56 expression, respectively. The percentage of CD34 expression during expansion ranged from 30 to 100%, thus increasing the likelihood of reprogramming more of an early lineage cell type (n = 9, data not shown). Second, samples were taken from the purified populations during expansion at different timepoints as they lost CD34 expression to determine their receptiveness to reprogramming. A decrease in reprogramming efficiency was observed in correlation with decreasing percentages of CD34 expression across populations of cells from four independent donors (Figure 5A). For example, donor 3096 exhibited only 1 iPSC per 1×10⁵ input cells when beginning from cells expanded for 13 days (31% CD34+) compared to 91.5 iPSCs per 1×10⁵ cells following 3 days when levels of CD34 expression were much higher, 98% (Figure 5B). Third, populations depleted of CD34+ cells were tested for their ability to reprogram in parallel with their CD34+ cell counterparts. These CD34-depleted populations were not receptive to reprogramming as the CD34+ cells even when the same media and transfection conditions were used (n = 3, Figure 5B). Finally, a side-by-side comparison of reprogramming efficiency was performed between unpurified PBMCs and CD34+ cells isolated from 10 different donors. A medium described previously for the expansion of erythroblasts and for successful reprogramming studies was used to ensure media would not be a limiting factor for reprogramming the PBMCs in our protocol [22], [31]. Reprogramming trials beginning from either PBMCs or CD34+ cells were launched in parallel using their respective media for expansion. The efficiency of reprogramming was approximately 2 to 8 fold higher when beginning with cells purified for CD34 expression in 9 out of the 10 donors compared to those from PBMCs (p = 0.007; Figure 6). A significant fraction of the PBMC population was comprised of lymphocytes (~79+/−14% CD3/CD19) at the time of transfection (data not shown); therefore, PCR was performed to screen for potential IgH and TCR gene rearrangements to determine whether both protocols promoted the generation of iPSCs free of gene rearrangements. Interestingly, screened clones from either cell type were free of IgH and TCR gene rearrangements indicating that both protocols favor the reprogramming of early progenitor cells. The lower efficiency of reprogramming from the PBMC population may reflect the dilution of early progenitor blood cells by a predominately lymphocytic population.

Figure 6. Comparing the efficiency of reprogramming between PBMCs and CD34+ cells.

PBMCs and CD34+ cells were isolated from single tubes of blood provided from 10 different donors. The efficiency of reprogramming following transfection with DNA Combination Set 2 was determined for each donor and each method. “Total colonies” refers to all iPS colonies derived from either CD34+ or PBMC populations that stain positively for Tra1-60 and “iPS-like” colonies are those that stain positively for Tra1-60, exhibit clear iPS morphology, and are large enough to pick for expansion. Input cells refer to the number of CD34+ cells or PBMCs were used for transfection. The efficiencies across all donors from both methods were compared using the Wilcoxon signed rank test (two-sided), p = 0.007.
http://dx.doi.org/10.1371/journal.pone.0027956.g006

Generation of iPSCs from CD34+ cells using completely defined reagents

Additional reprogramming trials were performed using completely defined conditions to enable the production of clinic-grade iPSCs. A large pool of CD34+ cells mixed from multiple donors was used for multiple tests and resulted in a successful expansion of 113+/−11 fold in defined media compared to 83+/−32 fold for cells in standard conditions after 6 days of expansion (Figure 7A). Despite the 30-fold difference between the two conditions, the absolute number of CD34+ cells is similar between the two populations when multiplied by the percentage of the population expressing CD34 by flow cytometry. For example, 42+/−13% of the population expanded in standard conditions expressed CD34 and 26+/−16% expressed CD34 using completely defined conditions (Figure 7A). There were no detectable CD3+, CD19+, or CD56+ cells after 6 days in culture consistent with our earlier expansion trials (data not shown). The media used for reprogramming is completely defined with the exception of the supplement B27 which contains bovine serum albumin (BSA). However reprogramming was still achieved in the presence or absence of B27 (Figure 7B). These improvements coupled with a defined matrix enables the production of iPSCs in a completely defined process.

Figure 7. The generation of iPSCs from blood using completely defined conditions.


A. Fold expansion of CD34+ cells pooled from multiple blood donors in standard (n = 13) and completely defined conditions (n = 2) after 6 days of expansion. Fold expansion was calculated from the total number of cells at day 6 divided by the number of cells the day after purification. Percentages indicate the fraction of cells expressing CD34 in the total population as assessed by flow cytometry. B. Reprogramming trials were performed on CD34+ cells obtained by leukapheresis from donors GG and A2389 with and without the B27 supplement.
http://dx.doi.org/10.1371/journal.pone.0027956.g007

Discussion

CD34+ cells possess characteristics that make them an ideal blood cell to reprogram: they are readily identified, highly receptive to reprogramming, and free of gene rearrangements characteristic of more differentiated cell types. However, their low numbers in circulating blood have made them a less desirable cell type for reprogramming because large volumes of blood were predicted to be required for the generation of iPSCs. We describe a method to generate insert-free iPSCs from CD34+ cells beginning from a single vial of blood or less. In some cases, the number of CD34+ cells that expanded exceeded that required for a single transfection after 6 days in culture making it possible to transfect after only 3 days of expansion, shorter than the amount of time Chou and colleagues used to reprogram unpurified PBMCs [22].

Proliferation contributes to reprogramming efficiency; therefore, choosing a culture medium that promotes proliferation will effectively promote reprogramming. Data presented in our manuscript supports this assertion because all four donor populations examined were almost 100% positive for CD34 expression after 3 days in culture, but they were not equally receptive to reprogramming (Figure 5A). Cells from donor 3096 demonstrated the highest fold expansion following purification as well as the highest efficiency of reprogramming. However, we go on to demonstrate that proliferation is not the only contributor to efficient reprogramming. In our experiments, the purity of the cell population diminishes over time following purification, but the cells within the culture continue to expand despite low CD34 expression. Figure 1C shows that this expanding population 10 days following purification consists primarily of early lineage progenitor cells. This result indicates that our medium has the capacity to stimulate the proliferation of non-T and non-B cells that have never been or are no longer CD34+. If proliferation were the primary force driving the efficiency of reprogramming, then it would be expected that proliferating non-T/non-B cells within our population would be equally receptive to reprogramming regardless of their time in culture. Our results are contrary to this hypothesis, however, because the efficiency of reprogramming decreases as the magnitude of CD34 expression decreases. This is observed across four independent donor cell populations and is consistent with dependence of reprogramming on CD34 expression (see Figure 5A). These results, taken together, support our hypothesis that both proliferation and cell identity contribute to the efficiency of reprogramming.

We have also outlined a protocol that begins to systematically address some of the challenges in the generation of clinical-grade iPSCs in an effort to advance their use from research lab to clinic. iPSCs must not only be manufactured consistently from a tractable tissue source but also satisfy safety requirements. The core of these requirements includes the use of completely defined culture conditions and a standardized reprogramming method that results in the removal of the potentially oncogenic transgenes employed to reprogram the cells. The starting point of the protocol is the actual patient sample, a single vial of blood. The ability to begin from frozen rather than fresh starting material allows flexibility to launch multiple reprogramming trials in parallel. We demonstrate that either CD34+ cells or PBMCs may be used as the source population for reprogramming. The iPSCs generated by this method are free of transfected DNA as well as B and T cell gene rearrangements. Several challenges remain, however, before routine production of clinical-grade iPSCs can be completely performed. First, there is considerable variation in the efficiency of reprogramming from donor to donor. Some of this variation is likely due to the inherent differences among the donors, but a careful examination of external sources of variation at each step from blood to iPSCs may well reveal areas in addition to those we have uncovered that can be better controlled. For example, we demonstrate potential in the ability to produce iPSCs using completely defined reagents to minimize variation. Second, an automated method for screening and selecting iPSCs during reprogramming would facilitate high throughput production of iPSCs. Third, a robust production protocol must also include a method for the rapid screening of iPSCs to identify those that both lack potentially harmful mutations and are readily differentiated into various cell types. In sum, the generation of iPSCs using a standardized process beginning from early progenitor cells isolated from routine blood draws minimizes this variation and is a good starting point to provide a more comparable baseline for analysis. We present the first steps towards a standardized process to make the generation of clinical-grade iPSCs a reality.

Materials and Methods

Ethics Statement

All human primary cells were generated in vitro from tissue samples from human donors with appropriate written informed consent given to the commercial providers.

All animal work was conducted according to relevant national and international guidelines under the approval of the Cellular Dynamics International Animal Care and Use Committee. As a private company, our animal facility does not provide a permit number or approval ID since mouse is not a protected species.

Processing whole blood samples

Peripheral (PB.1 and PB.2) and cord (CB.1 and CB.2) blood-derived CD34+ cells were obtained from AllCells (Emeryville, CA USA). Blood collections were performed at AllCells and Meriter Laboratories (Madison, WI USA) using standard, 8 ml Vacutainer Cell Processing Tubes (both sodium citrate and sodium heparin-based tubes are acceptable; BD Biosciences; Franklin Lakes, NJ USA). Appropriate documentation for informed consent was completed prior to blood collection (Meriter Laboratories). Vacutainers were processed within 24 hours of collection. Briefly, the PBMC-containing upper phase was collected and washed with ice-cold PBS (Invitrogen; Carlsbad, CA USA). Cells were either frozen down or used directly for purification with the CD34 MicroBead Kit (Miltenyi; Auburn, CA USA) and used according to the manufacturer’s protocol. Some samples were treated with Histopaque (Sigma Aldrich; St. Louis, MO USA) to minimize the number of red blood cells (RBCs) and centrifuged at 2000 rpm for 20 minutes without braking. The interface containing the PBMCs was removed if samples were treated with histopaque, cells washed again with chilled PBS, centrifuged at 600× g for 15 minutes and either frozen down with CryoStor10 (StemCell Technologies; Vancouver, BC Canada) or used directly for purification. CD34+ cell expansion media: StemSpan SFEM (StemCell Technologies), Flt3, SCF, TPO each at a final concentration of 300 ng/ml, IL-6 (100 ng/ml) and IL-3 (10 ng/ml) (Peprotech; Rocky Hill, NJ USA), supplemented with DNaseI (final concentration at 20 U/ml), and 1× Antibiotic-antimycotic (Invitrogen) for overnight recovery. Defined expansion media: serum-free StemSpan H3000 (StemCell Technologies), animal-free IL-6 (R&D Systems Minneapolis, MN USA), and recombinant human IL-3, TPO, Flt3, and SCF (Peprotech) at the same concentrations listed above. PBMC expansion media: StemSpan SFEM, ExCyte Medium Supplement (Millipore; Billerica, MA), Glutamax (Invitrogen), SCF (250 ng/ml), IL-3 (20 ng/ml), Erythropoietin (2 U/ml; Prospec; Rehovot, Israel), IGF-1 (40 ng/ml; Prospec), and Dexamethasone (1 µM; Fisher; Waltham, MA). PBMCs were resuspended at 1×10⁶ cells/ml for expansion.

Flow cytometry

Cell surface staining of hematopoietic cells was performed with CD45-PE, CD34-APC, CD19-APC and CD56-PE (BD Biosciences) and CD3-PE (eBioscience; San Diego, CA USA) antibodies. iPSCs were processed directly for antibody staining for the presence of Tra-1-81 (Stemgent; Cambridge, MA USA) and SSEA-4 (BD Pharmingen; San Diego, CA USA). Propidium Iodide (Sigma Aldrich) was added for dead cell exclusion, and all stained cells were analyzed in combination with their respective isotype controls using a flow cytometer (Accuri; Ann Arbor, MI USA).

Reprogramming cells enriched for CD34-expression

The CD34 nucleofection kit and device (Lonza; Allendale, NJ USA) were used for transfections. For CD34+ cells, 3.5 µg of each plasmid in Combination Set 1 and 3 ug of each plasmid for Combination Set 2 except for the L-myc containing plasmid where 2 µg was transfected using program U-08. Cells were seeded onto RetroNectin-coated 6-well plates (Takara Bio, Inc; Otsu, Shiga Japan). Seeding density ranged from 5×10⁴ to 1×10⁵ cells/ml. Reprogramming media: StemSpan SFEM (StemCell Technologies) supplemented with non-essential amino acids (NEAA; Invitrogen), 0.5× Glutamax, N2B27 (Invitrogen), 0.1 mM β-mercaptoethanol (Sigma-Aldrich), 100 ng/mL zebrafish basic fibroblast growth factor (zbFGF), 0.5 µM PD0325901, 3 µM CHIR99021, 0.5 µM A-83-01 (all molecules from Stemgent), and 10 µM HA-100 (Santa Cruz; Santa Cruz CA USA). Conditions for PBMC reprogramming relied on 1×10⁶ cells per transfection, program T-16, and DNA from Combination Set 2 at the concentrations described for CD34+ cells. Reprogramming media for PBMCs was the same with the exception of the small molecule cocktail which contained recombinant human LiF (Millipore), 3 uM CHIR99021, and 0.5 uM A-83-01. In general, cultures were fed with fresh medium every other day for 9 to 14 days then transitioned to TeSR2 (Stem Cell Technologies) without the addition of small molecules. iPSC colonies were scored with Tra-1-81 antibody (StainAlive™ DyLight™ 488 Mouse anti-Human Tra-1-81 antibody; Stemgent) or mouse-anti-Tra-1-60 IgM antibody (R&D) in combination with goat anti-mouse IgM Alexa 488 (Invitrogen), and alkaline phosphatase expression (Vector Blue Alkaline Phosphatase Substrate Kit III, Vector Laboratories; Burlingame, CA USA).

Detecting endogenous expression of pluripotency markers

Total RNA was isolated using the RNeasy Mini Plus kit (Qiagen; Valencia, CA USA) per the manufacturer’s protocol. Approximately 1 µg of total RNA was used for cDNA synthesis using the SuperScript III First-Strand Synthesis system for RT-PCR (Invitrogen). RT-PCR was performed using previously described primers and those listed in Table 6 [2]. cDNA was diluted 1:2 and 1 µl was used in reactions with GoTaq Green Master Mix (Promega; Madison, WI USA).

Table 6. Primer sequences for the detection of endogenous gene expression.
http://dx.doi.org/10.1371/journal.pone.0027956.t006

journal.pone.0027956.t006  Table 6. Primer sequences for the detection of endogenous gene expression.

Episomal and Genomic DNA isolation

Immunoglobulin heavy chain and T cell gene rearrangements

Karyotyping

In Vitro Differentiation and Teratoma Studies

Acknowledgments

Author Contributions

References

1. Woltjen K, Michael IP, Mohseni P, Desai R, Mileikovsky M, et al. (2009) piggyBac transposition reprograms fibroblasts to induced pluripotent stem cells. Nature 458: 766–770. doi: 10.1038/nature07863.

2. Yu J, Hu K, Smuga-Otto K, Tian S, Stewart R, et al. (2009) Human Induced Pluripotent Stem Cells Free of Vector and Transgene Sequences. Science.

3. Yu J, Vodyanik MA, Smuga-Otto K, Antosiewicz-Bourget J, Frane JL, et al. (2007) Induced pluripotent stem cell lines derived from human somatic cells. Science 318: 1917–1920. doi: 10.1126/science.1151526.

4. Takahashi K, Tanabe K, Ohnuki M, Narita M, Ichisaka T, et al. (2007) Induction of pluripotent stem cells from adult human fibroblasts by defined factors. Cell 131: 861–872. doi: 10.1016/j.cell.2007.11.019.

5. Okita K, Nakagawa M, Hyenjong H, Ichisaka T, Yamanaka S (2008) Generation of mouse induced pluripotent stem cells without viral vectors. Science 322: 949–953. doi: 10.1126/science.1164270.

6. Saha K, Jaenisch R (2009) Technical challenges in using human induced pluripotent stem cells to model disease. Cell Stem Cell 5: 584–595. doi: 10.1016/j.stem.2009.11.009.

7. Park IH, Zhao R, West JA, Yabuuchi A, Huo H, et al. (2008) Reprogramming of human somatic cells to pluripotency with defined factors. Nature 451: 141–146. doi: 10.1038/nature06534.

8. Yamanaka S (2010) Patient-specific pluripotent stem cells become even more accessible. Cell Stem Cell 7: 1–2. doi: 10.1016/j.stem.2010.06.009.

9. Brown ME, Rondon E, Rajesh D, Mack A, Lewis R, et al. (2010) Derivation of induced pluripotent stem cells from human peripheral blood T lymphocytes. PLoS One 5: e11373. doi: 10.1371/journal.pone.0011373.

10. Hanna J, Markoulaki S, Schorderet P, Carey BW, Beard C, et al. (2008) Direct reprogramming of terminally differentiated mature B lymphocytes to pluripotency. Cell 133: 250–264. doi: 10.1016/j.cell.2008.03.028.

11. Polo JM, Liu S, Figueroa ME, Kulalert W, Eminli S, et al. (2010) Cell type of origin influences the molecular and functional properties of mouse induced pluripotent stem cells. Nat Biotechnol 28: 848–855. doi: 10.1038/nbt.1667.

12. Miura K, Okada Y, Aoi T, Okada A, Takahashi K, et al. (2009) Variation in the safety of induced pluripotent stem cell lines. Nat Biotechnol 27: 743–745. doi: 10.1038/nbt.1554.

13. Nakano T (1995) Lymphohematopoietic development from embryonic stem cells in vitro. Semin Immunol 7: 197–203. doi: 10.1016/1044-5323(95)90047-0.

14. Cho SK, Webber TD, Carlyle JR, Nakano T, Lewis SM, et al. (1999) Functional characterization of B lymphocytes generated in vitro from embryonic stem cells. Proc Natl Acad Sci U S A 96: 9797–9802. doi: 10.1073/pnas.96.17.9797.

15. Wada H, Kojo S, Kusama C, Okamoto N, Sato Y, et al. (2011) Successful differentiation to T cells, but unsuccessful B-cell generation, from B-cell-derived induced pluripotent stem cells. Int Immunol 23: 65–74. doi: 10.1093/intimm/dxq458.

+ more in document

Analysis of Human and Mouse Reprogramming of Somatic Cells to Induced Pluripotent Stem Cells. What Is in the Plate?

Stéphanie Boué, Ida Paramonov,  María José Barrero,  Juan Carlos Izpisúa Belmonte
Published: September 17, 2010  http://dx.doi.org/10.1371/journal.pone.0012664

After the hope and controversy brought by embryonic stem cells two decades ago for regenerative medicine, a new turn has been taken in pluripotent cells research when, in 2006, Yamanaka’s group reported the reprogramming of fibroblasts to pluripotent cells with the transfection of only four transcription factors. Since then many researchers have managed to reprogram somatic cells from diverse origins into pluripotent cells, though the cellular and genetic consequences of reprogramming remain largely unknown. Furthermore, it is still unclear whether induced pluripotent stem cells (iPSCs) are truly functionally equivalent to embryonic stem cells (ESCs) and if they demonstrate the same differentiation potential as ESCs. There are a large number of reprogramming experiments published so far encompassing genome-wide transcriptional profiling of the cells of origin, the iPSCs and ESCs, which are used as standards of pluripotent cells and allow us to provide here an in-depth analysis of transcriptional profiles of human and mouse cells before and after reprogramming. When compared to ESCs, iPSCs, as expected, share a common pluripotency/self-renewal network. Perhaps more importantly, they also show differences in the expression of some genes. We concentrated our efforts on the study of bivalent domain-containing genes (in ESCs) which are not expressed in ESCs, as they are supposedly important for differentiation and should possess a poised status in pluripotent cells, i.e. be ready to but not yet be expressed. We studied each iPSC line separately to estimate the quality of the reprogramming and saw a correlation of the lowest number of such genes expressed in each respective iPSC line with the stringency of the pluripotency test achieved by the line. We propose that the study of expression of bivalent domain-containing genes, which are normally silenced in ESCs, gives a valuable indication of the quality of the iPSC line, and could be used to select the best iPSC lines out of a large number of lines generated in each reprogramming experiment.

Citation: Boué S, Paramonov I, Barrero MJ, Izpisúa Belmonte JC (2010) Analysis of Human and Mouse Reprogramming of Somatic Cells to Induced Pluripotent Stem Cells. What Is in the Plate? PLoS ONE 5(9): e12664.  http://dx.doi.org/10.1371/journal.pone.0012664

Figure 2. Human protein-protein interaction networks of genes with higher expression levels in ESCs and iPSCs compared to somatic cells.

journal.pone.0012664.g002  Figure 2. Human protein-protein interaction networks of genes with higher expression levels in ESCs and iPSCs compared to somatic cells.


The human protein-protein interaction networks of genes most consistently highly expressed in ESCs and iPSCs, compared to the starting cell populations, have been created from the lists of the biggest changes in expression, using String[71] with high confidence interactions (min score 0.7) and have been edited in Medusa[72]. They show a central, highly interconnected network of genes in which the most famous pluripotency transcription factors are to be found and which is likely to represent the core pluripotency network. They also highlight a number of genes whose functions relate to cell-cell communication, cell cycle, DNA repair and other metabolisms.

http://dx.doi.org/10.1371/journal.pone.0012664.g002

Figure 3. Mouse protein-protein interaction networks of genes with higher expression levels in ESCs and iPSCs compared to somatic cells.

journal.pone.0012664.g003  Figure 3. Mouse protein-protein interaction networks of genes with higher expression levels in ESCs and iPSCs compared to somatic cells.

The mouse protein-protein interaction networks of genes most consistently highly expressed in ES and iPSCs, compared to the starting cell populations, have been created from the lists of biggest changes in expression, using String[71] with high confidence interactions (min score 0.7) and have been edited in Medusa[72]. They show a central, highly interconnected network of genes in which the most famous pluripotency transcription factors are to be found and which is likely to represent the core pluripotency network. They also highlight a number of genes those functions relate to cell-cell communication, cell cycle, DNA repair and other metabolisms.
http://dx.doi.org/10.1371/journal.pone.0012664.g003


Read Full Post »

Read Full Post »

Anticoagulation Genotype guided Dosing

Author and Curator: Larry H. Bernstein, MD, FCAP 


A common complication of patients on Warfarin (coumadin) is massive hematoma associated with a fall.  Warfarin is an inhibitor of the liver production of prothrombin.  Inadequate Warfarin dosing results in a risk of thromboembolism to the lungs or the brain, depending on where the clot is initiated.  However, there is a pharmacogenomic problem in that there are individuals who have a genetic polymorphism (CYP2C9 and VKORC1) that affects the coagulation effect of the coumadin.  This introduces the question of whether such individuals should be identified and dosed according to pharmacogenomic testing.  The usual measurement of the effect of the drug is the International Normalized Ratio (INR) from the Prothrombin Time (PT).  The existence of chronic liver disease and the use of coumadin are perhaps almost the exclusive value for the PT.
A similar question arises for the genotyping of clopidogrel for antiplatelet guidance. Does it reduce risk in stenting?

A Pharmacogenetic versus a Clinical Algorithm for Warfarin Dosing

Stephen E. Kimmel, M.D., Benjamin French, Ph.D., Scott E. Kasner, M.D., Julie A. Johnson, Pharm.D., and others

Center for Therapeutic Effectiveness Research,  Philadelphia, PA 19104-6021, or at stevek@mail.med.upenn.edu.

A complete list of investigators and committees in the Clarification of Optimal Anticoagulation through Genetics (COAG) trial is provided in the Supplementary Appendix, available at NEJM.org.

November 19, 2013 | NEJM
http://dx.doi.org/10.1056/NEJMoa1310669

Comparison of  genotype-guided dosing algorithm with the clinically guided dosing algorithm for Warfarin dosing

Abstract

nejmoa1310669.pdf  

Background

The clinical utility of genotype-guided (pharmacogenetically based) dosing of warfarin has been tested only in small clinical trials or observational studies, with equivocal results.
Methods
We randomly assigned 1015 patients to receive doses of warfarin during the first 5 days of therapy that were determined according to a dosing algorithm that included both clinical variables and genotype data or to one that included clinical variables only. All patients and clinicians were unaware of the dose of warfarin during the first 4 weeks of therapy. The primary outcome was the percentage of time that the international normalized ratio (INR) was in the therapeutic range from day 4 or 5 through day 28 of therapy.

Results

At 4 weeks, the mean percentage of time in the therapeutic range was 45.2% in the genotype-guided group and 45.4% in the clinically guided group (adjusted mean difference, [genotype-guided group minus clinically guided group], −0.2; 95% confidence interval, −3.4 to 3.1; P=0.91). There also was no significant between-group difference among patients with a predicted dose difference between the two algorithms of 1 mg per day or more. There was, however, a significant interaction between dosing strategy and race (P=0.003). Among black patients, the mean percentage of time in the therapeutic range was less in the genotype-guided group than in the clinically guided group. The rates of the combined outcome of any INR of 4 or more, major bleeding, or thromboembolism did not differ significantly according to dosing strategy.

Conclusions

Genotype-guided dosing of warfarin did not improve anticoagulation control during the first 4 weeks of therapy. (Funded by the National Heart, Lung, and Blood Institute and others; COAG ClinicalTrials.gov number, NCT00839657.)
Figure 1 Distribution of Time in the Therapeutic Range.
nejmoa1310669_f1 Distribution of Time in the Therapeutic Range.
Figure 2 Range of INRs during the 4-Week Study.
nejmoa1310669_f2 Range of INRs during the 4-Week Study.

Introduction

The need for clinical trials before widespread adoption of genotype-guided drug dosing and selection remains widely debated.1-4 Warfarin therapy has served as a model for the potential for pharmacogenetics to improve patient care.1 Observational studies have identified two genes, CYP2C9 and VKORC1, that are associated with variation in warfarin maintenance doses. However, the clinical utility of starting warfarin at the maintenance dose predicted by genotype-guided algorithms has been tested only in small trials, none of which were definitive.5-8 In contrast, observational studies have suggested potential benefits from genotype-guided dosing.9,10 In addition, previous clinical trials could not determine the usefulness of current dosing algorithms among black patients, for whom genotype-guided algorithms perform less well than for other populations.11-13
On the basis of available data, the Food and Drug Administration (FDA) has updated the label for warfarin twice, suggesting that variants in CYP2C9 and VKORC1 may be taken into consideration when choosing the initial warfarin dose. However, the Centers for Medicare and Medicaid Services did not find sufficient evidence to cover the cost of genotyping for warfarin dosing.14 Our study, called the Clarification of Optimal Anticoagulation through Genetics (COAG) trial, was designed to test the effect of genotype-guided dosing on anticoagulation control.

Methods

Study Design and Oversight

The COAG trial was a multicenter, double-blind, randomized, controlled trial that compared a genotype-guided warfarin-dosing strategy with a clinically based dosing strategy during the first 5 days of therapy among patients initiating warfarin treatment.15-17 The study was designed by the authors and approved by the institutional review board at the University of Pennsylvania and at each participating clinical center. The data were collected, analyzed, and interpreted by the authors. A steering committee provided oversight of the trial (for details, see the Supplementary Appendix, available with the full text of this article at NEJM.org). An independent data and safety monitoring board monitored the trial and made recommendations to the National Heart, Lung, and Blood Institute. The first two authors wrote the first draft of the manuscript, which was edited and approved by all the authors. The National Heart, Lung, and Blood Institute supported this study. Bristol-Myers Squibb donated Coumadin (warfarin). GenMark Diagnostics and AutoGenomics loaned genotyping platforms to the clinical centers. None of the companies supporting the trial had any role in the design of the protocol or in the collection, analysis, or interpretation of the data. The authors vouch for the data and the analyses, and for the fidelity of this report to the trial protocol, which is available at NEJM.org.

Study Patients and Randomization

From September 2009 through April 2013, we enrolled both inpatients and outpatients at 18 clinical centers in the United States. All the patients were adults initiating warfarin therapy with a target international normalized ratio (INR) of 2 to 3. Detailed inclusion and exclusion criteria are provided in the Supplementary Appendix. All patients provided written informed consent.
Patients were randomly assigned, in a 1:1 ratio, to the use of a dosing algorithm that included both clinical variables and genotype data or to a clinically guided dosing strategy. Randomization was stratified according to clinical center and self-reported race (black vs. nonblack).
Genotyping for CYP2C9 and VKORC1 at each clinical center was performed with the use of one of two FDA-approved platforms, the GenMark Dx eSensor XT-8 or the AutoGenomics INFINITI Analyzer. Per protocol, genotyping was performed in all patients immediately after blood-sample collection to maintain blinding to the treatment assignment. Genotyping was repeated at the central laboratory with the use of either pyrosequencing or real-time polymerase-chain-reaction assay to measure the accuracy at clinical centers.

Study Intervention and Follow-up

The study intervention period was the first 5 days of warfarin therapy. During this period, the prespecified algorithms were used to determine the warfarin dose. For each dosing strategy, a dose-initiation algorithm was used during the first 3 days of therapy, and a dose-revision algorithm was used on day 4, 5, or both. The algorithms for the genotype-guided dosing strategy12,18 included clinical variables and genotype data for CYP2C9*2, CYP2C9*3, and VKORC1. The algorithms for the clinically based dosing strategy included clinical variables only. The dosing algorithms are provided in the Supplementary Appendix. If genotype information was not available for a patient in the genotype-guided dosing group before the administration of warfarin on any given day in the first 5 days, the clinical algorithm was used on that day.
During the first 4 weeks of therapy, patients and clinicians were unaware of the actual dose of warfarin that was administered, because the pills were encapsulated to prevent identification of the dose (see the Supplementary Appendix). After the 5-day initiation period, we adjusted the dose during the first 4 weeks using standardized dose-adjustment techniques,5,10 starting with the doses predicted by the algorithms and making the same relative adjustments on the basis of the INR in the two study groups. Clinicians were informed of the relative dose change (e.g., a 10% dose increase) at each INR measurement but not the actual dose of warfarin. Clinicians could contact the medical monitor (who was aware of the study-group assignments) to request an override of these relative dose changes without being informed of the actual dose. All patients were to be followed for a total of 6 months.

Study Outcomes

The primary outcome was the percentage of time in the therapeutic range (INR, 2 to 3) from the completion of the intervention period (day 4 or 5) through day 28 of therapy. We calculated the percentage of time in the therapeutic range using a standard linear interpolation method between successive INR values,19 as detailed in the Supplementary Appendix. Each clinical center measured INRs with the use of instruments certified by the Clinical Laboratory Improvement Amendments and following strict quality assurance.
Secondary outcomes included a composite outcome of any INR of 4 or more, major bleeding, or thromboembolism in the first 4 weeks (principal secondary outcome); the time to the first therapeutic INR; the time to the determination of a maintenance dose (which was defined as the time to the first of two consecutive INR measurements, measured at least 1 week apart, that were in the therapeutic range without a dose change); and the time to an adverse event (death from any cause, major bleeding, thromboembolism, or any clinically relevant nonmajor bleeding event20,21) in the first 4 weeks. Two physicians who were unaware of the study-group assignments adjudicated major bleeding and thromboembolic serious adverse events. The definitions of major bleeding,22 clinically relevant nonmajor bleeding, and thromboembolism are provided in the Supplementary Appendix.

Statistical Analysis

We analyzed the primary outcome in the modified intention-to-treat population, which included all patients who underwent randomization with the exception of patients for whom INR data were not available (Fig. S1 in the Supplementary Appendix). Safety outcomes were analyzed in the entire cohort, regardless of whether patients received the study drug. We used regression models to analyze the primary and secondary outcomes, using linear regression for the percentage of time in the therapeutic range and Cox regression for time-to-event outcomes. The protocol specified that we conduct coprimary analyses in which we evaluated the primary outcome in all patients and in a primary subgroup, which comprised patients who had an absolute difference of 1.0 mg or more in the predicted initial daily dose between the genotype-guided dosing algorithm and the clinical dosing algorithm. We used an alpha allocation approach, which formally allows for the evaluation of the treatment benefit in an enriched subgroup as a coprimary end point. In this approach, the overall type I error rate of 0.05 for the primary outcome was split between the analyses performed among all patients and among those in the primary subgroup.17 All models were adjusted for the stratification variables (center and race). Additional subgroups, which were prespecified, were race (black vs. nonblack), sex, and the total number of allelic variants (1 variant vs. 0 or >1 variant in either CYP2C9 or VKORC1 5). All statistical tests were two-sided. All analyses were performed with the use of the R statistical package, version 3.0.1 (R Development Core Team).
We specified a minimum detectable difference of 5.5% in the mean percentage of time in the therapeutic range between the genotype-guided group and the clinically guided group in the entire study population.16 We assumed a standard deviation for the percentage of time in therapeutic range of 25% and a potential dropout rate of 10%. On the basis of recruitment rates,15 the initial sample size of 1238 patients was revised to 1022 patients on September 16, 2012 (with the approval of the data and safety monitoring board). The revised sample size provided a power of at least 80% to detect a between-group difference of 5.5% at a type I error rate of 0.04 among all patients and a 9.0% difference at a type I error rate of 0.01 among patients in the coprimary analysis.

Results

Patients, Genotyping, and Follow-up

A total of 1015 patients were enrolled and randomly assigned to either the genotype-guided dosing algorithm or the clinically guided dosing algorithm (Fig.S1 in the Supplementary Appendix). There were no significant between-group differences at baseline (Table 1Table 1Characteristics of the Patients at Baseline.). The characteristics of the patients according to self-reported race are provided in Table S1 in the Supplementary Appendix. A total of 60 participants (30 in each group) withdrew before completing the intervention period and did not have an available percentage of time in the therapeutic range, resulting in an analytic sample size of 955. A median of six INRs were measured during the first 4 weeks in each of the two study groups. Dispensed doses during the intervention period are summarized in Table S2 in the Supplementary Appendix.
Genotype data were available in the genotype-guided group for 45% of the patients before the first warfarin dose, for 94% before the second warfarin dose, and for 99% before the application of the dose-revision algorithm on day 4 or 5. The mean (±SD) difference between the dose calculated for patients without genotype data on day 1, as compared with the dose they would have received if genotype data had been available, was −0.1±0.4 mg per day during the first 3 days. The central laboratory confirmed 99.8% of all genotyping results from the clinical centers. All genotype distributions were in Hardy–Weinberg equilibrium (P>0.20 for all comparisons).

Primary Outcome

At 4 weeks, there was no significant between-group difference in the mean percentage of time in the therapeutic range: 45.2% in the genotype-guided group and 45.4% in the clinically guided group (adjusted mean difference [genotype-guided group minus clinically guided group], −0.2%; 95% confidence interval, −3.4 to 3.1; P=0.91) (Table 2Table 2Percentage of Time in the Therapeutic INR Range through Week 4 of Therapy, According to Subgroup. and Figure 1Figure 1Distribution of Time in the Therapeutic Range.). There was also no significant between-group difference in the percentage of time in the therapeutic range among patients in the coprimary analysis (Table 2). When the 4-week trial was divided into two 2-week intervals, there was also no significant difference between the groups in either interval (Table 2).
However, there was a significant interaction between race and dosing strategy (P=0.003) (Table 2). Among black patients, the mean percentage of time in the therapeutic range was less in the genotype-guided group than in the clinically guided group (35.2% vs. 43.5%; adjusted mean difference, −8.3%; P=0.01). Among nonblack patients, the mean percentage of time in the therapeutic range was slightly higher in the genotype-guided group than in the clinically guided group (48.8% vs. 46.1%; adjusted mean difference, 2.8%; P=0.15). There were no significant differences in the percentage of time in the therapeutic range according to sex or the total number of genetic variants (Table 2).

Anticoagulation Control and Dose Prediction

There were no significant between-group differences in the mean percentage of time above the therapeutic range (INR, >3) or below the therapeutic range (INR, <2) (Figure 2Figure 2Range of INRs during the 4-Week Study., and Table S3 in the Supplementary Appendix). However, black patients in the genotype-guided group were more likely to have INRs above the therapeutic range than were those in the clinically guided group (Fig. S2 and Table S3 in the Supplementary Appendix).
There was no overall between-group difference in the time to the first INR in the therapeutic range (Table S4 in the Supplementary Appendix). However, black patients in the genotype-guided group took longer on average to reach the first therapeutic INR than did those in the clinically guided group (Table S4 and Fig. S3 in the Supplementary Appendix). The time to the determination of the maintenance dose did not differ significantly between the two groups overall or according to the primary subgroup, race, or total number of genetic variants (Table S5 in the Supplementary Appendix).
The performance characteristics of the dosing algorithms with respect to the maintenance dose that was determined are shown in Table S6 (which includes the accuracy of a hypothetical, empirical dosing strategy of 5 mg per day) and in Fig. S4, both in the Supplementary Appendix. The genotype-guided algorithms performed better at predicting the maintenance dose among nonblack patients than among black patients. Dose overrides during the first 4 weeks were rare, occurring in only 3.9% of doses in the genotype-guided group and 3.6% of those in the clinically guided group; rates of overrides did not differ according to race.

Adverse Events

At 4 weeks, there were no significant between-group differences in the principal secondary outcome (the time to any INR of ≥4, major bleeding, or thromboembolism) or any other adverse events (Table 3Table 3Adverse Events through Day 28 of Warfarin Therapy., and Table S7 in the Supplementary Appendix). Safety data for the entire duration of follow-up (i.e., past the primary outcome duration) are provided in Table S8 in the Supplementary Appendix.

Discussion

In our study, we found no benefit of genotype-guided dosing of warfarin with respect to the primary outcome of the percentage of time in the therapeutic INR range, either overall or among patients with a predicted dose difference between the genotype-guided algorithm and the clinically guided algorithm of at least 1 mg per day. Our findings exclude a meaningful effect of genotype-guided dosing on the percentage of time in the therapeutic range during the first month of warfarin treatment. However, there was a significant difference in the effects of the algorithms in the prespecified subgroup of black patients, as compared with nonblack patients. Although the interaction between race and dosing strategy with respect to the primary outcome could be due to chance, the analysis was prespecified and was consistent with our a priori hypothesis that there would be race-based differences.
The dosing algorithms that we used in the trial have been validated and account for race (specifically black vs. nonblack).11-13,18 The genotype-guided algorithm performed as well as anticipated on the basis of previous studies,5,8,10-12,18,23 with an R2 of 0.48 and a mean absolute error of 1.3 mg per day for the dose-initiation algorithm and an R2 of 0.69 and a mean absolute error of 1.0 mg per day for the dose-revision algorithm. Despite this accuracy in predicting maintenance doses, there was no benefit of genotype-guided dosing with respect to anticoagulation control.
Observational studies have shown an association between the use of genetic algorithms and improved outcomes, but because of limitations in the study design, they were unable to assess whether the observed associations were causal.1,9,10 Previous clinical trials have produced equivocal results,5-8 but these trials were limited by a small size and lack of blinding to the warfarin dose. The two trials that suggested possible benefit also were limited by large numbers of dropouts6 and a comparison with nonalgorithm-based dosing.8 Previous studies also enrolled either no black patients6-8 or a minimal number of black patients5 (a total of 3) (Anderson J: personal communication).
The average percentage of time in the therapeutic range of 45% in our study is similar to that in other trials, taking into account the range of INRs used for the calculation and the timing and duration of therapy (Tables S9A and S9B in the Supplementary Appendix).5,10,24,25 Unlike previous trials that used only a baseline genotype-guided algorithm, our study used both a dose-initiation and a dose-revision algorithm. A recent study comparing a similar initiation algorithm with a combined initiation and revision algorithm showed no effect on the percentage of time in the therapeutic range with the addition of the revision algorithm.10
There are several questions that our study was not designed to answer. First, the trial did not compare genotype-based dosing with usual care or a fixed initial dose (e.g., 5 mg per day). However, such a comparison could not have discerned whether differences in outcomes were due to the marginal benefit of genetic information or to the use of the clinical information that is included in all genotype-guided dosing algorithms. Second, our study does not address the question of whether a longer duration of genotype-guided dosing would have improved INR control,26 an issue that is being addressed in another trial.27 Third, the dosing algorithms that we used included the three single-nucleotide polymorphisms among the two genes that are most likely to influence warfarin dosing. Although other genes may contribute to warfarin dosing, it is unlikely that they have a substantial effect, particularly in white populations.28 Fourth, although there were no significant between-group differences in the rates of bleeding or thromboembolic events during the primary follow-up period of 4 weeks, the trial was not powered for these outcomes. Fifth, the first dose of warfarin was not informed by genotyping in 55% of the patients; whether this influenced the results is unknown. However, the effect of missing genetics data on day 1 on the dose administered during the first 3 days of therapy was trivial.
In conclusion, our findings do not support the hypothesis that initiating warfarin therapy at a genotype-guided maintenance dose for the first 5 days, as compared with initiating warfarin at a clinically predicted maintenance dose, improves anticoagulation control during the first 4 weeks of therapy. Our results emphasize the importance of performing randomized trials for pharmacogenetics, particularly for complex regimens such as warfarin.

References

1 Ginsburg GS, Voora D. The long and winding road to warfarin pharmacogenetic testing. J Am Coll Cardiol 2010;55:2813-2815
2 Burke W, Laberge AM, Press N. Debating clinical utility. Public Health Genomics 2010;13:215-223
3 Ashley EA, Hershberger RE, Caleshu C, et al. Genetics and cardiovascular disease: a policy statement from the American Heart Association. Circulation 2012;126:142-157
4 Woodcock J, Lesko LJ. Pharmacogenetics — tailoring treatment for the outliers. N Engl J Med 2009;360:811-813
5 Anderson JL, Horne BD, Stevens SM, et al. Randomized trial of genotype-guided versus standard warfarin dosing in patients initiating oral anticoagulation. Circulation 2007;116:2563-2570
6 Caraco Y, Blotnick S, Muszkat M. CYP2C9 genotype-guided warfarin prescribing enhances the efficacy and safety of anticoagulation: a prospective randomized controlled study. Clin Pharmacol Ther 2008;83:460-470
A complete list of investigators and committees in the Clarification of Optimal Anticoagulation through Genetics (COAG) trial is provided in the Supplementary Appendix, available at NEJM.org.

Editorial

Do Pharmacogenetics Have a Role in the Dosing of Vitamin K Antagonists?

Bruce Furie, M.D.
Nov 19, 2013    http://dx.doi.org/10.1056/NEJMe1313682


Article

Vitamin K plays a single role in human biology — as a cofactor for the synthesis of γ-carboxyglutamic acid. This amino acid is a component of at least 14 proteins, including 4 blood-coagulation proteins (factor IX, factor VII, factor X, and prothrombin) and 2 regulatory proteins (protein C and protein S), and it is critical for the physiologic function of these proteins. Humans do not synthesize vitamin K. Rather, we ingest it in our diet. The vitamin K quinone is reduced to the semiquinone, and this reduced vitamin K is a cofactor that is required for the conversion of specific glutamic-acid residues on the vitamin K–dependent proteins to γ-carboxyglutamic acid by the vitamin K–dependent carboxylase. Vitamin K epoxide, a product of this reaction, is converted back to the vitamin K quinone by the vitamin K epoxide reductase, otherwise known as VKOR. This vitamin K cycle can be broken, and a state of vitamin K deficiency at the carboxylase level effected, by the inhibition of VKOR by vitamin K antagonists, including warfarin.
Warfarin and its analogues have been used as oral anticoagulant agents for more than 50 years. By targeting VKOR, the post-translational modification of the vitamin K–dependent blood-coagulation proteins is impaired. A reduced functional level of factor IX, factor VII, factor X, and prothrombin leads to delayed blood coagulation. This inhibition is monitored in the clinical laboratory with the use of the prothrombin time and is corrected for the varied potencies of tissue factor used in the assay by means of a calibration factor, yielding the international normalized ratio (INR). The intensity of therapy with vitamin K antagonists varies according to the indication for anticoagulation, and the INR is adjusted by varying the dose of the vitamin K antagonist.
The goal of therapy is to keep the INR in the therapeutic range, since patients with an INR that is subtherapeutic are at increased risk for thrombosis and patients with an INR that is supratherapeutic are at increased risk for bleeding. Keeping the INR within the therapeutic range can be challenging. Warfarin binds to albumin, and only about 3% is free and pharmacologically active. A number of medications can displace warfarin, leading to its increased activity and subsequent increased rate of degradation. Diet, specifically the intake of foods containing vitamin K, can offset the effect of the daily dose of the vitamin K antagonist. Age, weight, and sex are other factors that influence the dose.
In addition, the catabolic rate of the vitamin K antagonists appears to have a genetic basis. Genetic polymorphisms in the cytochrome P-450 enzyme CYP2C9 include two variants, C144R in CYP2C9*2 and I359L in CYP2C9*3. These variants have substantially reduced activity, as compared with CYP2C9*1, and are associated with reduced clearance and thus a decrease in the warfarin-dose requirement.1 Similarly, mutations in VKOR, the target of the vitamin K antagonists, lead to various degrees of warfarin resistance. Polymorphisms in VKORC1, the gene encoding this protein, lead to variability in the sensitivity to vitamin K antagonists.2
Might genotyping of CYP2C9 and VKORC1 in patients initiating anticoagulant therapy with vitamin K antagonists lead to more precise dosing and, by extrapolation, reduce the risk of thrombotic and bleeding complications? Numerous anecdotal, observational, and small clinical trials have been published on the use of this information, with many authorities promoting this approach.
The results of three large, randomized clinical trials that test this hypothesis have now been published in the Journal.3-5 Although they vary in organization and structure (duration of study, vitamin K antagonist used, double-blind vs. single-blind design, racial characteristics of the study group, and method for dosing in the control group), they are also similar (large, multicenter, randomized studies; primary end point of the time in the therapeutic range; genotyping of CYP2C9 and VKORC1; and the use of the INR target as a biomarker for the risk of bleeding and thrombosis). Importantly, these trials all examine the initiation of therapy with vitamin K antagonists and use as a primary end point the percentage of time that a patient is within the therapeutic range during the initial phase of treatment. The more important end point, the rate of bleeding and thrombotic complications, was beyond the power design of these trials.
Despite design differences, the conclusions of the three studies are similar. In an initial period of 4 weeks of anticoagulation with warfarin, the randomized, double-blind study by Kimmel et al.3 showed results in the study group that included pharmacogenetic information to supplement clinically guided dosing that were nearly identical to the results in the group that used clinically guided dosing alone (percentage of time in the therapeutic INR range, 45.2% vs. 45.4%). In the 12 weeks after the initiation of anticoagulation with acenocoumarol and phenprocoumon, Verhoef et al.4 used a new point-of-care device and found that a genotype-guided algorithm that included clinical variables yielded results that were similar to those achieved with an algorithm based on clinical variables (61.6% vs. 60.2% at 12 weeks). Pirmohamed et al.5 compared genotype-guided dosing of warfarin, also using a point-of-care device, with standard dosing methods used in clinical practice. The results at 12 weeks were 67.4% and 60.3%, which are significantly different albeit similar, indicating a modest improvement.
What can we conclude from these trials? First, we must recall that these trials address the process of the initiation of anticoagulant therapy — during the very first week — and not an approach to intermediate or long-term anticoagulation. Second, it would appear that, despite the variation in trial design, these trials indicate that this pharmacogenetic testing has either no usefulness in the initial dosing of vitamin K antagonists or, at best, marginal usefulness, given the cost and effort required to perform this testing.
Improved safety with the use of vitamin K antagonists is nonetheless an important goal, and it remains so, despite the introduction of new oral anticoagulants. Perhaps we should concentrate on improvements in the infrastructure for INR testing, including better communication among the laboratory, the physician, and the patient (e.g., through social media); in the use of formal algorithms for dosing, without concern for genotype; in patient adherence to therapy and possibly more responsibility for dosing being assumed by the patient; and in increased diligence by medical and paramedical personnel in testing, monitoring, and dosing on the basis of the INR, given the high percentage of medical mismanagement associated with these anticoagulant agents.  http://dx.doi.org/nejm1313682.pdf

References

1 Aithal GP, Day CP, Kesteven PJ, Daly AK. Association of polymorphisms in the cytochrome P450 CYP2C9 with warfarin dose requirement and risk of bleeding complications. Lancet 1999;353:717-719
2 D’Andrea G, D’Ambrosio RL, Di Perna P, et al. A polymorphism in the VKORC1 gene is associated with an interindividual variability in the dose-anticoagulant effect of warfarin. Blood 2005;105:645-649
3 Kimmel SE, French B, Kasner SE, et al. A pharmacogenetic versus a clinical algorithm for warfarin dosing. N Engl J Med 2013. DOI: 10.1056/NEJMoa1310669.
4 Verhoef TI, Ragia G, de Boer A, et al. A randomized trial of genotype-guided dosing of acenocoumarol and phenprocoumon. N Engl J Med 2013. DOI: 10.1056/NEJMoa1311388.
5 Pirmohamed M, Burnside G, Eriksson N, et al. A randomized trial of genotype-guided dosing of warfarin. N Engl J Med 2013. DOI: 10.1056/NEJMoa1311386.

Rapid Warfarin Reversal With 4-Factor Prothrombin Complex Concentrate

Samuel Z. Goldhaber, MD    Nov 07, 2013     Clotblog at theheart.org

Hello. This is Dr. Sam Goldhaber from the Clotblog at theheart.org, speaking to you from Brigham and Women’s Hospital and Harvard Medical School on the important topic of 4-factor prothrombin complex concentrate (4F-PCC), which is the optimal approach to urgent warfarin reversal.
The US Food and Drug Administration only recently approved 4F-PCC to reverse excessive bleeding from warfarin. We have had 3-factor PCC around for a long time but it doesn’t have much factor XII in it. Our European colleagues have had 4F-PCC for the past few years.
I was very pleased recently to have had the opportunity to use 4F-PCC to reverse an intracranial hemorrhage in a patient who had an international normalized ratio (INR) of 2.8 and a spontaneous head bleed. She was receiving warfarin for anticoagulation, and within about 15 minutes the 4F-PCC, along with 10 mg of intravenous vitamin K, returned her INR to normal. Of greater importance, the head bleeding stopped and she regained virtually all of her neurologic function. It seemed miraculous to me and it happened so quickly that it was very gratifying.
Almost simultaneously with my clinical experience, we published an observational study in Circulation [1] with about 300 patients who bled on warfarin. Approximately 80% of these patients were on warfarin because of permanent atrial fibrillation, and they had an average age in the 70s. Initially patients received fresh frozen plasma (before 4F-PCC became available in Canada) and their outcomes with fresh frozen plasma were tracked very carefully. When 4F-PCC came along and practice switched to that therapy, those outcomes were tracked as well.

Clopidogrel Genotyping for Antiplatelet Guidance in MI Stenting: Maybe Reduced Ischemic Risk

Steve Stiles    Nov 06, 2013

SAN FRANCISCO, CA — A novel study of genotype-guided antiplatelet therapy in patients who received a stent for acute MI saw a sharp drop in ischemic events over one year among those who tested positive for a clopidogrel loss-of-function (LOF) gene pattern and had their originally prescribed antiplatelet therapy altered based on the assay results.
In the prospective GIANT trial with 1445 patients, reported here at TCT 2013 , it was discretionary whether clinicians raised the clopidogrel dosage or switched thienopyridine agents based on the assay results, which they had in hand within 48 hours after stenting. Such changes were made in 86% of the 316 who tested positive for the LOF genotype, a group known to be at increased ischemic risk on standard clopidogrel-containing antiplatelet therapy after stenting.
Among those 272 patients with assay-guided antiplatelet changes, the one-year composite risk of death, MI, or stent thrombosis closely matched that of patients lacking the high-risk genotype, according to co–principal investigator Dr Bernard R Chevalier (L’Institut CardioVasculaire Paris-Sud, Massy, France), who presented the study.
Dr Bernard R Chevalier
Of note, the composite end point was about five times higher for the remaining 14% of LOF-genotype patients whose antiplatelet therapy wasn’t changed based the assay.
“These are really the first clinical-trial data in the genotype space compared with the phenotype space, and I think it’s long overdue,” according to Dr Daniel I Simon (University Hospitals Case Medical Center, Cleveland, OH), speaking from the panel charged with critiquing GIANT after its formal presentation. As did many throughout TCT 2013, Simon was weighing two different approaches to sharpening thienopyridine selection for dual-agent antiplatelet therapy after coronary interventions, specifically those focusing on genotyping for the CYP2C19 clopidogrel loss-of-function variant vs platelet-function assays like VerifyNow (Accumetrics).
Such platelet-function testing with coronary stenting has its supporters and detractors but hasn’t found a consistent role in managing patients undergoing PCI, even for acute coronary syndromes, as heartwire has long reported.
One-Year Rates (%) of Primary End Point (Death, MI, or Stent Thrombosis) by Clopidogrel LOF Genotype Status
End point Normal
LOF, treatment is adjusted LOF, treatment is not adjusted
                              n=1118           n=272                     n=55
Primary              3.04                 3.3*                        15.6
 *p=0.83 vs normal; p<0.0001 for noninferiority; p=0.04 vs LOF-treatment-is-not-adjusted
“I think these are amazing results,” Dr Cindy L Grines (Detroit Medical Center Cardiovascular Institute, MI) said at a press briefing on GIANT, referring to both the high event rate in LOF-genotype patients whose treatment wasn’t changed and similarly lower event rates in the other two groups. “Both of those [findings] are a little bit unexpected, I’d guess?” She asked Chevalier why clinicians did not modify antiplatelet therapy in 14% of patients positive for the LOF genotype.
In GIANT, said Chevalier in his presentation, investigators were “strongly recommended” to give such patients prasugrel (Effient, Lilly/Daiichi-Sanyo) or, if they had contraindications to prasugrel, to double their clopidogrel dosage.
But prasugrel, a more potent antiplatelet than clopidogrel, had already been chosen for initial antiplatelet therapy in more than half of patients in the study. Perhaps clinicians believed such patients would benefit from it regardless of their ultimate genotype status. Indeed, some patients later found not to have the clopidogrel LOF genotype were switched from prasugrel to clopidogrel, perhaps satisfied by the assay that the latter drug would be adequate after all.
Chevalier speculated that clinicians also may not have boosted antiplatelet therapy in some LOF-genotype patients if it was considered too risky, such as for those with bleeding risk factors. The high event rate in patients with the LOF genotype whose antiplatelet therapy wasn’t adjusted, therefore, may be more related to how sick the patient was, rather than any cues from genotyping. He said his group is currently looking for the answer in further analyses.
Prevalence of Thienopyridine Use and Dosages, Before and After Genotyping, by Assay Outcome
Thienopyridine and dosage by timing
n=1118                                     treatment is  adjusted,   (%)                 n=272 (%)
                                                                           Normal,     LOF          p
Clopidogrel 75 mg/d (preassay)           35.6           34.7      NS
Clopidogrel 75 mg/d (postassay)        44.5             0       <0.001
Clopidogrel 150 mg/d (preassay)        10               9.1         NS
Clopidogrel 150 mg/d (postassay)    8.9             16.8   <0.05
Prasugrel 10 mg/d (preassay)            53.3           55.5       NS
Prasugrel 10 mg/d (postassay)         46.1            83.1    <0.001
NS=nonsignificant
GIANT was funded by Biotronik. Chevalier discloses consulting for or receiving research grants or speaker fees from Abbott Vascular, Asahi, Astra Zeneca, AVI, Boston Scientific, Biotronik, Colibri, Cook, Cordis, Daiichi Sankyo, Eli-Lilly, Iroko, Medtronic, and Terumo and being general director of and owning equity interest in the European Cardiovascular Research Center.

 Bivalirudin Started during Emergency Transport for Primary PCI

Philippe Gabriel Steg, M.D., Arnoud van ‘t Hof, M.D., Ph.D., Christian W. Hamm, M.D., Peter Clemmensen, M.D., Ph.D., Frédéric Lapostolle, M.D., Ph.D., Pierre Coste, M.D., Jurrien Ten Berg, M.D., Ph.D., Pierre Van Grunsven, M.D., Gerrit Jan Eggink, M.D., Lutz Nibbe, M.D., Uwe Zeymer, M.D., Marco Campo dell’ Orto, M.D., Holger Nef, M.D., Jacob Steinmetz, M.D., Ph.D., Louis Soulat, M.D., Kurt Huber, M.D., Efthymios N. Deliargyris, M.D., Debra Bernstein, Ph.D., Diana Schuette, Ph.D., Jayne Prats, Ph.D., Tim Clayton, M.Sc., Stuart Pocock, Ph.D., Martial Hamon, M.D., and Patrick Goldstein, M.D. for the EUROMAX Investigators

N Engl J Med 2013; 369:2207-2217December 5, 2013DOI: 10.1056/NEJMoa1311096


 Background

Bivalirudin, as compared with heparin and glycoprotein IIb/IIIa inhibitors, has been shown to reduce rates of bleeding and death in patients undergoing primary percutaneous coronary intervention (PCI). Whether these benefits persist in contemporary practice characterized by prehospital initiation of treatment, optional use of glycoprotein IIb/IIIa inhibitors and novel P2Y12 inhibitors, and radial-artery PCI access use is unknown.


 Methods

We randomly assigned 2218 patients with ST-segment elevation myocardial infarction (STEMI) who were being transported for primary PCI to receive either bivalirudin or unfractionated or low-molecular-weight heparin with optional glycoprotein IIb/IIIa inhibitors (control group). The primary outcome at 30 days was a composite of death or major bleeding not associated with coronary-artery bypass grafting (CABG), and the principal secondary outcome was a composite of death, reinfarction, or non-CABG major bleeding.

 Results

Bivalirudin, as compared with the control intervention, reduced the risk of the primary outcome (5.1% vs. 8.5%; relative risk, 0.60; 95% confidence interval [CI], 0.43 to 0.82; P=0.001) and the principal secondary outcome (6.6% vs. 9.2%; relative risk, 0.72; 95% CI, 0.54 to 0.96; P=0.02). Bivalirudin also reduced the risk of major bleeding (2.6% vs. 6.0%; relative risk, 0.43; 95% CI, 0.28 to 0.66; P<0.001). The risk of acute stent thrombosis was higher with bivalirudin (1.1% vs. 0.2%; relative risk, 6.11; 95% CI, 1.37 to 27.24; P=0.007). There was no significant difference in rates of death (2.9% vs. 3.1%) or reinfarction (1.7% vs. 0.9%). Results were consistent across subgroups of patients.

 Conclusions

Bivalirudin, started during transport for primary PCI, improved 30-day clinical outcomes with a reduction in major bleeding but with an increase in acute stent thrombosis. (Funded by the Medicines Company; EUROMAX ClinicalTrials.gov number, NCT01087723.)

  Source Information

The authors’ affiliations are listed in the Appendix.
Dr. Steg at Cardiologie, Département Hospitalo-Universitaire FIRE, Hôpital Bichat, Assistance Publique–Hôpitaux de Paris,  Paris, France, or at gabriel.steg@bch.aphp.fr.
A complete list of the European Ambulance Acute Coronary Syndrome Angiography (EUROMAX) investigators is provided in the Supplementary Appendix, available at NEJM.org.


Read Full Post »

Larry H Bernstein, MD, FCAP, Reporter and Curator

http://pharmaceuticalintelligence.com/2013-12-07/larryhbern/Epigenomics and Companion Diagnostics

The development of epigenomics has reached a new stage.  Therapeutics has long been hampered from making important inroads to personalized medicine by the inability to differentiate patients with the same disorder having subvariants that react favorably and others that fail a treatment with an expected response.  These developments in diagnostics have been needed and rely specifically on laboratory-based diagnostics.  As these developments unfold, it will ba a very significant challenge to the clinical laboratory industry in the education and staffing of technologists.  This is already at a time that laboratory post-bacchalaureate education and staffing and accreditation of laboratories has not yet caught up to the need.

Epigenetics: Diagnostic and Therapeutic Applications

DDD Dec07, 2013

RiboMed and NuvOx Pharma to Collaborate on Brain Cancer Drug and Companion Diagnostic Test

RiboMed Biotechnologies, Inc. and NuvOx Pharma today jointly announced that they have entered into a collaborative agreement that will utilize RiboMed’s epigenetic biomarker test, GliomaSTRAT™, to characterize tumors from brain cancer patients and correlate response to NuvOx’s new drug, NVX-108 in the treatment of Glioblastoma multiforme (GBM).
“Our goal at RiboMed is to develop Companion Diagnostic tests that will help to prevent the treatment of patients with drugs to which they will not respond,” said Dr. Michelle Hanna, CEO and Scientific Director at RiboMed.
Carlsbad, CA and Tucson, AZ (PRWEB) December 05, 2013
RiboMed Biotechnologies, Inc. and NuvOx Pharma today jointly announced that they have entered into a collaborative agreement that will utilize
  • RiboMed’s epigenetic biomarker test, GliomaSTRAT™, to characterize tumors from brain cancer patients and
  • correlate response to NuvOx’s new drug, NVX-108 in the treatment of Glioblastoma multiforme (GBM).
NVX-108 is an intravenously delivered drug that, in animal models, increases the concentration of oxygen in tumors and consequently increases tumor sensitivity to radiation treatment. In animals implanted with human tumors which are resistant to radiation because they are low in oxygen, NVX-108 increased tumor oxygen levels by 400% and prolonged survival of the animals with tumors that were treated with radiation.
“The Phase 1B will begin early in Q1 2014 to evaluate the safety and efficacy of NVX-108 in combination with the current standard of care. We anticipate that incorporating RiboMed’s GliomaSTRAT into our Phase 1B clinical protocol will improve our ability to further stratify the resulting clinical data to ascertain optimal dosing and corresponding benefit of NVX-108 to patients with this disease, for which there are no good therapies,” noted NuvOx’s Chief Business Officer David Wilson.
The standard of care for patients with Glioblastoma brain cancer is surgery, followed by a 6-week course of radiation therapy and treatment with temozolomide. The patient’s response to treatment depends upon their tumor’s sensitivity to both the radiation and to the drug. RiboMed’s GliomaSTRAT is a DNA methylation based test that stratifies brain tumors into 4 groups, by
  • both grade (low grade vs high grade) and
  • response to certain chemotherapeutic drugs, including temozolomide (Temodar®).
“Our goal at RiboMed is to develop Companion Diagnostic tests that will help to prevent the treatment of patients with drugs to which they will not respond,” said Dr. Michelle Hanna, CEO and Scientific Director at RiboMed. “Given the differential response of high grade and low grade tumors to radiation, this stratification step could identify the patients that are most likely to benefit from treatment with NVX-108.”
RiboMed’s technology for epigenetic testing provides up to 100-fold greater sensitivity than competing methods. Tests utilize RiboMed’s bisulfite-free, methylated DNA enrichment process, MethylMagnet®, and their proprietary biomarker detection technology, Abscription®, which together in MethylMeter® provide superior sensitivity and specificity for the detection of DNA methylation in clinical samples. MethylMeter®
  • allows quantitative analysis of DNA methylation,
  • even with small samples containing damaged DNA, including formalin fixed paraffin embedded (FFPE) tissues.

About RiboMed

RiboMed Biotechnologies, Inc. (http://www.ribomed.com) is a College of American Pathology (CAP) accredited and CLIA-certified molecular diagnostic clinical laboratory and Contract Research Organization. The RiboMed Clinical Services Laboratory offers DNA methylation based tests for cancer and drug response related biomarkers to physicians and for use in clinical trials, as well as development services to research institutions and Pharma. Research Use Only (RUO) kits, reagents, and technology licensing are also available. More information can be requested at info(at)  http://ribomed.com.

About NuvOx

NuvOx was founded in 2008, after in-licensing NVX-108 for therapeutic applications, after it was demonstrated to be safe and effective as an ultrasound contrast imaging agent in more than 2200 patients. Serving as an oxygen therapeutic, previously demonstrated to be safe in humans, testing in animal models has demonstrated potential therapeutic application for sensitization to radiation treatment in many cancers, the mitigation of brain damage from stroke, heart damage from heart attack and general tissue destruction resulting from hemorrhagic shock. For additional information, please contact David Wilson at dwilson(at)nuvoxpharma(dot)com or call +1 (520) 624-6688 x1004.  http://www.nuvoxpharma.com.

Disclosure Regarding Forward-Looking Statements

Except for historical information contained herein, the matters set forth in this press release, including statements regarding the Company’s expectations, are forward-looking statements within the meaning of the “safe harbor” provisions of the Private Securities Litigation Reform Act of 1995. These forward-looking statements are subject to risks and uncertainties that may cause actual results to differ materially, including the risks and uncertainties associated with market demand for and acceptance and use of technology and tests such as the GliomaSTRAT test and NVX-108, separately or in combination, reliance upon the collaborative efforts of other parties including without limitation NuvOx, RiboMed or third parties obtaining or maintaining regulatory approvals that impact the Company’s business, government regulation particularly with respect to diagnostic products and laboratory developed tests, the Company’s ability to develop and commercialize technologies and products, particularly new technologies such as laboratory developed tests and genetic analysis platforms, the Company’s financial position, the Company’s ability to manage its existing cash resources or raise additional cash resources, competition, intellectual property protection and intellectual property rights of others, litigation involving the Company, and other risks. These forward-looking statements are based on current information that may change and you are cautioned not to place undue reliance on these forward-looking statements, which speak only as of the date of this press release. All forward-looking statements are qualified in their entirety by this cautionary statement, and the Company undertakes no obligation to revise or update any forward-looking statement to reflect events or circumstances after the issuance of this press release.
SOURCE: RiboMed Biotechnologies, Inc. and NuvOx Pharma, LLC

Epigenomics FDA Advisory Panel Date to Review Epi proColon®

Jordan deVos Marketing Specialist at Epigenomics AG

Epigenomics has announced that the Company was informed by the U.S. Food and Drug Administration (FDA) via the premarket approval (PMA) review process for Epi proColon® that the Meeting of the Molecular and Clinical Genetics Panel of the Medical Devices Advisory Committee has been tentatively scheduled for Tuesday, March 25th, 2014. Epi proColon® is Epigenomics’ blood-based screening test for colorectal cancer.
Epigenomics AG Announces FDA Advisory Committee Meeting to Review Epi… epigenomics.com
Berlin, Germany, and U.S.A., November 27, 2013 – Epigenomics AG (Frankfurt Prime Standard: ECX, OTC: EPGNY), the German-American cancer molecular diagnostics company, today announced that the Company was informed by the U.S. Food and Drug…

Read Full Post »

Larry H Bernstein, MD, FCAP, reporter and curator

htto://pharmaceuticalintelligence.com/2013-12-07/larryhbern/Advances-in-Stem-Cell-Research

The amount of success in stem cell research and recent successes is notable.

GEN News  Dec 5, 2013
Stem Cell Leaders Call for Human Embryome Project

Just as an international consortium was formed to map and sequence the human genome, now a group of stem cell and regenerative medicine scientists say it’s critical that such an effort be ramped up to do a similar project focused on the human embryome.

This was the key message of a panel discussion, “From Mapping the Genome to Mapping the Embryome: The Urgent Need for an International Initiative,” moderated by Michael West, Ph.D., CEO of Biotime. It took place at the World Stem Cell Summit, which is taking place this week in San Diego.

“It is becoming increasingly clear in regenerative medicine that pluripotent stem cells, embryonic stem cells, and IPs cells will be as fundamentally important to medicine as was DNA. Maybe even bigger because you can genetically engineer these cells,” said Dr. West.

Dr. West and his colleagues adamantly believe that there needs to be a large international effort aimed at mapping the cellular and molecular basis of all human life starting with the fertilized egg and working its way up to the body of the adult. This is what it is termed the embryome.

“The opportunity presented by pluripotent stem cells to manufacture for the first time in the history of medicine all of the cellular components of the human body on an industrial scale is at once both an opportunity and a challenge,” said Dr. West. “The opportunity is to build a new field we call regenerative medicine in which many currently incurable diseases are treated with cells capable of regenerating tissues afflicted with disease. The challenge relates to the complexity of the cell types in the body and our ability to manufacture products with precisely defined compositions for human clinical use.”

Dr. West went on to say that to get these different types of stem cells into the clinic, and approved by the FDA, researchers will fully need to understand all aspects of the biology of these cells. An identification and understanding of any contaminating cells will also be essential to success in this field. The question to ask is “What is in the syringe?”

Unlike recombinant DNA, continued Dr. West, the contaminants in pluripotent stem cells are alive and may make things that are undesirable at the intended point of therapy. For example, you might have a bioreactor full of cells that are making heart muscle to regenerate heart function in a patient. But you have to be careful that your cells are not contaminated with neural crest cells from the head area which could generate a tooth along with the heart muscle.

“These contaminants, if you do not remove them, can lead to years of delay in filing an IND and a runup in costs as you try to identify these cells,” explained Dr. West.

The major problem in identifying them, according to Dr. West, is that no one has ever mapped the molecular markers or even a rudimentary cell ontology tree, i.e., mapped out the tree from the fertilized egg to the cells of the human body.

“If [there were] a detailed map of all the cellular and molecular components of life from the fertilized egg to adulthood, and then databased in a manner to the information in the human genome, medicine would be the true beneficiary,” added Dr. West. “That’s why we have made this call for an international initiative.”

Also, watch our video “A Brief History of Stem Cells” to see a timeline spanning over 60 years of stem cell research.

Mary Ann Liebert Wins Stem Cell Education Award

Mary Ann Liebert, president and CEO of Mary Ann Liebert Inc., and publisher of GEN, was presented with the Stem Cell Education Award by the Genetics Policy Institute. The award was given during a ceremony at dinner which took place at the World Stem Cell Summit, which is being held in San Diego this week.

Liebert was cited for her outstanding “work in educating patients, researchers, and the broader stem cell community, and in raising the standard in medical research journalism.” Among the seventy journals the Liebert company publishes is the peer-reviewed Stem Cells and Development.

In her acceptance speech Liebert told the audience that she was extremely gratified in being so recognized and thanked the entire staff at her company for their dedication in helping to promote excellence in medical publishing.

In his introductory remarks during the award ceremony GEN’s long-time editor in chief John Sterling noted that Mary Ann always encourages her editors and writers “to inform, enlighten when they can, and educate as much as possible.”

Sterling added that while she started her company 33 years ago her vision for her publications remains the same: “to help advance our knowledge of science and medicine in the best ways possible.”


Neural Precursors “Cure MS” in Mice

During a session at the this week’s World Stem Cell Summit in San Diego, an international research team described an “astonishing” experiment in which a mouse model of multiple sclerosis was able to virtually totally recover and move normally after being transplanted with human neural precursor cells (hNPC). The scientists were able to show almost full recovery in the mice up to six months later.

The investigators, led by Jeanne Loring, Ph.D., from the Scripps Research Institute, included scientists from the University of California, Irvine and a group from Australia.

“Our goal was to demonstrate cell therapy for MS,” Dr. Loring told the audience.

According to Ronald Coleman, a graduate student working with Dr. Loring and who is at UC-Irvine, the team used mice infected with a neurotropic JHM variant of mouse hepatitis virus (JHMV) as a model for MS. They injected hNPCs derived from human pluripotent stem cells (hPSC) into the mice to explore treatment options for the disease.

The results were indeed astonishing, said Dr. Loring. Non-control mice were able to move about in a manner that can be described as consistent and long lasting. T-cell proliferation was reduced and T regulatory cell induction took place. The spinal cords of the mice not only did not undergo further demyelination but actually exhibited remyelination. The control mice dragged their legs around when they tried to move.

“The only problem was that the hNPCs themselves are not directly responsible for the cure. They are not even there when the mice start walking,” explained Dr. Loring. “Those cells are rejected after seven days and we start to see a therapeutic response in three weeks.”

Both Dr. Loring and Coleman believe that the hNPCs are secreting proteins, like cytokines, that do the actual repair work in the CNS of the mice.

“We identified a set of candidate proteins secreted by hNPCs and not by undifferentiated pluripotent stem cells,” continued Dr. Loring, who said the team plans to continue building on this initial research.


World Stem Cell Summit: December 4, 2013 Update

GEN is on the scene at the World Stem Cell Summit in San Diego. Here are some highlights from the conference so far:

Bernard Siegel, J.D., founder and co-chair of the World Stem Cell Summit (WSCS) and executive director of Genetics Policy Institute, today welcomed attendees of WSCS 2013, being held December 4–6, in San Diego, CA.

“Stem cell science represents, to those afflicted with chronic disease, a vehicle for modeling disease and therapeutic development,” states Siegel in World Stem Cell Report 2013, a supplement to Stem Cells and Development (2013;22;Suppl1). “The field is a true scientific revolution and reflects the transformative power of hope, a powerful engine for progress.”

“The future is here now,” says Mahendra Rao, M.D., Ph.D., director, NIH Center for Regenerative Medicine, who delivered a plenary keynote and moderated the plenary panel discussion, “How Stem Cells are Transforming Medicine.” Cell therapies have been used to treat people safely and effectively; the technical barriers have been addressed. The challenge now is to reduce the cost of manufacturing. To drive routine adoption of cell therapy it must be cost effective and must demonstrate more than incremental benefit, according to Dr. Rao.

Professor Teruo Okano, Ph.D., Tokyo Women’s Medical University, described his group’s Cell Sheet Tissue Engineering strategy that involves enzymatic membrane disruption during cell harvesting and growth of an autologous cell sheet for transplantation on an “intelligent surface” that reversibly changes properties from hydrophobic to hydrophilic with a reversible in temperature from 37°C to 20°C. Dr. Okano further described the development of an automatic tissue factory and thick tissue evaluation system for fully automated, industrialized GMP cell processing.

Andre Terzic, M.D., Ph.D., Center for Regenerative Medicine, Mayo Clinic, noted during the opening session of the WSCS that “the Mayo Clinic has embraced regenerative medicine as a strategy for the future of medicine,” and he described their blueprint for moving from knowledge to delivery of treatments and procedures. Education is a critical dimension of this process. Another important component, according to Dr. Terzic, is the Regenerative Medicine Biotrust, in which “the patient is the center of the solution” to develop combinations of diagnostics and therapeutics and conduct clinical trials.

Regardless of the outcomes of current or future clinical trials, “I would argue that we have already seen breakthroughs,” said Evan Snyder, Ph.D., Sanford-Burnham Medical Research Institute, as stem cells “have completely changed the way medicine thinks about disease and development.” They have led to new views on plasticity and regeneration and the development of different types of drug targets.

WSCS 2013 is organized by the Genetics Policy Institute (GPI), California Institute for Regenerative Medicine (CIRM), Institute for Integrated Cell-Material Sciences at Kyoto University (iCeMS), Mayo Clinic, Sanford-Burnham Medical Research Institute, and The Scripps Research Institute. Mary Ann Liebert, Inc. publishers and Genetic Engineering & Biotechnology News (GEN) are sponsors of the summit.

Drug Testing Should Be with Human iPS Cells
Fri, 12/06/2013 – drug discovery & development  (DDD)

Once established such neural stem cells can be used to continuously generate neurons for drug testing and disease modeling. Depicted is an immunofluorescence staining where proteins characteristic of neural stem cells are labeled with fluorescing antibodies (Nestin in green, Dach1 in red). (Source: Jerome Mertens / Uni Bonn)Once established such neural stem cells can be used to continuously generate neurons for drug testing and disease modeling. Depicted is an immunofluorescence staining where proteins characteristic of neural stem cells are labeled with fluorescing antibodies (Nestin in green, Dach1 in red). (Source: Jerome Mertens / Uni Bonn)Why do certain Alzheimer medications work in animal models but not in clinical trials in humans? A research team from the University of Bonn and the biomedical enterprise Life & Brain GmbH has been able to show that results of established test methods with animal models and cell lines used up until now can hardly be translated to the processes in the human brain. Drug testing should therefore be conducted with human nerve cells, conclude the scientists. The results are published by Cell Press in the journal Stem Cell Reports.

In the brains of Alzheimer’s patients, deposits form that consist essentially of beta-amyloid and are harmful to nerve cells. Scientists are therefore searching for pharmaceutical compounds that prevent the formation of these dangerous aggregates. In animal models, certain non-steroidal anti-inflammatory drugs (NSAIDs) were found to a reduced formation of harmful beta-amyloid variants. Yet, in subsequent clinical studies, these NSAIDs failed to elicit any beneficial effects.

“The reasons for these negative results have remained unclear for a long time”, said Oliver Brüstle, director of the Institute for Reconstructive Neurobiology of the University of Bonn and CEO of Life & Brain GmbH. “Remarkably, these compounds were never tested directly on the actual target cells—the human neuron”, added lead author Jerome Mertens of Brüstle’s team, who now works at the Laboratory of Genetics in La Jolla (USA). This is because, so far, living human neurons have been extremely difficult to obtain. However, with the recent advances in stem cell research it has become possible to derive limitless numbers of brain cells from a small skin biopsy or other adult cell types.

Scientists transform skin cells into nerve cells

Now a research team from the Institute for Reconstructive Neurobiology and the Department of Neurology of the Bonn University Medical Center together with colleagues from the Life & Brain GmbH and the University of Leuven (Belgium) has obtained such nerve cells from humans. The researchers used skin cells from two patients with a familial form of Alzheimer’s Disease to produce so-called induced pluripotent stem cells (iPS cells), by reprogramming the body’s cells into a quasi-embryonic stage. They then transformed the resulting iPS cells into nerve cells.

Using these human neurons, the scientists tested several compounds in the group of NSAIDs. As control, the researchers used nerve cells they had obtained from iPS cells of donors who did not have the disease. Both in the nerve cells obtained from the Alzheimer’s patients and in the control cells, the NSAIDs that had previously tested positive in the animal models and cell lines typically used for drug screening had practically no effect: The values for the harmful beta-amyloid variants that form the feared aggregates in the brain remained unaffected when the cells were treated with clinically relevant dosages of these compounds.

Metabolic processes in animal models differ from humans

“In order to predict the efficacy of Alzheimer drugs, such tests have to be performed directly on the affected human nerve cells”, concluded Brüstle’s colleague Philipp Koch, who led the study. Why do NSAIDs decrease the risk of aggregate formation in animal experiments and cell lines but not in human neurons? The scientists explain this with differences in metabolic processes between these different cell types. “The results are simply not transferable”, says Koch.

The scientists now hope that in the future, testing of potential drugs for the treatment of Alzheimer’s disease will be increasingly conducted using neurons obtained from iPS cells of patients. “The development of a single drug takes an average of ten years”, said Brüstle. “By using patient-specific nerve cells as a test system, investments by pharmaceutical companies and the tedious search for urgently needed Alzheimer medications could be greatly streamlined”.

Date: November 6, 2013
Source: University of Bonn


Read Full Post »

Read Full Post »

Special Issue: Silicon Valley: Global model or unique anomaly by Social Science Information/SSI – A Sage Publications international  journal

Reporter: Aviva Lev-Ari, PhD, RN


Table of Contents

December 2013; 52 (4)

Special Issue: Silicon Valley: Global model

or unique anomaly/Numéro spécial: La

Silicon Valley: Modèle global ou anomalie

singulière

Guest editor: Henry Etzkowitz

Henry Etzkowitz

Silicon Valley at risk? Sustainability of a global innovation icon: An introduction

to the Special Issue

Social Science Information December 2013 52: 515-538,

doi:10.1177/0539018413501946

Doug Henton and Kim Held

The dynamics of Silicon Valley: Creative destruction and the evolution of the

innovation habitat

Social Science Information December 2013 52: 539-557,

doi:10.1177/0539018413497542

James C Williams

From white gold to silicon chips: Hydraulic technology, electric power and

Silicon Valley

Social Science Information December 2013 52: 558-574,

doi:10.1177/0539018413497834

Annika Steiber and Sverker Alänge

The formation and growth of Google: A firm-level triple helix perspective

Social Science Information December 2013 52: 575-604,

doi:10.1177/0539018413497833

Henry Etzkowitz

StartX and the ‘Paradox of Success’: Filling the gap in Stanford’s

entrepreneurial culture

Social Science Information December 2013 52: 605-627,

doi:10.1177/0539018413498833

Steven Casper

New-technology clusters and public policy: Three perspectives

Social Science Information December 2013 52: 628-652,

doi:10.1177/0539018413501236

Helen Lawton Smith, John Glasson, Saverio Romeo, Rupert Waters, and Andrew

Chadwick

Entrepreneurial regions: Evidence from Oxfordshire and Cambridgeshire

Social Science Information December 2013 52: 653-673,

doi:10.1177/0539018413499978

Calls for Papers: Triple Helix: A Journal of University-Industry-Government

Innovation and Entrepreneurship (THJI)

Social Science Information December 2013 52: 674-675,

doi:10.1177/0539018413508639

SOURCE

From: Henry Etzkowitz <h.etzko@googlemail.com>
Date: Fri, 6 Dec 2013 11:04:05 -0800
Subject: Fwd: Dec SSI

Anne Rocha Perazzo
Editor in chief
Social Science Information/SSI
A Sage Publications international  journal
http://ssi.sagepub.com/

rochaperazzo.anne@gmail.com

Managing Editor
Triple Helix: A Journal of
University-Industry-Government Innovation and Entrepreneurship
A SpringerOpen journal
http://www.springer.com/economics/r+%26+d/journal/40604

Scientific Coordinator
European Network of Organizational
& Work Psychologists ‘ENOP’

Skype ID annerochaperazzo

Room 333
190-198 avenue de France
CS n° 71345
75648 PARIS cedex 13
France

Read Full Post »

« Newer Posts - Older Posts »