Feeds:
Posts
Comments

Posts Tagged ‘Artificial intelligence’

The potential contribution of informatics to healthcare is more than currently estimated

Reporter: Larry H Bernstein, MD, FCAP


I call attention to an interesting article that just came out.   The estimate of improved costsavings in healthcare and diagnostic accuracy is extimated to be substantial.   I have written about the unused potential that we have not yet seen.  In short, there is justification in substantial investment in resources to this, as has been proposed as a critical goal.  Does this mean a reduction in staffing?  I wouldn’t look at it that way.  The two huge benefits that would accrue are:


  1. workflow efficiency, reducing stress and facilitating decision-making.
  2. scientifically, primary knowledge-based  decision-support by well developed algotithms that have been at the heart of computational-genomics.


Can computers save health care? IU research shows lower costs, better outcomes

Cost per unit of outcome was $189, versus $497 for treatment as usual

 Last modified: Monday, February 11, 2013


BLOOMINGTON, Ind. — New research from Indiana University has found that machine learning — the same computer science discipline that helped create voice recognition systems, self-driving cars and credit card fraud detection systems — can drastically improve both the cost and quality of health care in the United States.


 Physicians using an artificial intelligence framework that predicts future outcomes would have better patient outcomes while significantly lowering health care costs.


Using an artificial intelligence framework combining Markov Decision Processes and Dynamic Decision Networks, IU School of Informatics and Computing researchers Casey Bennett and Kris Hauser show how simulation modeling that understands and predicts the outcomes of treatment could


  • reduce health care costs by over 50 percent while also
  • improving patient outcomes by nearly 50 percent.


The work by Hauser, an assistant professor of computer science, and Ph.D. student Bennett improves upon their earlier work that


  • showed how machine learning could determine the best treatment at a single point in time for an individual patient.


By using a new framework that employs sequential decision-making, the previous single-decision research


  • can be expanded into models that simulate numerous alternative treatment paths out into the future;
  • maintain beliefs about patient health status over time even when measurements are unavailable or uncertain; and
  • continually plan/re-plan as new information becomes available.

In other words, it can “think like a doctor.”  (Perhaps better because of the limitation in the amount of information a bright, competent physician can handle without error!)


“The Markov Decision Processes and Dynamic Decision Networks enable the system to deliberate about the future, considering all the different possible sequences of actions and effects in advance, even in cases where we are unsure of the effects,” Bennett said.  Moreover, the approach is non-disease-specific — it could work for any diagnosis or disorder, simply by plugging in the relevant information.  (This actually raises the question of what the information input is, and the cost of inputting.)


The new work addresses three vexing issues related to health care in the U.S.:


  1. rising costs expected to reach 30 percent of the gross domestic product by 2050;
  2. a quality of care where patients receive correct diagnosis and treatment less than half the time on a first visit;
  3. and a lag time of 13 to 17 years between research and practice in clinical care.

  Framework for Simulating Clinical Decision-Making


“We’re using modern computational approaches to learn from clinical data and develop complex plans through the simulation of numerous, alternative sequential decision paths,” Bennett said. “The framework here easily out-performs the current treatment-as-usual, case-rate/fee-for-service models of health care.”  (see the above)


Bennett is also a data architect and research fellow with Centerstone Research Institute, the research arm of Centerstone, the nation’s largest not-for-profit provider of community-based behavioral health care. The two researchers had access to clinical data, demographics and other information on over 6,700 patients who had major clinical depression diagnoses, of which about 65 to 70 percent had co-occurring chronic physical disorders like diabetes, hypertension and cardiovascular disease.  Using 500 randomly selected patients from that group for simulations, the two


  • compared actual doctor performance and patient outcomes against
  • sequential decision-making models

using real patient data.

They found great disparity in the cost per unit of outcome change when the artificial intelligence model’s


  1. cost of $189 was compared to the treatment-as-usual cost of $497.
  2. the AI approach obtained a 30 to 35 percent increase in patient outcomes
Bennett said that “tweaking certain model parameters could enhance the outcome advantage to about 50 percent more improvement at about half the cost.”


While most medical decisions are based on case-by-case, experience-based approaches, there is a growing body of evidence that complex treatment decisions might be effectively improved by AI modeling.  Hauser said “Modeling lets us see more possibilities out to a further point –  because they just don’t have all of that information available to them.”  (Even then, the other issue is the processing of the information presented.)


Using the growing availability of electronic health records, health information exchanges, large public biomedical databases and machine learning algorithms, the researchers believe the approach could serve as the basis for personalized treatment through integration of diverse, large-scale data passed along to clinicians at the time of decision-making for each patient. Centerstone alone, Bennett noted, has access to health information on over 1 million patients each year. “Even with the development of new AI techniques that can approximate or even surpass human decision-making performance, we believe that the most effective long-term path could be combining artificial intelligence with human clinicians,” Bennett said. “Let humans do what they do well, and let machines do what they do well. In the end, we may maximize the potential of both.”


Artificial Intelligence Framework for Simulating Clinical Decision-Making: A Markov Decision Process Approach” was published recently in Artificial Intelligence in Medicine. The research was funded by the Ayers Foundation, the Joe C. Davis Foundation and Indiana University.


For more information or to speak with Hauser or Bennett, please contact Steve Chaplin, IU Communications, at 812-856-1896 or stjchap@iu.edu.


IBM Watson Finally Graduates Medical School


It’s been more than a year since IBM’s Watson computer appeared on Jeopardy and defeated several of the game show’s top champions. Since then the supercomputer has been furiously “studying” the healthcare literature in the hope that it can beat a far more hideous enemy: the 400-plus biomolecular puzzles we collectively refer to as cancer.


Anomaly Based Interpretation of Clinical and Laboratory Syndromic Classes

Larry H Bernstein, MD, Gil David, PhD, Ronald R Coifman, PhD.  Program in Applied Mathematics, Yale University, Triplex Medical Science.


 Statement of Inferential  Second Opinion

 Realtime Clinical Expert Support and Validation System

Gil David and Larry Bernstein have developed, in consultation with Prof. Ronald Coifman, in the Yale University Applied Mathematics Program, a software system that is the equivalent of an intelligent Electronic Health Records Dashboard that provides
  • empirical medical reference and suggests quantitative diagnostics options.

Background

The current design of the Electronic Medical Record (EMR) is a linear presentation of portions of the record by
  • services, by
  • diagnostic method, and by
  • date, to cite examples.

This allows perusal through a graphical user interface (GUI) that partitions the information or necessary reports in a workstation entered by keying to icons.  This requires that the medical practitioner finds

  • the history,
  • medications,
  • laboratory reports,
  • cardiac imaging and EKGs, and
  • radiology
in different workspaces.  The introduction of a DASHBOARD has allowed a presentation of
  • drug reactions,
  • allergies,
  • primary and secondary diagnoses, and
  • critical information about any patient the care giver needing access to the record.
 The advantage of this innovation is obvious.  The startup problem is what information is presented and how it is displayed, which is a source of variability and a key to its success.

Proposal

We are proposing an innovation that supercedes the main design elements of a DASHBOARD and
  • utilizes the conjoined syndromic features of the disparate data elements.
So the important determinant of the success of this endeavor is that it facilitates both
  1. the workflow and
  2. the decision-making process
  • with a reduction of medical error.
 This has become extremely important and urgent in the 10 years since the publication “To Err is Human”, and the newly published finding that reduction of error is as elusive as reduction in cost.  Whether they are counterproductive when approached in the wrong way may be subject to debate.
We initially confine our approach to laboratory data because it is collected on all patients, ambulatory and acutely ill, because the data is objective and quality controlled, and because
  • laboratory combinatorial patterns emerge with the development and course of disease.  Continuing work is in progress in extending the capabilities with model data-sets, and sufficient data.
It is true that the extraction of data from disparate sources will, in the long run, further improve this process.  For instance, the finding of both ST depression on EKG coincident with an increase of a cardiac biomarker (troponin) above a level determined by a receiver operator curve (ROC) analysis, particularly in the absence of substantially reduced renal function.
The conversion of hematology based data into useful clinical information requires the establishment of problem-solving constructs based on the measured data.  Traditionally this has been accomplished by an intuitive interpretation of the data by the individual clinician.  Through the application of geometric clustering analysis the data may interpreted in a more sophisticated fashion in order to create a more reliable and valid knowledge-based opinion.
The most commonly ordered test used for managing patients worldwide is the hemogram that often incorporates the review of a peripheral smear.  While the hemogram has undergone progressive modification of the measured features over time the subsequent expansion of the panel of tests has provided a window into the cellular changes in the production, release or suppression of the formed elements from the blood-forming organ to the circulation.  In the hemogram one can view data reflecting the characteristics of a broad spectrum of medical conditions.
Progressive modification of the measured features of the hemogram has delineated characteristics expressed as measurements of
  • size,
  • density, and
  • concentration,
resulting in more than a dozen composite variables, including the
  1. mean corpuscular volume (MCV),
  2. mean corpuscular hemoglobin concentration (MCHC),
  3. mean corpuscular hemoglobin (MCH),
  4. total white cell count (WBC),
  5. total lymphocyte count,
  6. neutrophil count (mature granulocyte count and bands),
  7. monocytes,
  8. eosinophils,
  9. basophils,
  10. platelet count, and
  11. mean platelet volume (MPV),
  12. blasts,
  13. reticulocytes and
  14. platelet clumps,
  15. perhaps the percent immature neutrophils (not bands)
  16. as well as other features of classification.
The use of such variables combined with additional clinical information including serum chemistry analysis (such as the Comprehensive Metabolic Profile (CMP)) in conjunction with the clinical history and examination complete the traditional problem-solving construct. The intuitive approach applied by the individual clinician is limited, however,
  1. by experience,
  2. memory and
  3. cognition.
The application of rules-based, automated problem solving may provide a more reliable and valid approach to the classification and interpretation of the data used to determine a knowledge-based clinical opinion.
The classification of the available hematologic data in order to formulate a predictive model may be accomplished through mathematical models that offer a more reliable and valid approach than the intuitive knowledge-based opinion of the individual clinician.  The exponential growth of knowledge since the mapping of the human genome has been enabled by parallel advances in applied mathematics that have not been a part of traditional clinical problem solving.  In a univariate universe the individual has significant control in visualizing data because unlike data may be identified by methods that rely on distributional assumptions.  As the complexity of statistical models has increased, involving the use of several predictors for different clinical classifications, the dependencies have become less clear to the individual.  The powerful statistical tools now available are not dependent on distributional assumptions, and allow classification and prediction in a way that cannot be achieved by the individual clinician intuitively. Contemporary statistical modeling has a primary goal of finding an underlying structure in studied data sets.
In the diagnosis of anemia the variables MCV,MCHC and MCH classify the disease process  into microcytic, normocytic and macrocytic categories.  Further consideration of
proliferation of marrow precursors,
  • the domination of a cell line, and
  • features of suppression of hematopoiesis

provide a two dimensional model.  Several other possible dimensions are created by consideration of

  • the maturity of the circulating cells.
The development of an evidence-based inference engine that can substantially interpret the data at hand and convert it in real time to a “knowledge-based opinion” may improve clinical problem solving by incorporating multiple complex clinical features as well as duration of onset into the model.
An example of a difficult area for clinical problem solving is found in the diagnosis of SIRS and associated sepsis.  SIRS (and associated sepsis) is a costly diagnosis in hospitalized patients.   Failure to diagnose sepsis in a timely manner creates a potential financial and safety hazard.  The early diagnosis of SIRS/sepsis is made by the application of defined criteria (temperature, heart rate, respiratory rate and WBC count) by the clinician.   The application of those clinical criteria, however, defines the condition after it has developed and has not provided a reliable method for the early diagnosis of SIRS.  The early diagnosis of SIRS may possibly be enhanced by the measurement of proteomic biomarkers, including transthyretin, C-reactive protein and procalcitonin.  Immature granulocyte (IG) measurement has been proposed as a more readily available indicator of the presence of
  • granulocyte precursors (left shift).
The use of such markers, obtained by automated systems in conjunction with innovative statistical modeling, may provide a mechanism to enhance workflow and decision making.
An accurate classification based on the multiplicity of available data can be provided by an innovative system that utilizes  the conjoined syndromic features of disparate data elements.  Such a system has the potential to facilitate both the workflow and the decision-making process with an anticipated reduction of medical error.

This study is only an extension of our approach to repairing a longstanding problem in the construction of the many-sided electronic medical record (EMR).  On the one hand, past history combined with the development of Diagnosis Related Groups (DRGs) in the 1980s have driven the technology development in the direction of “billing capture”, which has been a focus of epidemiological studies in health services research using data mining.

In a classic study carried out at Bell Laboratories, Didner found that information technologies reflect the view of the creators, not the users, and Front-to-Back Design (R Didner) is needed.  He expresses the view:

“Pre-printed forms are much more amenable to computer-based storage and processing, and would improve the efficiency with which the insurance carriers process this information.  However, pre-printed forms can have a rather severe downside. By providing pre-printed forms that a physician completes
to record the diagnostic questions asked,
  • as well as tests, and results,
  • the sequence of tests and questions,
might be altered from that which a physician would ordinarily follow.  This sequence change could improve outcomes in rare cases, but it is more likely to worsen outcomes. “

Decision Making in the Clinical Setting.   Robert S. Didner

 A well-documented problem in the medical profession is the level of effort dedicated to administration and paperwork necessitated by health insurers, HMOs and other parties (ref).  This effort is currently estimated at 50% of a typical physician’s practice activity.  Obviously this contributes to the high cost of medical care.  A key element in the cost/effort composition is the retranscription of clinical data after the point at which it is collected.  Costs would be reduced, and accuracy improved, if the clinical data could be captured directly at the point it is generated, in a form suitable for transmission to insurers, or machine transformable into other formats.  Such data capture, could also be used to improve the form and structure of how this information is viewed by physicians, and form a basis of a more comprehensive database linking clinical protocols to outcomes, that could improve the knowledge of this relationship, hence clinical outcomes.
 How we frame our expectations is so important that
  • it determines the data we collect to examine the process.
In the absence of data to support an assumed benefit, there is no proof of validity at whatever cost.   This has meaning for
  • hospital operations, for
  • nonhospital laboratory operations, for
  • companies in the diagnostic business, and
  • for planning of health systems.
In 1983, a vision for creating the EMR was introduced by Lawrence Weed and others.  This is expressed by McGowan and Winstead-Fry.
J J McGowan and P Winstead-Fry. Problem Knowledge Couplers: reengineering evidence-based medicine through interdisciplinary development, decision support, and research.
Bull Med Libr Assoc. 1999 October; 87(4): 462–470.   PMCID: PMC226622    Copyright notice


Example of Markov Decision Process (MDP) trans...

Example of Markov Decision Process (MDP) transition automaton (Photo credit: Wikipedia)

Control loop of a Markov Decision Process

Control loop of a Markov Decision Process (Photo credit: Wikipedia)


English: IBM's Watson computer, Yorktown Heigh...

English: IBM’s Watson computer, Yorktown Heights, NY (Photo credit: Wikipedia)

English: Increasing decision stakes and system...

English: Increasing decision stakes and systems uncertainties entail new problem solving strategies. Image based on a diagram by Funtowicz, S. and Ravetz, J. (1993) “Science for the post-normal age” Futures 25:735–55 (http://dx.doi.org/10.1016/0016-3287(93)90022-L). (Photo credit: Wikipedia)


Read Full Post »


Demonstration of a diagnostic clinical laboratory neural network agent applied to three laboratory data conditioning problems

Izaak Mayzlin                                                                        Larry Bernstein, MD

Principal Scientist, MayNet                                            Technical Director

Boston, MA                                                                          Methodist Hospital Laboratory, Brooklyn, NY

Our clinical chemistry section services a hospital emergency room seeing 15,000 patients with chest pain annually.  We have used a neural network agent, MayNet, for data conditioning.  Three applications are – troponin, CKMB, EKG for chest pain; B-type natriuretic peptide (BNP), EKG for congestive heart failure (CHF); and red cell count (RBC), mean corpuscular volume (MCV), hemoglobin A2 (Hgb A2) for beta thalassemia.  Three data sets have been extensively validated prior to neural network analysis using receiver-operator curve (ROC analysis), Latent Class Analysis, and a multinomial regression approach.  Optimum decision points for classifying using these data were determined using ROC (SYSTAT, 11.0), LCM (Latent Gold), and ordinal regression (GOLDminer).   The ACS and CHF studies both had over 700 patients, and had a different validation sample than the initial exploratory population.  The MayNet incorporates prior clustering, and sample extraction features in its application.   Maynet results are in agreement with the other methods.

Introduction: A clinical laboratory servicing a hospital with an  emergency room seeing 15,000 patients with chest pain to produce over 2 million quality controlled chemistry accessions annually.  We have used a neural network agent, MayNet, to tackle the quality control of the information product.  The agent combines a statistical tool that first performs clustering of input variables by Euclidean distances in multi-dimensional space. The clusters are trained on output variables by the artificial neural network performing non-linear discrimination on clusters’ averages.  In applying this new agent system to diagnosis of acute myocardial infarction (AMI) we demonstrated that at an optimum clustering distance the number of classes is minimized with efficient training on the neural network. The software agent also performs a random partitioning of the patients’ data into training and testing sets, one time neural network training, and an accuracy estimate on the testing data set. Three examples to illustrate this are – troponin, CKMB, EKG for acute coronary syndrome (ACS); B-type natriuretic peptide (BNP), EKG for the estimation of ejection fraction in congestive heart failure (CHF); and red cell count (RBC), mean corpuscular volume (MCV), hemoglobin A2 (Hgb A2) for identifying beta thalassemia.  We use three data sets that have been extensively validated prior to neural network analysis using receiver-operator curve (ROC analysis), Latent Class Analysis, and a multinomial regression approach.

In previous studies1,2 CK-MB and LD1 sampled at 12 and 18 hours postadmission were near-optimum times used to form a classification by the analysis of information in the data set. The population consisted of 101 patients with and 41 patients without AMI based on review of the medical records, clinical presentation, electrocardiography, serial enzyme and isoenzyme  assays, and other tests. The clinical or EKG data, and other enzymes or sampling times were not used to form a classification but could be handled by the program developed. All diagnoses were established by cardiologist review. An important methodological problem is the assignment of a correct diagnosis by a “gold standard” that is independent of the method being tested so that the method tested can be suitably validated. This solution is not satisfactory in the case of myocardial infarction because of the dependence of diagnosis on a constellation of observations with different sensitivities and specificities. We have argued that the accuracy of diagnosis is  associated with the classes formed by combined features and has greatest uncertainty associated with a single measure.

Methods:  Neural network analysis is by MayNet, developed by one of the authors.  Optimum decision points for classifying using these data were determined using ROC (SYSTAT, 11.0), LCM (Latent Gold)3, and ordinal regression (GOLDminer)4.   Validation of the ACS and CHF study sets both had over 700 patients, and all studies had a different validation sample than the initial exploratory population.  The MayNet incorporates prior clustering, and sample extraction features in its application.   We now report on a new classification method and its application to diagnosis of acute myocardial infarction (AMI).  This method is based on the combination of clustering by Euclidean distances in multi-dimensional space and non-linear discrimination fulfilled by the Artificial Neural Network (ANN) trained on clusters’ averages.   These studies indicate that at an optimum clustering distance the number of classes is minimized with efficient training on the ANN. This novel approach to ANN reduces the number of patterns used for ANN learning and works also as an effective tool for smoothing data, removing singularities,  and increasing the accuracy of classification by the ANN. The studies  conducted involve training and testing on separate clinical data sets, which subsequently achieves a high accuracy of diagnosis (97%).

Unlike classification, which assumes the prior definition of borders between classes5,6, clustering procedure includes establishing these borders as a result of processing statistical information and using a given criteria for difference (distance) between classes.  We perform clustering using the geometrical (Euclidean) distance between two points in n-dimensional space, formed by n variables, including both input and output variables. Since this distance assumes compatibility of different variables, the values of all input variables are linearly transformed (scaled) to the range from 0 to 1.

The ANN technique for readers accustomed to classical statistics can be viewed as an extension of multivariate regression analyses with such new features as non-linearity and ability to process categorical data. Categorical (not continuous) variables represent two or more levels, groups, or classes of correspondent feature, and in our case this concept is used to signify patient condition, for example existence or not of AMI.

The ANN is an acyclic directed graph with input and output nodes corresponding respectively to input and output variables. There are also “intermediate” nodes, comprising so called “hidden” layers.  Each node nj is assigned the value xj that has been evaluated by the node’s “processing” element, as a non-linear function of the weighted sum of values xi of nodes ni, connected with nj by directed edges (ni, nj).

xj = f(wi(1),jxi(1) + wi(2),jxi(2) + … + wi(l),jxi(l)),

where xk is the value in node nk and wk,j is the “weight” of the edge (nk, nj).  In our research we used the standard function f(x), “sigmoid”, defined as f(x)=1/(1+exp(-x)).  This function is suitable for categorical output and allows for using an efficient back-propagation algorithm7 for calculating the optimal values of weights, providing the best fit for learning set of data, and eventually the most accurate classification.

Process description:  We implemented the proposed algorithm for diagnosis of AMI. All the calculations were performed on PC with Pentium 3 Processor applying the authors’ unique Software Agent Maynet. First, using the automatic random extraction procedure, the initial data set (139 patients) was partitioned into two sets — training and testing.  This randomization also determined the size of these sets (96 and 43, respectively) since the program was instructed to assign approximately 70 % of data to the training set.

The main process consists of three successive steps: (1) clustering performed on training data set, (2) neural network’s training on clusters from previous step, and (3) classifier’s accuracy evaluation on testing data.

The classifier in this research will be the ANN, created on step 2, with output in the range [0,1], that provides binary result (1 – AMI, 0 – not AMI), using decision point 0.5.

In this demonstartion we used the data of two previous studies1,2 with three patients, potential outliers, removed (n = 139). The data contains three input variables, CK-MB, LD-1, LD-1/total LD, and one output variable, diagnoses, coded as 1 (for AMI) or 0 (non-AMI).

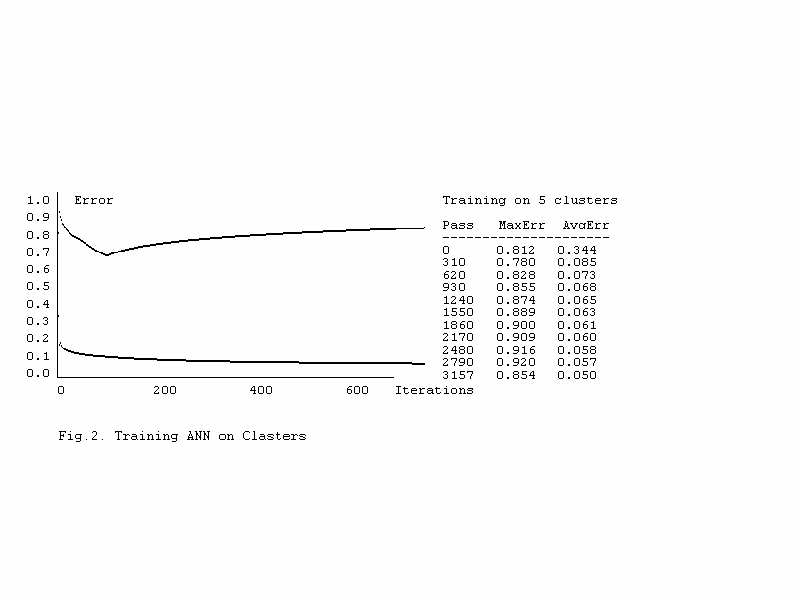
Results: The application of this software intelligent agent is first demonstrated here using the initial model. Figures 1-2 illustrate the history of training process. One function is the maximum (among training patterns) and lower function shows the average error. The latter defines duration of training process. Training terminates when the average error achieves 5%.

There was slow convergence of back-propagation algorithm applied to the training set of 96 patients. We needed 6800 iterations to achieve the sufficiently small (5%) average error.

Figure 1 shows the process of training on stage 2. It illustrates rapid convergence because we deal only with 9 patterns representing the 9 classes, formed on step 1.

Table 1 illustrates the effect of selection of maximum distance on the number of classes formed and on the production of errors. The number of classes increased with decreasing distance, but accuracy of classification does not decreased.

The rate of learning is inversely related to the number of classes. The use of the back-propagation to train on the entire data set without prior processing is slower than for the training on patterns.

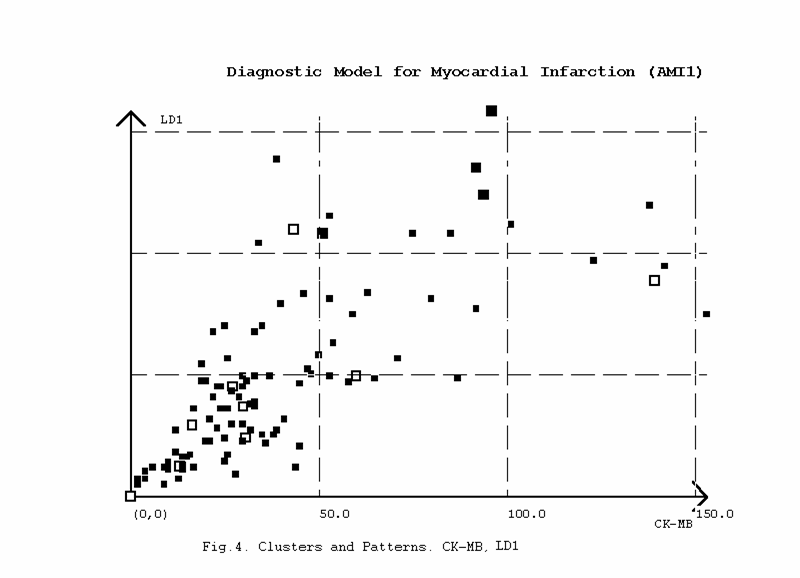
     Figures 2 is a two-dimensional projection of three-dimensional space of input variables CKMB and LD1 with small dots corresponding to the patterns and rectangular as cluster centroids (black – AMI, white – not AMI).

     We carried out a larger study using troponin I (instead of LD1) and CKMB for the diagnosis of myocardial infarction (MI).  The probabilities and odds-ratios for the TnI scaled into intervals near the entropy decision point are shown in Table 2 (N = 782).  The cross-table shows the frequencies for scaled TnI results versus the observed MI, the percent of values within MI, and the predicted probabilities and odds-ratios for MI within TnI intervals.  The optimum decision point is at or near 0.61 mg/L (the probability of MI at 0.46-0.6 mg/L is 3% and the odds ratio is at 13, while the probability of MI at 0.61-0.75 mg/L is 26% at an odds ratio of 174) by regressing the scaled values.

     The RBC, MCV criteria used were applied to a series of 40 patients different than that used in deriving the cutoffs.  A latent class cluster analysis is shown in Table 3.  MayNet is carried out on all 3 data sets for MI, CHF, and for beta thalassemia for comparison and will be shown.

Discussion:  CKMB has been heavily used for a long time to determine heart attacks. It is used in conjunction with a troponin test and the EKG to identify MI but, it isn’t as sensitive as is needed. A joint committee of the AmericanCollege of Cardiology and European Society of Cardiology (ACC/ESC) has established the criteria for acute, recent or evolving AMI predicated on a typical increase in troponin in the clinical setting of myocardial ischemia (1), which includes the 99th percentile of a healthy normal population. The improper selection of a troponin decision value is, however, likely to increase over use of hospital resources.  A study by Zarich8 showed that using an MI cutoff concentration for TnT from a non-acute coronary syndrome (ACS) reference improves risk stratification, but fails to detect a positive TnT in 11.7% of subjects with an ACS syndrome8. The specificity of the test increased from 88.4% to 96.7% with corresponding negative predictive values of 99.7% and 96.2%. Lin et al.9 recently reported that the use of low reference cutoffs suggested by the new guidelines results in markedly increased TnI-positive cases overall. Associated with a positive TnI and a negative CKMB, these cases are most likely false positive for MI. Maynet relieves this and the following problem effectively.

Monitoring BNP levels is a new and highly efficient way of diagnosing CHF as well as excluding non-cardiac causes of shortness of breath. Listening to breath sounds is only accurate when the disease is advanced to the stage in which the pumping function of the heart is impaired. The pumping of the heart is impaired when the circulation pressure increases above the osmotic pressure of the blood proteins that keep fluid in the circulation, causing fluid to pass into the lung’s airspaces.  Our studies combine the BNP with the EKG measurement of QRS duration to predict whether a patient has a high or low ejection fraction, a measure to stage the severity of CHF.

We also had to integrate the information from the hemogram (RBC, MCV) with the hemoglobin A2 quantitation (BioRad Variant II) for the diagnosis of beta thalassemia.  We chose an approach to the data that requires no assumption about the distribution of test values or the variances.   Our detailed analyses validates an approach to thalassemia screening that has been widely used, the Mentzer index10, and in addition uses critical decision values for the tests that are used in the Mentzer index. We also showed that Hgb S has an effect on both Hgb A2 and Hgb F.  This study is adequately powered to assess the usefulness of the Hgb A2 criteria but not adequately powered to assess thalassemias with elevated Hgb F.

References:

1.  Adan J, Bernstein LH, Babb J. Lactate dehydrogenase isoenzyme-1/total ratio: accurate for determining the existence of myocardial infarction. Clin Chem 1986;32:624-8.

2. Rudolph RA, Bernstein LH, Babb J. Information induction for predicting acute myocardial infarction.  Clin Chem 1988;34:2031- 2038.

3. Magidson J. “Maximum Likelihood Assessment of Clinical Trials Based on an Ordered Categorical Response.” Drug Information Journal, Maple Glen, PA: Drug Information Association 1996;309[1]: 143-170.

4. Magidson J and Vermoent J.  Latent Class Cluster Analysis. in J. A. Hagenaars and A. L. McCutcheon (eds.), Applied Latent Class Analysis. Cambridge: CambridgeUniversity Press, 2002, pp. 89-106.

5. Mkhitarian VS, Mayzlin IE, Troshin LI, Borisenko LV. Classification of the base objects upon integral parameters of the attached network. Applied Mathematics and Computers.  Moscow, USSR: Statistika, 1976: 118-24.

6.Mayzlin IE, Mkhitarian VS. Determining the optimal bounds for objects of different classes. In: Dubrow AM, ed. Computational Mathematics and Applications. MoscowUSSR: Economics and Statistics Institute. 1976: 102-105.

7. RumelhartDE, Hinton GE, Williams RJ. Learning internal representations by error propagation. In:

RumelhartDE, Mc Clelland JL, eds. Parallel distributed processing.   Cambridge, Mass: MIT Press, 1986; 1: 318-62.

8. Zarich SW, Bradley K, Mayall ID, Bernstein, LH. Minor Elevations in Troponin T Values Enhance Risk Assessment in Emergency Department Patients with Suspected Myocardial Ischemia: Analysis of Novel Troponin T Cut-off Values.  Clin Chim Acta 2004 (in press).

9. Lin JC, Apple FS, Murakami MM, Luepker RV.  Rates of positive cardiac troponin I and creatine kinase MB mass among patients hospitalized for suspected acute coronary syndromes.  Clin Chem 2004;50:333-338.

10.Makris PE. Utilization of a new index to distinguish heterozygous thalassemic syndromes: comparison of its specificity to five other discriminants.Blood Cells. 1989;15(3):497-506.

Acknowledgements:   Jerard Kneifati-Hayek and Madeleine Schlefer, Midwood High School, Brooklyn, and Salman Haq, Cardiology Fellow, Methodist Hospital.

Table 1. Effect of selection of maximum distance on the number of classes formed and on the accuracy of recognition by ANN

ClusteringDistanceFactor F(D = F * R)  Number ofClasses  Number of Nodes inThe HiddenLayers  Number ofMisrecognizedPatterns inThe TestingSet of 43 Percent ofMisrecognized   
  10.90.80.7  2414135  1, 02, 03, 01, 02, 03, 0

3, 2

3, 2

121121

1

1

2.34.62.32.34.62.3

2.3

2.3

Figure 1.

Figure 2.

Table 2.  Frequency cross-table, probabilities and odds-ratios for scaled TnI versus expected diagnosis

Range Not MI MI N Pct in MI Prob by TnI Odds Ratio
< 0.45 655 2 657 2 0 1
0.46-0.6 7 0 7 0 0.03 13
0.61-0.75 4 0 4 0. 0.26 175
0.76-0.9 13 59 72 57.3 0.82 2307
> 0.9 0 42 42 40.8 0.98 30482
679 103 782 100


Read Full Post »


Reporter: Aviva Lev-Ari, PhD, RN

July 20, 2012

The 2012 Intelligent Systems for Molecular Biology conference held this week in Long Beach, Calif., marked the 20th anniversary of what is considered the largest meeting in computational biology.

As part of the festivities at this year’s meeting, two founding members of the International Society for Computational Biology, which plans and manages ISMB, presented an anniversary keynote.

Lawrence Hunter, who directs the computational bioscience program and the center for computational pharmacology at the University of Colorado School of Medicine, and Richard Lathrop, a professor in the department of computer science at the University of California, Irvine, delivered the keynote, which traced the early days of the meeting, with its initial focus on artificial intelligence, to its current focus on computational biology.

BioInform caught up with Hunter, who was the first president of ISCB, after his talk to discuss the history of the conference and possible future directions for the community. What follows is an edited version of the conversation.

It’s been 20 years since the first ISMB. How has the meeting evolved over the years?

ISMB has gone through several stages. In the very beginning it was almost entirely computer scientists and there were really clear themes that emerged from the meeting. [For example, at] the third meeting … half of the papers were about hidden Markov models. As the field has grown and changed, there is a much less clear division between the computer scientist and the biologist. We’ve really become computational biologists and so the level of biological sophistication has gone up and the field has diversified so that there is really rarely a clear theme anymore; it’s multifaceted and diverse.

Another thing that’s changed is the orientation toward medicine. In the early days of the field, we were grappling with much more basic science problems and while there is still a lot of that, there is a much higher proportion of work that’s translational or clinical. Whether it’s drug repositioning, where I think there is real potential to change the pharmaceutical industry based on the kind of informatics work that’s done here, to an increase in the use of clinical data in the techniques that are being proposed here — whether it’s text mining or patient records or formalin-fixed, paraffin-embedded samples and the challenges in doing transcriptomics in those kinds of clinical samples — we are much more tightly connected to human health than we were 20 years ago.

Is that a good thing? Does the focus on health mean that bioinformatics tool development in other areas is being neglected?

I think it’s a good thing. Everybody wants to be relevant. Scientists don’t want to do things in the abstract; they want to do things that make a difference in people’s lives. One of the biggest ways to make a difference in people’s lives with bioinformatics is through medicine or pharmacology. There has never been a big contingent of folks working in agriculture but there are always a few … so far, the agricultural impacts have been smaller than the medical ones. And there are plenty of people doing basic science who are trying to understand how life works, [and] not so much trying to affect disease. I think there is a good balance and it will shift around from time to time. It would be great if there were more agricultural kinds of applications … [but] there is much more funding for things with medical applications than there are for ones with ag applications.

Following up on comments about funding, do you find that researchers have gotten better at including a budget for informatics in their grant proposals?

I think reviewers demand pretty sophisticated informatics in a lot of grants. For NIH grants, especially for the bigger, more prestigious ones — R01s or program projects or the [Clinical and Translational Science Awards] — all of those require a pretty good degree of informatics sophistication, I think, in order to do well. Looking over the last 20 years, one thing that has improved, although it could still use work, is study sections at [the National Institutes of Health], the review panels, becoming more sophisticated about computation. For a long time there was no standing study section at NIH that was specifically computational. Now there are two. There is also increasing sophistication on other study sections, so if you sit on an NIGMS panel, for example, there are going to be at least a couple of people who are pretty sophisticated about the informatics looking at those applications.

For the really large center proposals, and I am thinking now about the CTSA awards, there was such an emphasis on the informatics in the program announcement from the NIH that it changed institutions. Medical schools started adding divisions or departments of biomedical informatics in response to NIH requirements that the grant proposals be more sophisticated.

You mentioned earlier that ISMB has evolved since it first launched. Do you think that the meeting and ISCB in general have stayed true to their initial mandates?

It’s evolved. When we first put it together, we were thinking about artificial intelligence and robotics in molecular biology. It was much narrower. There were already conferences on, say, biological databases and we didn’t think that it was our topic. There was also the RECOMB [Conference on Research in Computational Molecular Biology] community, the algorithms community, and we separated from them too so that original vision was much narrower. ISMB has turned into a much more inclusive conference and ISCB a more inclusive society.

ISCB and ISMB both start with ‘IS’ but the ‘IS’es are different. ISMB, the conference, was about intelligent systems, that is, about AI. ISCB is the International Society for Computational Biology; it’s a much broader mandate. It includes databases and algorithms and visualization and all kinds of things that aren’t intelligent systems. That’s been a big change from the initial vision and, I think, ultimately a good one. I think the boundary lines were not productive and while I am still very interested in the artificial intelligence question, the blending of people working from different areas of computer science all sort of pulling towards solving problems motivated by biology has really been productive and so I am glad we’ve changed a bit from the initial vision.

Is there still room for AI?

The AI stuff has never gone away. There is tons of machine learning here, text mining, ontology, and knowledge representation here. One of the reasons I think this conference and this field and the original AI in molecular idea has been so successful is the technology works. It works in molecular biology almost better than it works in any other application area. So there is no shortage of intelligent systems at ISMB. It’s just more than that now.

Are there any computational issues that the community was dealing with 20 years ago that are still being dealt with today?

We go in cycles. If you go back to the very early ISMBs there was a lot of sequence analysis and alignment questions and relatively little dynamics. Fast forward 10 years, everything was microarrays and time series and concentration levels and sequence analysis was a boring solved problem. Fast forward 10 more years and we’ve gone back in a circle. Right now, microarrays are kind of a boring solved problem and sequence analysis is really interesting and hot again. The technology changes and so the problems change, nothing ever seems to stay solved. Either our ability to peer into the biology lets us know that we were naïve or over simplistic about something that we now need to go back and look at much more carefully. For example, the assumption that only protein-coding bits of the genome were transcribed underlay a lot of science for a long time. Now it turns out that a huge portion of the genome is transcribed and there is a lot of action going on in RNA editing and mircoRNAs and long non-coding RNAs are starting to look interesting again. As you look deeper, more interesting problems come up that you didn’t notice when you were making assumptions about how biology works.

It’s rare in our field that we prove some technique optimal. The best we can do is prove that my way of doing it is better than X,Y, and Z and so it’s a step forward but that always leaves the possibility that there is yet a still better way to do it and we still see people who are working on topics that have been well studied for a long time [such as] splice site identification, transcription start sites, structure prediction, function prediction problems that have been studied for a long time, yet new methods that are generally better come out. Even after working on it for 20 years, there is still the potential to do better.

Looking ahead 20 years from now, what do you see as the future of bioinformatics?

Let me take [a prediction] from my keynote. I think that we will see computer programs as increasingly independent and individuated intellectual partners. Right now, everybody using, say, Cufflinks uses the same version and it does the same thing every time. 20 years from now, I would expect that my computer program would be so customized to my way of thinking and what’s going on in my lab that the same computer program would do something different in somebody else’s lab. That doesn’t mean it’s not reproducible, we’ll know what it did and why, but that rather than having tens of thousands of copies that do the same thing, it’ll be more like having a computational member of the lab. It will know what we are after and what our interests are and what my collaborators want and who my competitors are and be much more individualized. I am not going to say that we’ll have a program that everyone thinks is a mind 20 years from now … but I think along the path to developing genuine artificial intelligence, all minds are unique, everybody is different, and that’s going to be increasingly true to programs too.

http://www.genomeweb.com//node/1108711?hq_e=el&hq_m=1314078&hq_l=7&hq_v=e1df6f3681

Uduak Grace Thomas is the editor of GenomeWeb’s BioInform. She covers bioinformatics, computational biology, and life science informatics. E-mail her here or follow her GenomeWeb Twitter account at @BioInformGW.


Read Full Post »

« Newer Posts