Clinical Decision Support Systems for Management Decision Making of Cardiovascular Diseases
Author, and Content Consultant to e-SERIES A: Cardiovascular Diseases: Justin Pearlman, MD, PhD, FACC
and
Curator: Aviva Lev-Ari, PhD, RN

WordCloud Image Produced by Adam Tubman
Clinical Decision Support Systems (CDSS)
Clinical decision support system (CDSS) is an interactive decision support system (DSS). It generally relies on computer software designed to assist physicians and other health professionals with decision-making tasks, such as when to apply a particular diagnosis, further specific tests or treatments. A functional definition proposed by Robert Hayward of the Centre for Health Evidence defines CDSS as follows: “Clinical Decision Support systems link health observations with health knowledge to influence health choices by clinicians for improved health care”. CDSS is a major topic in artificial intelligence in medicine.
Vinod Khosla of A Khosla Ventures investment, in a Fortune Magazine article, “Technology will replace 80% of what doctors do”, on December 4, 2012, wrote about CDSS as a harbinger of science in medicine.
Computer-assisted decision support is in its infancy, but we have already begun to see meaningful impact on healthcare. Meaningful use of computer systems is now rewarded under the Affordable Care Act. Studies have demonstrated the ability of computerized clinical decision support systems to lower diagnostic errors of omission significantly, by directly countering cognitive bias. Isabel is a differential diagnosis tool and, according to a Stony Book study, matched the diagnoses of experienced clinicians in 74% of complex cases. The system improved to a 95% match after a more rigorous entry of patient data. The IBM supercomputer, Watson, after beating all humans at the intelligence-based task of playing Jeopardy, is now turning its attention to medical diagnosis. It can process natural language questions and is fast at parsing high volumes of medical information, reading and understanding 200 million pages of text in 3 seconds.
Examples of CDSS
VIEW VIDEO
Introduction
Justin D. Pearlman, MD, PhD
A Decision Support System consists of one or more tools to help achieve good decisions. For example, decisions that can benefit from DSS include whether or not to undergo surgery, whether or not to undergo a stress test first, whether or not to have an annual mammogram starting at a particular age, or a computed tomography (CT) to screen for lung cancer, whether or not to utilize intensive care support such as a ventilator, chest shocks, chest compressions, forced feeding, strong antibiotics and so on versus care directed to comfort measures only without regard to longevity.
Any DSS can be viewed like a digestive tract, chewing on input, and producing output, and like the digestive tract, the output may only be valuable to a farmer. A well designed DSS is efficient in the input, timely in its processing and useful in the output. Mathematically, a DSS is a model with input parameters and an output variable or set of variables that can be used to determine an action. The input can be categorical (alive, dead), semi-quantitative (cold-warm-hot), or quantitative (temperature, systolic blood pressure, heart rate, oxygen saturation). The output can be binary (yes-no) or it can express probabilities or confidence intervals.
The process of defining specifications for a function and then deriving a useful function is called mathematical modeling. We will derive the function for “average” as an example. By way of specifications, we want to take a list of numbers as input, and come out with a single number that represents the middle of the pack or “central tendency.” The order of the list should not matter, and if we change scales, the output should scale the same way. For example, if we use centimeters instead of inches, and we apply 2.54 centimeters to an inch, then the output should increase by the multiplier 2.54. If the list of numbers are all the same then the output should be the consistent value. Representing these specifications symbolically:
1. order doesn’t matter: f(a,b) = f(b,a), where “a” and “b” are input values, “f” is the function.
2. multipliers pass through (linearity): f(ka,kb)=k f(a,b), where k is a scalar e.g. 2.54 cm/inch.
3. identity: f(a,a,a,…) = a
Properties 1 and 2 lead us to consider linear functions consisting of sums and multipliers: f(a,b,c)=Aa+Bb+Cc …, where the capital letters are multipliers by “constants” – numbers that are independent of the list values a,b,c, and since the order should not matter, we simplify to f(a,b,c)=K (a+b+c+…) because a constant multiplier K makes order not matter. Property 3 forces us to pick K = 1/N where N is the length of the list. These properties lead us to the mathematical solution: average = sum of list of numbers divided by the length of the list.
A coin flip is a simple DSS: heads I do it, tails I don’t. The challenge of a good DSS is to perform better than random choice and also perform better (more accurately, more efficiently, more reliably, more timely and/or under more adverse conditions) than unassisted human decision making.
Therefore, I propose the following guiding principles for DSS design: choose inputs wisely (accessible, timely, efficient, relevant), determine to what you want output to be sensitive AND to what you want output to be insensitive, and be very clear about your measures of success.
For example, consider designing a DSS to determine whether a patient should receive the full range of support capabilities of an intensive care unit (ICU), or not. Politicians have cited the large bump in the cost of the last year of life as an opportunity to reduce costs of healthcare, and now pay primary care doctors to encourage patients to establish advanced directives not to use ICU services. From the DSS standpoint, the reasoning is flawed because the decision not to use ICU services should be sensitive to benefit as well as cost, commonly called cost-benefit analysis. If we measure success of ICU services by the benefit of quality life net gain (QLNG, “quailing”), measured in quality life-years (QuaLYs) and achieve 50% success with that, then the cost per QuaLY measures the cost-benefit of ICU services. In various cost-benefit decisions, the US Congress has decided to proceed if the cost is under $20-$100,000/QuaLY. If ICU services are achieving such a cost-benefit, then it is not logical to summarily block such services in advance. Rather, the ways to reduce those costs include improving the cost efficiency of ICU care, and improving the decision-making of who will benefit.
An example of a DSS is the prediction of plane failure from a thousand measurements of strain and function of various parts of an airplane. The desired output is probability of failure to complete the next flight safely. Cost-Benefit analysis then establishes what threshold or operating point merits grounding the plane for further inspection and preventative maintenance repairs. If a DSS reports probability of failure, then the decision (to ground the plane) needs to establish a threshold at which a certain probability triggers the decision to ground the plane.
The notion of an operating point brings up another important concept in decision support. At first blush, one might think the success of a DSS is determined by its ability to correctly identify a predicted outcome, such as futility of ICU care (when will the end result be no quality life net gain). The flaw in that measure of success is that it depends on prevalence in the study group. As an extreme example, if you study a group of patients with fatal gunshot wounds to the head, none will benefit and the DSS requirement is trivial and any DSS that says no for that group has performed well. At the other extreme, if all patients become healthy, the DSS requirement is also trivial, just say yes. Therefore the proper assessment of a DSS should pay attention to the prevalence and the operating point.
The impact of prevalence and operating point on decision-making is addressed by receiver-operator curves. Consider looking at the blood concentration of Troponin-I (TnI) as the sole determinant to decide who is having a heart attack. If one plots a graph with horizontal axis troponin level and vertical axis ultimate proof of heart attack, the percentage of hits will generally be higher for higher values of TnI. To create such a graph, we compute a “truth table” which reports whether the test was above or below a decision threshold operating point, and whether or not the disease (heart attack) was in fact present:
TRUTH TABLE
| Disease | Not Disease | |
| Test Positive |
TP |
FP |
| Test Negative |
FN |
TN |
|
Total |
TP+FN |
FP+TN |
The sensitivity to the disease is the true positive rate (TPR), the percentage of all disease cases that are ranked by the decision support as positive: TPR = TP/(TP+FN). 100% sensitivity can be achieved trivially by lowering the threshold for a positive test to zero, at a cost. While sensitivity is necessary for success it is not sufficient. In addition to wanting sensitivity to disease, we want to avoid labeling non-disease as disease. That is often measured by specificity, the true negative rate (TNR), the percentage of those without disease who are correctly identified as not having disease: TNR = TN/(FP+TN). I propose also we define the complement to specificity, the anti-sensitivity, as the false positive rate (FPR), FPR = FP/(FP+TN) = 1 – TNR. Anti-sensitivity is a penalty cost of lowering the diagnostic threshold to boost sensitivity, as the concomitant rise in anti-sensitivity means a growing number of non-disease subjects are labeled as having disease. We want high sensitivity to true disease without high anti-sensitivity to false disease, and we want to be insensitive to common distractors. In these formulas, note that false negatives (FN) are True for disease, and false positives (FP) are False for disease, so the denominators add FN to TP for total True disease, and add FP to TN for total False for disease.
The graph in figure 1 justifies the definition of anti-sensitivity. It is an ROC or “Receiver-Operator Curve” which is a plot of sensitivity versus anti-sensitivity for different diagnostic thresholds of a test (operating points). Note, higher sensitivity comes at the cost of higher anti-sensitivity. Where to operate (what threshold to use for diagnosis) can be selected according to cost-benefit analysis of sensitivity versus anti-sensitivity (and specificity).
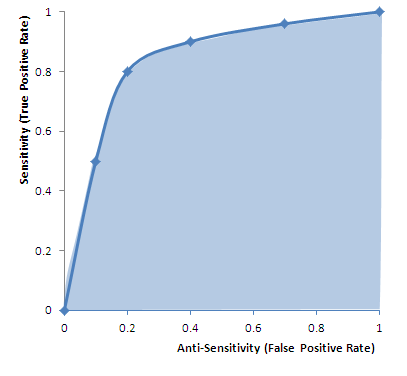 |
| FIgure 1 ROC (Receiver-Operator Curve): Graph of sensitivity (true positive rate) versus anti-sensitivity (false positive rate) computed by changing the operating point (threshold for declaring a test numeric value positive for disease). High area under the curve (AUC) is favorable because it means less anti-sensitivity for high sensitivity (upper left corner of shaded area more to the left, and higher). The dots on the curve are operating points. An inclusive operating point (high on the curve, high sensitivity) is used for screening tests, whereas an exclusive operating point (low on the curve, low anti-sensitivity) is used for definitive diagnosis. |
Cost benefit analysis generally is based on a semi-lattice, or upside-down branching tree, which represents all choices and outcomes. It is important to include all branches down to final outcomes. For example, if the test is a mammogram to screen for breast cancer, the cost is not just the cost of the test, and the benefit “early diagnosis.” The cost-benefit calculation forces us to put a numerical value on the impact, such as a financial cost to an avoidable death, or we can get a numerical result in terms of quality life years expected. The cost, however, is not just the cost of the mammogram, but also of downstream events such as the cost of the needle biopsies for the suspicious “positives” and so on.
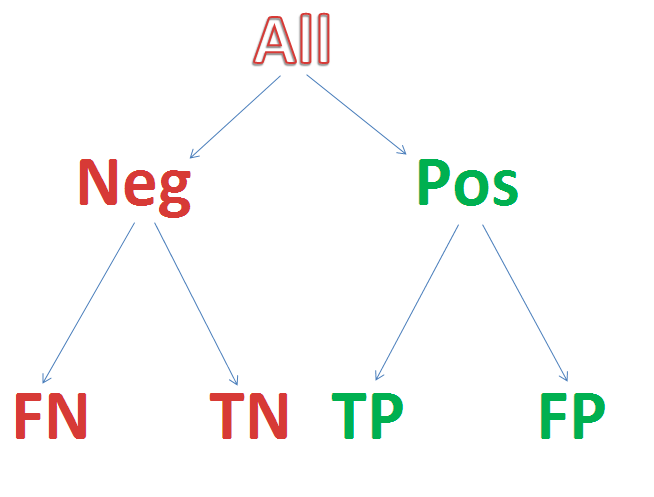 Figure 2 Semi-lattice Decision Tree: Starting from all patients, create a branch point for your test result, and add further branch points for any subsequent step-wise outcomes until you reach the “bottom line.” Assign a value to each, resulting in a numerical net cost and net benefit. If tests invoke risks (for example, needle biopsy of lung can collapse a lung and require hospitalization for a chest tube) then insert branch points for whether the complication occurs or not, as the treatment of a complication counts as part of the cost. The intermediary nodes can have probability of occurrence as their numeric factor, and the bottom line can apply the net probability of the path leading to a value as a multiplier to the dollar value (a 10% chance of costing $10,000 counts as an expectation cost of 0.1 x 10,000 = $1,000).
A third area of discussion is the statistical power of a DSS – how reliable is it in the application that you care about? Commonly DSS design is contrary to common statistical applications which address significance of a deviation in a small number of variables that have been measured many times in a large population. Instead, DSS often uses many variables to fully describe or characterize the status of a small population. For example, thousands of different measurements may be performed on a few dozen airplanes, aiming to predict when the plane should be grounded for repairs. A similar inversion of numbers – numerous variables, small number of cases – is common in genomics studies.
The success of a DDS is measured by its predictive value compared to outcomes or other measures of success. Thus measures of success include positive predictive value, negative predictive value, and confidence. A major problem with DDS is the inversion of the usually desired ratio of repetitions to measurement variables. When you get a single medical lab test, you have a single measurement value such as potassium level and a large number of normal subjects for comparison. If we knew the mean μ and standard deviation σ that describes the distribution of normal values in the population at large, then we could compute the confidence in the decision to call our observed value abnormal based on the normal distribution: , 
A value may be deemed distinctive based on a 95% confidence interval if it falls outside of the norm, say by more than twice the standard deviation σ, thereby establishing that it is unlikely to be random as the distance from the mean excludes 95% of the normal distribution.
The determination of confidence in an observed set of results stems from maximized likelihood estimates. Earlier in this article we described how to derive the the mean, or center, of a set of measurements. A similar analysis can derive the standard deviation (square root of variance) as a measure of spread around the mean, as well as other descriptive statistics based on sample values. These formulas describe the distribution of sample values about the mean. The calculation is based on a simple inversion. If we knew the mean and variance of a population of values for a measurement, we could calculate the likelihood of each new measurement falling a particular distance from the mean, and we could calculate the combined likelihood for a set of observed values. Maximized Likelihood Estimation (MLE) simply inverts the method of calculation. Instead of treating the mean and variance as known, we can treat the sample observations as the known data, to characterize a distribution for the observed data samples from an estimate of the spread about an unknown mean from a set of N normal samples xi (one can apply calculus to compute the formulas below for the unknown mean and unknown variance, based simply on computing how to maximize the joint likelihood of the observations xi from the frequency distribution above, in order t0 derive the following formulas):
![]()
The frequency distribution (a function of mean and spread) reports the frequency of observing xi if it is drawn from a population with the specified mean μ and standard deviation σ . We can invert that by treating the observations, xi , as known and the mean μ and standard deviation σ unknown, then calculate the values μ and σ that maximize the likelihood of our sample set as coming from the dynamically described population.
In DSS there is typically an inversion of the usually requisite large number of samples (small versus large) and number of variables (large versus small. This inversion has major consequences on data confidence. If you measure just 14 independent variables versus one variable, each at 95% confidence, the net confidence drops exponentially to less than 50%: 0.9514=49%. In the airplane grounding screen tests, 1000 independent variables, at 95% confidence each, yields a net confidence of only 5 x 10-23 which is 10 sextillion times less than 50% confidence. This same problem arises in genomics research, in which we have a large array of gene product measurements on a small number of patients. Standard statistical tools are problematic at high variable counts. One can turn to qualitative grouping tools such as exploratory factor analysis, or recover statistical robustness with HykGene, a combined cluster and ranking method devised by the author to improve dramatically the ability to identify distinctions with confidence when the number of variables is high.
Evolution of DSS
Aviva Lev-Ari, PhD, RN
The examples provided above refer to sets of binary models, one family of DSS. Another type of DSS is multivariate in nature, a corollary of multivariate scenarios constitute alternative choice options. Last decade development in the DSS field involved the design of Recommendation Engines given manifested preference functions that involved simultaneous trade-off functions against cost function. Game theoretical context is embedded into Recommendation Engines. The output mentioned above, is in fact an array of options with probabilities of saving reward assigned by the Recommendation Engine.
Underlining Computation Engines
Methodological Basis of Clinical DSS
There are many different methodologies that can be used by a CDSS in order to provide support to the health care professional.[7]
The basic components of a CDSS include a dynamic (medical) knowledge base and an inference mechanism (usually a set of rules derived from the experts and evidence-based medicine) and implemented through medical logic modules based on a language such as Arden syntax. It could be based on Expert systems or artificial neural networks or both (connectionist expert systems).
Bayesian Network
The Bayesian network is a knowledge-based graphical representation that shows a set of variables and their probabilistic relationships between diseases and symptoms. They are based on conditional probabilities, the probability of an event given the occurrence of another event, such as the interpretation of diagnostic tests. Bayes’ rule helps us compute the probability of an event with the help of some more readily available information and it consistently processes options as new evidence is presented. In the context of CDSS, the Bayesian network can be used to compute the probabilities of the presence of the possible diseases given their symptoms.
Some of the advantages of Bayesian Network include the knowledge and conclusions of experts in the form of probabilities, assistance in decision making as new information is available and are based on unbiased probabilities that are applicable to many models.
Some of the disadvantages of Bayesian Network include the difficulty to get the probability knowledge for possible diagnosis and not being practical for large complex systems given multiple symptoms. The Bayesian calculations on multiple simultaneous symptoms could be overwhelming for users.
Example of a Bayesian network in the CDSS context is the Iliad system which makes use of Bayesian reasoning to calculate posterior probabilities of possible diagnoses depending on the symptoms provided. The system now covers about 1500 diagnoses based on thousands of findings.
Another example is the DXplain system that uses a modified form of the Bayesian logic. This CDSS produces a list of ranked diagnoses associated with the symptoms.
A third example is SimulConsult, which began in the area of neurogenetics. By the end of 2010 it covered ~2,600 diseases in neurology and genetics, or roughly 25% of known diagnoses. It addresses the core issue of Bayesian systems, that of a scalable way to input data and calculate probabilities, by focusing specialty by specialty and achieving completeness. Such completeness allows the system to calculate the relative probabilities, rather than the person inputting the data. Using the peer-reviewed medical literature as its source, and applying two levels of peer-review to the data entries, SimulConsult can add a disease with less than a total of four hours of clinician time. It is widely used by pediatric neurologists today in the US and in 85 countries around the world.
Neural Network
Artificial Neural Networks (ANN) is a nonknowledge-based adaptive CDSS that uses a form of artificial intelligence, also known as machine learning, that allows the systems to learn from past experiences / examples and recognizes patterns in clinical information. It consists of nodes called neuron and weighted connections that transmit signals between the neurons in a forward or looped fashion. An ANN consists of 3 main layers: Input (data receiver or findings), Output (communicates results or possible diseases) and Hidden (processes data). The system becomes more efficient with known results for large amounts of data.
The advantages of ANN include the elimination of needing to program the systems and providing input from experts. The ANN CDSS can process incomplete data by making educated guesses about missing data and improves with every use due to its adaptive system learning. Additionally, ANN systems do not require large databases to store outcome data with its associated probabilities. Some of the disadvantages are that the training process may be time consuming leading users to not make use of the systems effectively. The ANN systems derive their own formulas for weighting and combining data based on the statistical recognition patterns over time which may be difficult to interpret and doubt the system’s reliability.
Examples include the diagnosis of appendicitis, back pain, myocardial infarction, psychiatric emergencies and skin disorders. The ANN’s diagnostic predictions of pulmonary embolisms were in some cases even better than physician’s predictions. Additionally, ANN based applications have been useful in the analysis of ECG (A.K.A. EKG) waveforms.
Genetic Algorithms
A Genetic Algorithm (GA) is a nonknowledge-based method developed in the 1940s at the Massachusetts Institute of Technology based on Darwin’s evolutionary theories that dealt with the survival of the fittest. These algorithms rearrange to form different re-combinations that are better than the previous solutions. Similar to neural networks, the genetic algorithms derive their information from patient data.
An advantage of genetic algorithms is these systems go through an iterative process to produce an optimal solution. The fitness function determines the good solutions and the solutions that can be eliminated. A disadvantage is the lack of transparency in the reasoning involved for the decision support systems making it undesirable for physicians. The main challenge in using genetic algorithms is in defining the fitness criteria. In order to use a genetic algorithm, there must be many components such as multiple drugs, symptoms, treatment therapy and so on available in order to solve a problem. Genetic algorithms have proved to be useful in the diagnosis of female urinary incontinence.
Rule-Based System
A rule-based expert system attempts to capture knowledge of domain experts into expressions that can be evaluated known as rules; an example rule might read, “If the patient has high blood pressure, he or she is at risk for a stroke.” Once enough of these rules have been compiled into a rule base, the current working knowledge will be evaluated against the rule base by chaining rules together until a conclusion is reached. Some of the advantages of a rule-based expert system are the fact that it makes it easy to store a large amount of information, and coming up with the rules will help to clarify the logic used in the decision-making process. However, it can be difficult for an expert to transfer their knowledge into distinct rules, and many rules can be required for a system to be effective.
Rule-based systems can aid physicians in many different areas, including diagnosis and treatment. An example of a rule-based expert system in the clinical setting is MYCIN. Developed at Stanford University by Edward Shortliffe in the 1970s, MYCIN was based on around 600 rules and was used to help identify the type of bacteria causing an infection. While useful, MYCIN can help to demonstrate the magnitude of these types of systems by comparing the size of the rule base (600) to the narrow scope of the problem space.
The Stanford AI group subsequently developed ONCOCIN, another rules-based expert system coded in Lisp in the early 1980s.[8] The system was intended to reduce the number of clinical trial protocol violations, and reduce the time required to make decisions about the timing and dosing of chemotherapy in late phase clinical trials. As with MYCIN, the domain of medical knowledge addressed by ONCOCIN was limited in scope and consisted of a series of eligibility criteria, laboratory values, and diagnostic testing and chemotherapy treatment protocols that could be translated into unambiguous rules. Oncocin was put into production in the Stanford Oncology Clinic.
Logical Condition
The methodology behind logical condition is fairly simplistic; given a variable and a bound, check to see if the variable is within or outside of the bounds and take action based on the result. An example statement might be “Is the patient’s heart rate less than 50 BPM?” It is possible to link multiple statements together to form more complex conditions. Technology such as a decision table can be used to provide an easy to analyze representation of these statements.
In the clinical setting, logical conditions are primarily used to provide alerts and reminders to individuals across the care domain. For example, an alert may warn an anesthesiologist that their patient’s heart rate is too low; a reminder could tell a nurse to isolate a patient based on their health condition; finally, another reminder could tell a doctor to make sure he discusses smoking cessation with his patient. Alerts and reminders have been shown to help increase physician compliance with many different guidelines; however, the risk exists that creating too many alerts and reminders could overwhelm doctors, nurses, and other staff and cause them to ignore the alerts altogether.
Causal Probabilistic Network
The primary basis behind the causal network methodology is cause and effect. In a clinical causal probabilistic network, nodes are used to represent items such as symptoms, patient states or disease categories. Connections between nodes indicate a cause and effect relationship. A system based on this logic will attempt to trace a path from symptom nodes all the way to disease classification nodes, using probability to determine which path is the best fit. Some of the advantages of this approach are the fact that it helps to model the progression of a disease over time and the interaction between diseases; however, it is not always the case that medical knowledge knows exactly what causes certain symptoms, and it can be difficult to choose what level of detail to build the model to.
The first clinical decision support system to use a causal probabilistic network was CASNET, used to assist in the diagnosis of glaucoma. CASNET featured a hierarchical representation of knowledge, splitting all of its nodes into one of three separate tiers: symptoms, states and diseases.
- ^ a b c d e “Decision support systems .” 26 July 2005. 17 Feb. 2009 <http://www.openclinical.org/dss.html>.
- 2^ a b c d e f g Berner, Eta S., ed. Clinical Decision Support Systems. New York, NY: Springer, 2007.
- 3^ Khosla, Vinod (December 4, 2012). “Technology will replace 80% of what doctors do”. Retrieved April 25, 2013.
- ^ Garg AX, Adhikari NK, McDonald H, Rosas-Arellano MP, Devereaux PJ, Beyene J et al. (2005). “Effects of computerized clinical decision support systems on practitioner performance and patient outcomes: a systematic review.”. JAMA 293 (10): 1223–38. doi:10.1001/jama.293.10.1223. PMID 15755945.
- ^ Kensaku Kawamoto, Caitlin A Houlihan, E Andrew Balas, David F Lobach. (2005). “Improving clinical practice using clinical decision support systems: a systematic review of trials to identify features critical to success.”. BMJ 330 (7494): 765. doi:10.1136/bmj.38398.500764.8F. PMC 555881. PMID 15767266.
- ^ Gluud C, Nikolova D (2007). “Likely country of origin in publications on randomised controlled trials and controlled clinical trials during the last 60 years.”. Trials 8: 7. doi:10.1186/1745-6215-8-7. PMC 1808475. PMID 17326823.
- ^ Wagholikar, K. “Modeling Paradigms for Medical Diagnostic Decision Support: A Survey and Future Directions”. Journal of Medical Systems. Retrieved 2012.
- ^ ONCOCIN: An expert system for oncology protocol management E. H. Shortliffe, A. C. Scott, M. B. Bischoff, A. B. Campbell, W. V. Melle, C. D. Jacobs Seventh International Joint Conference on Artificial Intelligence, Vancouver, B.C.. Published in 1981
SOURCE for Computation Engines Section and REFERENCES:
http://en.wikipedia.org/wiki/Clinical_decision_support_system
Cardiovascular Diseases: Decision Support Systems (DSS) for Disease Management Decision Making – DSS analyzes information from hospital cardiovascular patients in real time and compares it with a database of thousands of previous cases to predict the most likely outcome.
Can aviation technology reduce heart surgery complications?
 British researchers are working to adapt technology from the aviation industry to help prevent complications among heart patients after surgery. Up to 1,000 sensors aboard aircraft help airlines determine when a plane requires maintenance, reports The Engineer, serving as a model for the British risk-prediction system.
The system analyzes information from hospital cardiovascular patients in real time and compares it with a database of thousands of previous cases to predict the most likely outcome.
“There are vast amounts of clinical data currently collected which is not analyzed in any meaningful way. This tool has the potential to identify subtle early signs of complications from real-time data,” Stuart Grant, a research fellow in surgery at University Hospital of South Manchester, says in a hospital statement. Grant is part of the Academic Surgery Unit working with Lancaster University on the project, which is still its early stages.
The software predicts the patient’s condition over a 24-hour period using four metrics: systolic blood pressure, heart rate, respiration rate and peripheral oxygen saturation, explains EE Times.
As a comparison tool, the researchers obtained a database of 30,000 patient records from the Massachusetts Institute of Technology and combined it with a smaller, more specialized database from Manchester.
In six months of testing, its accuracy is about 75 percent, The Engineer reports. More data and an improved algorithm could boost that rate to 85 percent, the researchers believe. Making the software web-based would allow physicians to access the data anywhere, even on tablets or phones, and could enable remote consultation with specialists.
In their next step, the researchers are applying for more funding and for ethical clearance for a large-scale trial.
U.S. researchers are working on a similar crystal ball, but one covering an array of conditions. Researchers from the University of Washington, MIT and Columbia University are using a statistical model that can predict future ailments based on a patient’s history–and that of thousands of others.
And the U.S. Department of Health & Human Services is using mathematical modeling to analyze effects of specific healthcare interventions.
Predictive modeling also holds promise to make clinical research easier by using algorithms examine multiple scenarios based on different kinds of patient populations, specified health conditions and various treatment regimens
To learn more:
– here’s the Engineer article
– check out the hospital report
– read the EE Times article
Related Articles:
Algorithm looks to past to predict future health conditions
HHS moves to mathematical modeling for research, intervention evaluation
Decision support, predictive modeling may speed clinical research
Can aviation technology reduce heart surgery complications? – FierceHealthIT http://www.fiercehealthit.com/story/can-aviation-technology-reduce-heart-surgery-complications/2012-08-13#ixzz2SITHc61J
Medical Decision Making Tools: Overview of DSS available to date
http://www.openclinical.org/dss.html
Clinical Decision Support Systems – used for Cardiovascular Medical Decisions
Stud Health Technol Inform. 2010;160(Pt 2):846-50.
AALIM: a cardiac clinical decision support system powered by advanced multi-modal analytics.
Amir A, Beymer D, Grace J, Greenspan H, Gruhl D, Hobbs A, Pohl K, Syeda-Mahmood T, Terdiman J, Wang F.
Source
IBM Almaden Research Center, San Jose, CA, USA.
Abstract
Modern Electronic Medical Record (EMR) systems often integrate large amounts of data from multiple disparate sources. To do so, EMR systems must align the data to create consistency between these sources. The data should also be presented in a manner that allows a clinician to quickly understand the complete condition and history of a patient’s health. We develop the AALIM system to address these issues using advanced multimodal analytics. First, it extracts and computes multiple features and cues from the patient records and medical tests. This additional metadata facilitates more accurate alignment of the various modalities, enables consistency check and empowers a clear, concise presentation of the patient’s complete health information. The system further provides a multimodal search for similar cases within the EMR system, and derives related conditions and drugs information from them. We applied our approach to cardiac data from a major medical care organization and found that it produced results with sufficient quality to assist the clinician making appropriate clinical decisions.
PMID: 20841805 [PubMed – indexed for MEDLINE]
DSS development for Enhancement of Heart Drug Compliance by Cardiac Patients
A good example of a thorough and effective CDSS development process is an electronic checklist developed by Riggio et al. at Thomas Jefferson University Hospital (TJUH) [12]. TJUH had a computerized physician order-entry system in place. To meet congestive heart failure and acute myocardial infarction quality measures (e.g., use of aspirin, beta blockers, and angiotensin-converting enzyme (ACE) inhibitors), a multidisciplinary team including a focus group of residents developed a checklist, embedded in the computerized discharge instructions, that required resident physicians to prescribe the recommended medications or choose from a drop-down list of contraindications. The checklist was vetted by several committees, including the medical executive committee, and presented at resident conferences for feedback and suggestions. Implementation resulted in a dramatic improvement in compliance.
http://virtualmentor.ama-assn.org/2011/03/medu1-1103.html
Early DSS Development at Stanford Medical Center in the 70s
MYCIN (1976) MYCIN was a rule-based expert system designed to diagnose and recommend treatment for certain blood infections (antimicrobial selection for patients with bacteremia or meningitis). It was later extended to handle other infectious diseases. Clinical knowledge in MYCIN is represented as a set of IF-THEN rules with certainty factors attached to diagnoses. It was a goal-directed system, using a basic backward chaining reasoning strategy (resulting in exhaustive depth-first search of the rules base for relevant rules though with additional heuristic support to control the search for a proposed solution). MYCIN was developed in the mid-1970s by Ted Shortliffe and colleagues at Stanford University. It is probably the most famous early expert system, described by Mark Musen as being “the first convincing demonstration of the power of the rule-based approach in the development of robust clinical decision-support systems” [Musen, 1999].
The EMYCIN (Essential MYCIN) expert system shell, employing MYCIN’s control structures was developed at Stanford in 1980. This domain-independent framework was used to build diagnostic rule-based expert systems such as PUFF, a system designed to interpret pulmonary function tests for patients with lung disease.
http://www.bmj.com/content/346/bmj.f657
ECG for Detection of MI: DSS use in Cardiovascualr Disease Management
http://faculty.ksu.edu.sa/AlBarrak/Documents/Clinical%20Decision%20Support%20Systems_Ch01.pdf
also showed that neural networks did a better job than two experienced cardiologists in detecting acute myocardial infarction in electrocardiograms with concomitant left bundle branch block.
Olsson SE, Ohlsson M, Ohlin H, Edenbrandt L. Neural networks—a diagnostic tool in acute myocardial infarction with concomitant left bundle branch block. Clin Physiol Funct Imaging 2002;22:295–299.
Sven-Erik Olsson, Hans Öhlin, Mattias Ohlsson and Lars Edenbrandt
Neural networks – a diagnostic tool in acute myocardial infarction with concomitant left bundle branch block
Clinical Physiology and Functional Imaging 22, 295-299 (2002)
Abstract
The prognosis of acute myocardial infarction (AMI) improves by early revascularization. However the presence of left bundle branch block (LBBB) in the electrocardiogram (ECG) increases the difficulty in recognizing an AMI and different ECG criteria for the diagnosis of AMI have proved to be of limited value. The purpose of this study was to detect AMI in ECGs with LBBB using artificial neural networks and to compare the performance of the networks to that of six sets of conventional ECG criteria and two experienced cardiologists. A total of 518 ECGs, recorded at an emergency department, with a QRS duration > 120 ms and an LBBB configuration, were selected from the clinical ECG database. Of this sample 120 ECGs were recorded on patients with AMI, the remaining 398 ECGs being used as a control group. Artificial neural networks of feed-forward type were trained to classify the ECGs as AMI or not AMI. The neural network showed higher sensitivities than both the cardiologists and the criteria when compared at the same levels of specificity. The sensitivity of the neural network was 12% (P = 0.02) and 19% (P = 0.001) higher than that of the cardiologists. Artificial neural networks can be trained to detect AMI in ECGs with concomitant LBBB more effectively than conventional ECG criteria or experienced cardiologists.
http://home.thep.lu.se/~mattias/publications/papers/lu_tp_00_38_abs.html
Additional SOURCES:
http://www.implementationscience.com/content/6/1/92
Comment of Note
During 1979-1983 Dr. Aviva Lev-Ari was part of Prof. Ronald A. Howard, Stanford University, Study Team, the consulting group to Stanford Medical Center during MYCIN feature enhancement development.
Professor Howard is one of the founders of the decision analysis discipline. His books on probabilistic modeling, decision analysis, dynamic programming, and Markov processes serve as major references for courses and research in these fields.
https://engineering.stanford.edu/profile/rhoward
It was Prof. Howard from EES, Prof. Amos Tversky of Behavior Science (Advisor of Dr. Lev-Ari’s Masters Thesis at HUJ), and Prof. Kenneth Arrow, Economics, with 15 doctoral students in the early 80s, that formed the Interdisciplinary Decision Analysis Core Group at Stanford. Students of Prof. Howard, chiefly, James E. Matheson, started the Decision Analysis Practice at Stanford Research Institute (SRI, Int’l) in Menlo Park, CA.
Dr. Lev-Ari was hired on 3/1985 to head SRI’s effort in algorithm-based DSS development. The models she developed were applied in problem solving for SRI Clients, among them Pharmaceutical Manufacturers: Ciba Geigy, now NOVARTIS, DuPont, FMC, Rhone-Poulenc, now Sanofi-Aventis.