The good, the bad and the ugly of sulfur and volcanic activity
Larry H Bernstein, MD, FCAP, Curator
LPBI
Climate change deniers have promulgated much ignorance about the planet and our life on earth. Nevertheless, I shall deal with geophysical and geochemical issues and indirectly, climate change in this portion of the discussion. The good, the bad, and the ugly has everything to due with the elements and to life on earth. This is the case, regardless of claims propagated by the tobacco and the carbon fuels interests. I shall proceed as I have done in the previous discussions.
Is a Lack of Water to Blame for the Conflict in Syria?
A 2006 drought pushed Syrian farmers to migrate to urban centers, setting the stage for massive uprisings
SMITHSONIAN MAGAZINE
An Iraqi girl stands on former marshland, drained in the 1990s because of politically motivated water policies. (Essam Al-Sudani / AFP / Getty Images)
http://thumbs.media.smithsonianmag.com//filer/Scare-Tactics-Iraqi-girl-631.jpg__800x600_q85_crop.jpg
The world’s earliest documented water war happened 4,500 years ago, when the armies of Lagash and Umma, city-states near the junction of the Tigris and Euphrates rivers, battled with spears and chariots after Umma’s king drained an irrigation canal leading from the Tigris. “Enannatum, ruler of Lagash, went into battle,” reads an account carved into an ancient stone cylinder, and “left behind 60 soldiers [dead] on the bank of the canal.”
RELATED CONTENT
Water loss documented by the Gravity Recovery and Climate Experiment (GRACE), a pair of satellites operated by NASA and Germany’s aerospace center, suggests water-related conflict could be brewing on the riverbank again. GRACE measured groundwater usage between 2003 and 2009 and found that the Tigris-Euphrates Basin—comprising Turkey, Syria, Iraq and western Iran—is losing water faster than any other place in the world except northern India . During those six years, 117 million acre-feet of stored freshwater vanished from the region as a result of dwindling rainfall and poor water management policies. That’s equal to all the water in the Dead Sea. GRACE’s director, Jay Famiglietti, a hydrologist at the University of California, Irvine, calls the data “alarming.”
While the scientists captured dropping water levels, political experts have observed rising tensions. In Iraq, the absence of a strong government since 2003, drought and shrinking aquifers have led to a recent spate of assassinations of irrigation department officials and clashes between rural clans. Some experts say that these local feuds could escalate into full-scale armed conflicts .
In Syria, a devastating drought beginning in 2006 forced many farmers to abandon their fields and migrate to urban centers. There’s some evidence that the migration fueled the civil war there, in which 80,000 people have died. “You had a lot of angry, unemployed men helping to trigger a revolution,” says Aaron Wolf, a water management expert at Oregon State University, who frequently visits the Middle East.
Tensions between nations are also high. Since 1975, Turkey’s dam and hydropower construction has cut water flow to Iraq by 80 percent and to Syria by 40 percent. Syria and Iraq have accused Turkey of hoarding water.
Hydrologists say that the countries need to find alternatives to sucking the aquifers dry—perhaps recycling wastewater or introducing desalination—and develop equitable ways of sharing their rivers. “Water doesn’t know political boundaries. People have to get together and work,” Famiglietti says. One example lies nearby, in an area not known for cross-border cooperation. Israeli and Jordanian officials met last year for the first time in two decades to discuss rehabilitating the nearly dry Jordan River, and Israel has agreed to release freshwater down the river.
“It could be a model” for the Tigris-Euphrates region, says Gidon Bromberg, a co-director of Friends of the Earth Middle East, who helped get the countries together. Wolf, too, remains optimistic, noting that stress can encourage compromise.
History might suggest a way: The world’s first international water treaty, a cuneiform tablet now hanging in the Louvre, ended the war between Lagash and Umma.
http://static.guim.co.uk/ni/1404220722088/Iraq_water_dams.svg
“Rebel forces are targeting water installations to cut off supplies to the largely Shia south of Iraq,” says Matthew Machowski, a Middle East security researcher at the UK houses of parliament and Queen Mary University of London.
“It is already being used as an instrument of war by all sides. One could claim that controlling water resources in Iraq is even more important than controlling the oil refineries, especially in summer. Control of the water supply is fundamentally important. Cut it off and you create great sanitation and health crises,” he said
Isis now controls the Samarra barrage west of Baghdad on the River Tigris and areas around the giant Mosul Dam, higher up on the same river. Because much of Kurdistan depends on the dam, it is strongly defended by Kurdish peshmerga forces and is unlikely to fall without a fierce fight, says Machowski.
Iraqi troops were rushed to defend the massive 8km-long Haditha Dam and its hydroelectrical works on the Euphrates to stop it falling into the hands of Isis forces. Were the dam to fall, say analysts, Isis would control much of Iraq’s electricity and the rebels might fatally tighten their grip on Baghdad.
Isis fighters in Fallujah captured the smaller Nuaimiyah Dam on the Euphrates and deliberately diverted its water to “drown” government forces in the surrounding area. Millions of people in the cities of Karbala, Najaf, Babylon and Nasiriyah had their water cut off but the town of Abu Ghraib was catastrophically flooded along with farms and villages over 200 square miles. According to the UN, around 12,000 families lost their homes.
Earlier, Kurdish forces reportedly diverted water supplies from the Mosul Dam. Equally, Turkey has been accused of reducing flows to the giant Lake Assad, Syria’s largest body of fresh water, to cut off supplies to Aleppo, and Isis forces have reportedly targeted water supplies in the refugee camps set up for internally displaced people.
Iraqis fled from Mosul after Isis cut off power and water and only returned when they were restored, says Machowski. “When they restored water supplies to Mosul, the Sunnis saw it as liberation. Control of water resources in the Mosul area is one reason why people returned,” said Machowski.
Both Isis forces and President Assad’s army are said to have used water tactics to control the city of Aleppo. The Tishrin Dam on the Euphrates, 60 miles east of the city, was captured by Isis in November 2012.
“The deliberate targeting of water supply networks … is now a daily occurrence in the conflict. The water pumping station in Al-Khafsah, Aleppo, stopped working on 10 May, cutting off water supply to half of the city.
https://i.guim.co.uk/img/static/sys-images/Guardian/Pix/pictures/2014/7/2/1404300629581/
A satellite view showing the two main rivers running from Turkey through Syria and Iraq. Credits: MODIS/NASA
The Euphrates River, the Middle East’s second longest river, and the Tigris, have historically been at the centre of conflict. In the 1980s, Saddam Hussein drained 90% of the vast Mesopotamian marshes that were fed by the two rivers to punish the Shias who rose up against his regime. Since 1975, Turkey’s dam and hydropower constructions on the two rivers have cut water flow to Iraq by 80% and to Syria by 40%. Both Syria and Iraq have accused Turkey of hoarding water and threatening their water supply.
http://www.irinnews.org/photo/
The Barada River, shown here in Damascus, is the only notable river flowing entirely within Syrian territory. The city’s water supplies are under huge strain
DAMASCUS, 25 March 2010 (IRIN) – Poor planning and management, wasteful irrigation systems, intensive wheat and cotton farming and a rapidly growing population are straining water resources in Syria in a year which has seen unprecedented internal displacement as a result of drought in eastern and northeastern parts of the country.
In 2007 Syria consumed 19.2 billion cubic metres of water – 3.5 billion more than the amount of water replenished naturally, with the deficit coming from groundwater and reservoirs, according to the Ministry of Irrigation.
Agriculture accounts for almost 90 percent of the country’s water consumption, according to government and private sector.
Agricultural policies encourage water-hungry wheat and cotton cultivation, and inefficient irrigation methods mean much water is wasted.
South Asia is a desperately water-insecure region, and India’s shortages are part of a wider continental crisis. According to a recent report authored by UN climate scientists, coastal areas in Asia will be among the worst affected by climate change. Hundreds of millions of people across East, Southeast and South Asia, the report concluded, will be affected by flooding, droughts, famine, increases in the costs of food and energy, and rising sea levels.
Groundwater serves as a vital buffer against the volatility of monsoon rains, and India’s falling water table therefore threatens catastrophe. 60 percent of north India’s irrigated agriculture is dependent on ground water, as is 85 percent of the region’s drinking water. The World Bank predicts that India only has 20 years before its aquifers will reach “critical condition” – when demand for water will outstrip supply – an eventuality that will devastate the region’s food security, economic growth and livelihoods.
Analysts fear that growing competition for rapidly dwindling natural resources will trigger inter-state or intra-state conflict. China and India continue to draw on water sources that supply the wider region, and a particularly concerning flashpoint is the Indus River Valley basin that spans India and Pakistan. The river’s waters are vital to the economies of areas on both sides of the border and a long-standing treaty, agreed by Pakistan and India in 1960, governs rights of access. But during the “dry season,” between October and March, water levels fall to less than half of those seen during the remainder of the year. The fear is that cooperation over access to the Indus River will fray as shortages become more desperate.
http://cdn1.pri.org/sites/default/files/styles/story_main/public/story/images/IMG_5937.jpeg
Farm worker heading for the paddy fields at Gubinder Singh’s farm
The Indo-Gangetic Basin, which lies at the foothills of the Himalayas, is one of the areas in the world facing a huge water crisis. The Basin spans from Pakistan, across Northern India into Bangladesh. Apart from runoff from mountainous streams and glaciers, it also holds one of the largest underground bodies of water in the world. But it’s also in one of the most populous regions of the world, with more than a billion people living on the subcontinent. Still, parts of the region are well-resourced when it comes to water supplies – like the Indian state of Punjab, which has three rivers running through it and a network of canals in some parts.
Player utilities
Listen to the Story.
NASA Satellites Unlock Secret to Northern India’s Vanishing Water
08.12.09
NASA Hydrologist Matt Rodell discusses vanishing groundwater in India. Credit:NASA
› Watch Video
http://www.nasa.gov/multimedia/nasatv/index.html

soil moisture belt
Groundwater resides beneath the soil surface in permeable rock, clay and sand as illustrated in this conceptual image. Many aquifers extend hundreds of feet underground and in some instances have filled with water over the course of thousands of years. Credit: NASA
http://www.nasa.gov/images/content/378067main_water_table%20illus_226.jpg

groundwater withdrawals as a percentage of groundwater recharge
The map, showing groundwater withdrawals as a percentage of groundwater recharge, is based on state-level estimates of annual withdrawals and recharge reported by India’s Ministry of Water Resources. The three states included in this study are labeled. Credit:NASA/Matt Rodell
http://www.nasa.gov/images/content/378381main_MattRodell_vid_226.jpg
The averaging function (spatial weighting) used to estimate terrestrial water storage changes from GRACE data is mapped. Warmer colors indicate greater sensitivity to terrestrial water storage changes. Credit: NASA/Matt Rodell
http://www.nasa.gov/images/content/378067main_water_table%20illus_226.jpg
Beneath northern India’s irrigated fields of wheat, rice, and barley … beneath its densely populated cities of Jaiphur and New Delhi, the groundwater has been disappearing. Halfway around the world, hydrologists, including Matt Rodell of NASA, have been hunting for it.
Where is northern India’s underground water supply going? According to Rodell and colleagues, it is being pumped and consumed by human activities — principally to irrigate cropland — faster than the aquifers can be replenished by natural processes. They based their conclusions — published in the August 20 issue of Nature — on observations from NASA’s Gravity Recovery and Climate Experiment (GRACE).
“If measures are not taken to ensure sustainable groundwater usage, consequences for the 114 million residents of the region may include a collapse of agricultural output and severe shortages of potable water,” said Rodell, who is based at NASA’s Goddard Space Flight Center in Greenbelt, Md.
https://www.quora.com/Why-are-there-no-earthquakes-or-volcanos-in-the-Himalayas
The Himalayas are representative of a modern and active mountain-building event, called anorogeny in geologic parlance. Both the Himalayas and the Cascade Range are the result of plate-to-plate collision in the Theory of Plate Tectonics.
The difference between the Himalayas and the Cascade Range volcanoes is based on density of the lithospheric plates. Yes. The Cascade Range is caused by subduction of more dense ocean crust into and underneath lighter, lower density continental crust. As the oceanic plate dives deeper and deeper, the ocean crust warms, melts, and rises upward through the overriding continental crust “inland” from the plate collision boundary. As that molten rock punches through the continental crust, a curvilinear series of volcanoes, generally parallel to the plate collision boundary, begins to form.

Cascade Range Subduction
Cascade Range Subduction from J. Wiley & Sons – 2010
In the case of the Cascade Range, the name of this type of volcanic formation is unique in process, as well as geochemistry, and has been referred to as an Andesitic-type after the Andes Mountains. Regardless, the Cascade Range is comprised of intermediate igneous rocks, with a fairly high silica content. High silica makes for high siliceous acid. That creates “sticky” igneous extrusions that often have quite dramatic eruptions [May 1980 Mt. St. Helens eruption].
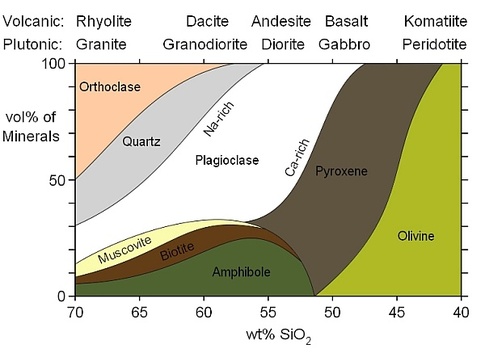
Igneous Rock Classification
Igneous Rock Classification Chart – Public Domain
The Himalayas are also a plate-to-plate collision tectonic boundary. In this case, the Indian Plate [of the Indian Subcontinent] is colliding head-on with the Eurasian Plate. Both plates are comprised of continental lithospheric crust, so there is no appreciable distinction in density. Both have a density of approximately 2.7 g/cm³. This as opposed to ocean crust with a mean density of 3.3 g/cm³. The plates try to compete in the plate-to-plate collision but the equal densities of the two plates cannot push one under the other very deep like that in a subduction zone. The result is large-scale thickening of the continental crust in the region at and surrounding the collision boundary. Other processes occurring in the Himalayas region associated with the orogeny are metamorphism, thrust [compression] faulting, and plateau uplift.

Depiction of Himalayan Collision
Generalized Depiction of Himalayan Collision from FHSU – 2010
A perfect analogy is two trucks of the same make and model colliding head-on. The Himalayan Orogeny is the oft mentioned “crumple zone”. Metal does not deform in a brittle sense like competent rock does, so don’t confuse that too much.
With all that being said, there are tremendous temperatures attained at a continental plate-to-plate collision boundary. However, the crust is simply too thick, and too “squashed together” to allow anything to squeeze up and break through to the surface as volcanic eruptions.
References:
FHSU, 2010. Image of Himalayan Collision. Fort Hays State University. Hays, Kansas. 2010.
Wiley & Sons, J., 2010. Image of Cascade Range Subduction Zone. J. Wiley & Sons. Hoboken, New Jersey. 2010.
Mt. Everest was formed (is forming) by two tectonic plates colliding–the Indo-Australian Plate and the Eurasian plate.
Sometimes, when two tectonic plates collide, volcanoes form (such as the Juan de Fuca plate and the North American Plate forming the Cascades). However, this has to do with one plate–in this case the Juan de Fuca Plate sliding or subducting beneath another–the North American Plate. This happens because the oceanic plate (the Juan de Fuca Plate) is more dense than than the continental plate (the NA Plate). For reasons I won’t get into here, magma forms between the two plates as one subducts beneath the other and volcanoes are formed.
Mt. Everest is formed by two continental plates colliding. Continental plates are generally too buoyant to subduct beneath each other. While some subduction occurred during this collision, most of what happened was crustal shortening. Think about what happens when you have a rug on a wood floor and push two ends toward each other. It buckles and folds up in itself. This is a simplified version of what happened in the Himalaya.
Because little to no subduction is occurring, no magma is forming and Mt. Everest will not become a volcano.
The Himalayas were created by two continental plates colliding. What happens when two masses of rocks with some similarities, like in density, collide? Both of them rise. There is a lot of heat produced. However, there isn’t enough heat to melt rocks completely. For there to be a volcano, there has to be a source of molten rock.
This material can occur if the two masses of rocks have vastly different densities. In this case, the heavier mass will slide above the other. The mass on the bottom will melt. This molten rock material will rise and create a volcano. or two or more. This, however can not happen in the HImalayas. The two masses in action are the Indian Plate and the Eurasian Plate, which have similar rock density.
Volcanic Eruptions and the Role of Sulfur Dioxide in Climate Change
In March and April of this year, a series of severe volcanic eruptions shook Alaska’s Mount Redoubt.1 To date, the largest of the eruptions produced an ash plume that reached 50,000 feet above sea level and released a significant amount of sulfur dioxide (CAS Registry Number® 7446-09-5) into the earth’s atmosphere. According to the Alaska Volcano Observatory, “The main concerns for human health in volcanic haze consist of ash, sulfur dioxide gas (SO2), and sulfuric acid droplets (H2SO4), which forms when volcanic SO2 oxidizes in the atmosphere.”1
While there is obvious reason for alarm among local populations, sulfur dioxide from the Mount Redoubt eruption could also have more widespread impacts, particularly on the climate. According to a 1997 article published in the Journal of Geology, “The mechanism by which large eruptions affect climate is generally accepted: injection of sulfur into the stratosphere and conversion to sulfate aerosol, which in turn reduces the solar energy reaching the earth’s surface.”2
In the years following a volcanic eruption, sulfate aerosol that remains in the atmosphere is thought to cause surface cooling by reflecting the sun’s energy back into space. In fact, sulfate aerosol from the massive eruption of Indonesia’s Mount Tambora in 1815 is blamed, at least in part, for the “year without a summer” reported in Europe and North America in 1816:
- “Daily temperatures (especially the daily minimums) were in many cases abnormally low from late spring through early fall; frequent northwest winds brought snow and frost to northern New England and Canada, and heavy rains fell in western Europe. Many crops failed to ripen, and the poor harvests led to famine, disease, and social distress…”3
Supporting this claim, sulfate aerosol-related climate changes were also reported after the 1991 eruption of Mount Pinatubo in the Philippines.4 An article published inScience in 2002 summarizes a decade’s worth of research on Pinatubo’s effects on the global climate, highlighting impacts far more widespread and complex than previously thought:
- Robock, A. Pinatubo Eruption: The Climatic Aftermath. Science 2002, 295, 1242-1244.
You can use SciFinder® or STN® to search the CAS databases for additional information about sulfur dioxide from volcanic eruptions. If your organization is enabled to use the web version of SciFinder, you can click the links in this article to directly access details of the substances and references.
Volcanic ash vs sulfur aerosols
The primary role of volcanic sulfur aerosols in causing short-term changes in the world’s climate following some eruptions, instead of volcanic ash, was hypothesized by scientists in the early 1980’s. They based their hypothesis on the effects of several explosive eruptions in Indonesia and the world’s largest historical effusive eruption in Iceland.
Scientists studied three historical explosive eruptions of different sizes in Indonesia–Tambora (1815), Krakatau (1883), and Agung (1963). They noted that decreases in surface temperatures after the eruptions were of similar magnitude (0.18-1.3 °C). The amount of material injected into the stratosphere, however, differed greatly. By comparing the estimated amount of ash vs. sulfur injected into the stratosphere by each eruption, it was suggested that the longer residence time of sulfate aerosols, not the ash particles which fall out within a few months of an eruption, was the paramount controlling factor (Rampino and Self, 1982).
In contrast to these explosive eruptions, one of the most severe volcano-related climate effects in historical times was associated with a largely nonexplosive eruption that produced very little ash–the 1783 eruption of Laki crater-row in Iceland. The eruption lasted 8-9 months and extruded about 12.3 km3 of basaltic lava over an area of 565 km2. A bluish haze of sulfur aerosols all over Iceland destroyed most summer crops in the country; the crop failure led to the loss of 75% of all livestock and the deaths of 24% of the population (H. Sigurdsson, 1982). The bluish haze drifted east across Europe during the 1783-1784 winter, which was unusually severe.
Clearly, these examples suggested that the explosivity of an eruption and the amount of ash injected into the stratosphere are not the main factors in causing a change in Earth’s climate. Instead, scientists concluded that it must be the amount of sulfur in the erupting magma.
The eruption of El Chichon, Mexico, in 1982 conclusively demonstrated this idea was correct. The explosive eruption injected at least 8 Mt of sulfur aerosols into the atmosphere, and it was followed by a measureable cooling of parts of the Earth’s surface and a warming of the upper atmosphere. A similar-sized eruption at Mount St. Helens in 1980, however, injected only about 1 Mt of sulfur aerosols into the stratosphere. The eruption of Mount St. Helens injected much less sulfur into the atmosphere–it did not result in a noticeable cooling of the Earth’s surface. The newly launched TOMS satellite (in 1978) made it possible to measure these differences in the eruption clouds. Such direct measurements of the eruption clouds combined with surface temperatures make it possible to study the corrleation between volcanic sulfur aerosols (instead of ash) and temporary changes in the world’s climate after some volcanic eruptions.
Hazards Of Volcanic Ash
A multitude of dangerous particals and gases, such as aerosols, are carried in volcanic ash. Some of these include;
- Carbon dioxide
- Sulfates (sulfur dioxide)
- Hydrochloric acid
- Hydroflouric acid
These each have different but serious effects on human health if exposed, which will be discussed later.
In addition, volcanic ash can cause reduced visibility, and it is recommended that precautions are taken when driving.
Sources: Where Does It Come From?
Figure 1

volcanoes found all over the Earth, particularly at plate boundaries
There are volcanoes found all over the Earth, particularly at plate boundaries (see figure 1). This is due to the collision of plates, which causes uplift in the overlying crust. This uplift results in the formation of mountainous landforms; melting of the crust due to frictional heating is what creates magma, which can erupt out of these mountains when pressure gets too high.
Some of the most notable volcanic eruptions are:
- the 1783 eruption of Mt. Laki in Iceland
- released clouds of poisonous flourine and sulfur dioxide which killed off about 50% of the livestock population
- that summer in Great Britain was known as “sand-summer” due to ash carried over the Atlantic
- poisonous clouds spread over Europe, and a buildup of aerosols caused a cooling effect in the entire Northern Hemisphere
- the 1815 eruption of Mt. Tambora in Indonesia
- gas releases caused the Stratosphere to change drastically
- noxious ash and poisoned rain clouds killed off vegetation
- the 1902 eruption of Mt. Pelee in Martinique
- spewed toxic clouds traveling at speeds of 600mph
- largest eruption in the 20th century
For further information on volcanoes around the world, visit http://www.mapsofworld.com/major-volcanoes.htm.
http://www.chm.bris.ac.uk/webprojects2003/silvester/Page6Famous.htm
- EEA-33 emissions of sulphur oxides (SOX) have decreased by 74% between 1990 and 2011. In 2011, the most significant sectoral source of SOX emissions was ‘Energy production and distribution’ (58% of total emissions), followed by emissions occurring from ‘Energy use in industry’ (20%) and in the ‘Commercial, institutional and households’ (15%) sector.
- The reduction in emissions since 1990 has been achieved as a result of a combination of measures, including fuel-switching in energy-related sectors away from high-sulphur solid and liquid fuels to low-sulphur fuels such as natural gas, the fitting of flue gas desulphurisation abatement technology in industrial facilities and the impact of European Union directives relating to the sulphur content of certain liquid fuels.
- All of the EU-28 Member States have reduced their national SOX emissions below the level of the 2010 emission ceilings set in the National Emission Ceilings Directive (NECD)[1]. Emissions in 2011 for the three EEA countries having emission ceilings set under the UNECE/CLRTAP Gothenburg protocol (Liechtenstein, Norway and Switzerland) were also below the level of their respective 2010 ceilings.
- Environmental context: Typically, sulphur dioxide is emitted when fuels or other materials containing sulphur are combusted or oxidised. It is a pollutant that contributes to acid deposition, which, in turn, can lead to changes in soil and water quality. The subsequent impacts of acid deposition can be significant, including adverse effects on aquatic ecosystems in rivers and lakes and damage to forests, crops and other vegetation. SO2 emissions also aggravate asthma conditions and can reduce lung function and inflame the respiratory tract. They also contribute, as a secondary particulate pollutant, to the formation of particulate matter in the atmosphere, an important air pollutant in terms of its adverse impact on human health. Furthermore, the formation of sulphate particles in the atmosphere following the release of SO2 results in reflection of solar radiation, which leads to net cooling of the atmosphere.

faults sn-seafloor

Glacier – Helheim

Making North America

so2-global-1986

What caused the Nepal earthquake