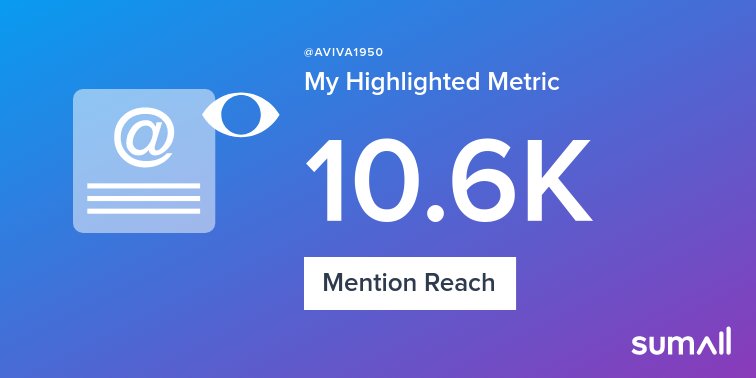
For @AVIVA1950, Founder, LPBI Group @pharma_BI:
Twitter Analytics [Engagement Rate, Link Clicks, Retweets, Likes, Replies]
&
Tweet Highlights [Tweets, Impressions, Profile Visits, Mentions, New Followers], 2019 – 2020
Data collection from Twitter Analytics on @AVIVA1950: Aviva Lev-Ari, PhD, RN
https://analytics.twitter.com/user/AVIVA1950/tweets
SEE DEFINITIONS, below
Twitter Summary for @AVIVA1950, 1/2019 – 4/2020

The Spikes in Profile visits, in Number of Tweets and in Number of Mentions are related to REAL TIME Press Coverage of Leading Conferences.
- On 3/14/2020 we launched the Coronavirus Portal and promoted it on Twitter.com
List of Conferences covered in 2019 by @AVIVA1950
- Koch Institute 2019 Immune Engineering Symposium, January 28-29, 2019, Kresge Auditorium, MIT
https://calendar.mit.edu/event/immune_engineering_symposium_2019#.XBrIDc9Kgcg
- 2019 MassBio’s Annual Meeting, State of Possible Conference , March 27 – 28, 2019, Royal Sonesta, Cambridge
http://files.massbio.org/file/MassBio-State-Of-Possible-Conference-Agenda-Feb-22-2019.pdf
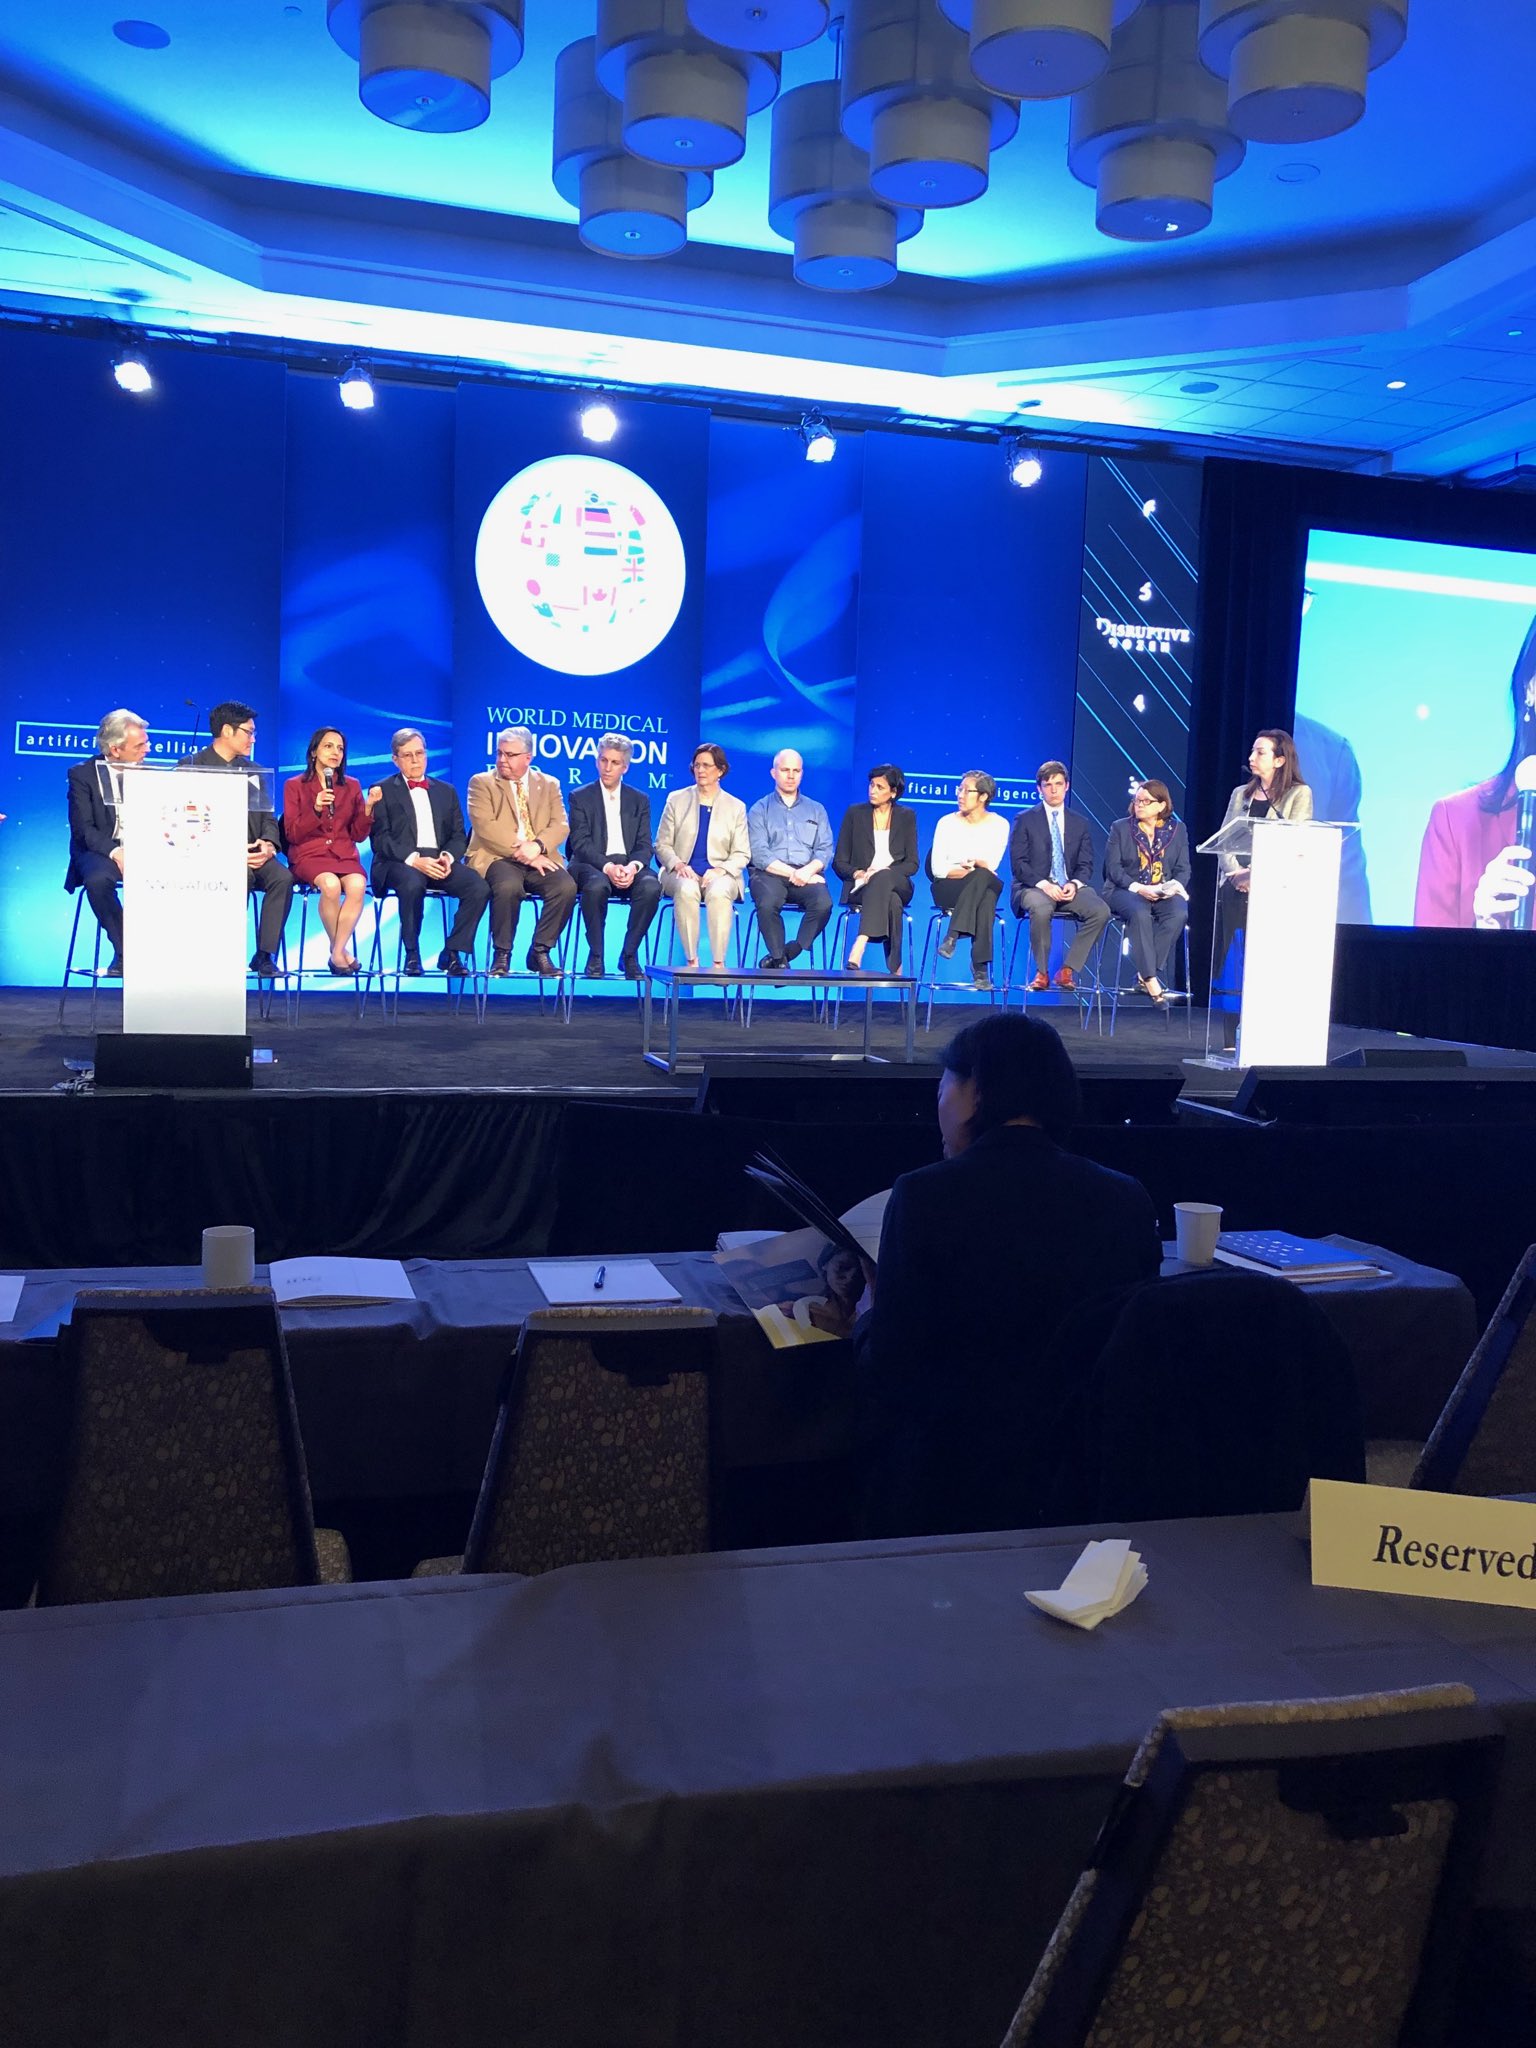
- World Medical Innovation Forum, Partners Innovations, ARTIFICIAL INTELLIGENCE | APRIL 8–10, 2019 | Westin, BOSTON
https://worldmedicalinnovation.org/agenda-list/
https://worldmedicalinnovation.org/
- 18th Annual 2019 BioIT, Conference & Expo, April 16-18, 2019, Boston, Seaport World Trade Center, Track 5 Next-Gen Sequencing Informatics – Advances in Large-Scale Computing
http://www.giiconference.com/chi653337/
- Translating Genetics into Medicine, April 25, 2019, 8:30 AM – 6:00 PM, The New York Academy of Sciences, 7 World Trade Center, 250 Greenwich St Fl 40, New York
- 13th Annual US-India BioPharma & Healthcare Summit, May 9, 2019, Marriott, Cambridge
- 2019 Petrie-Flom Center Annual Conference: Consuming Genetics: Ethical and Legal Considerations of New Technologies, May 17, 2019, Harvard Law School
http://petrieflom.law.harvard.edu/events/details/2019-petrie-flom-center-annual-conference
- Not included in this data: Real Time Coverage of BIO 2019 International Convention, June 3-6, 2019 Philadelphia Convention Center; Philadelphia PA by Stephen J. Williams, PhD @StephenJWillia2
Reporter: Stephen J. Williams, PhD @StephenJWillia2
- 2019 Koch Institute Symposium – Machine Learning and Cancer, June 14, 2019, 8:00 AM-5:00 PM ET MIT Kresge Auditorium, 48 Massachusetts Ave, Cambridge, MA
- Not included in this data: MinneBOS 2019, Field Guide to Data Science & Emerging Tech in the Boston Community, August 22, 2019, 8AM to 5PM at Boston University Questrom School of Business, 595 Commonwealth Avenue, Boston, MAhttps://pharmaceuticalintelligence.com/2019/07/31/minnebos-2019-field-guide-to-data-science-emerging-tech-in-the-boston-community-august-22-2019-8am-to-5pm-at-boston-university-questrom-school-of-business-595-commonwealth-avenue-boston/
-
Charles River Laboratories – World Congress, Delivering Therapies to the Clinic Faster, September 23 – 24, 2019, Cambridge, MA
- 2019 Warren Alpert Foundation Award Ceremony and Acceptance Lectures by Awardees, October 3, 2019, Harvard Medical School, Boston, MA Award goes to Four Scientists for Seminal Discoveries in OptoGenetics – Illuminating the Human Brain
- DISCOVER BRIGHAM | NOVEMBER 7, 2019, 10AM – 6PMhttps://pharmaceuticalintelligence.com/2019/11/06/discover-brigham-november-7-2019-10am-6pm/
- 15th Annual Personalized Medicine Conference at Harvard Medical School – THE PARADIGM EVOLVES, November 13 – 14, 2019 • Harvard Medical School, Boston, MA
-
2019 New England Venture Summit being held December 4th 2019 at the Hilton in Boston Dedham
Twitter Summary for @AVIVA1950, 1/1/2019 – 4/20/2020
| Month | Tweets | Profile visits | Mentions | Followers | Tweet impressions |
| Jan-19 | 21 | 25,100 | |||
| Feb-19 | 1 | 62 | 21 | 23,100 | |
| Mar-19 | 155 | 533 | 153 | 10 | 23,500 |
| Apr-19 | 257 | 690 | 235 | 14 | 64,200 |
| May-19 | 281 | 691 | 238 | 28 | 70,400 |
| Jun-19 | 206 | 581 | 170 | 23 | 58,400 |
| Jul-19 | 83 | 321 | 62 | 15 | 25,500 |
| Aug-19 | 121 | 218 | 86 | 10 | 27,700 |
| Sep-19 | 59 | 97 | 36 | -6 | 28,400 |
| Oct-19 | 67 | 50 | 36 | 6 | 23,600 |
| Nov-19 | 175 | 165 | 157 | 8 | 53,300 |
| Dec-19 | 116 | 128 | 81 | 8 | 32,000 |
| Jan-20 | 50 | 66 | 40 | 5 | 12,500 |
| Feb-20 | 53 | 122 | 42 | 11 | 17,600 |
| Mar-20 | 146 | 96 | 129 | 6 | 27,300 |
| Apr-20 | 264 | 282 | 132 | 3 | 28,300 |
Twitter Summary for @AVIVA1950, 5/1/2020 – 12/31/2020
|
Month |
Tweets
|
Tweet impressions
|
Profile visits
|
Mentions
|
Followers
|
| Dec20 | |||||
| Nov20 | |||||
| Oct20 | |||||
| Sept20 | |||||
| Aug20 | |||||
| July20 | |||||
| June20 | |||||
| May20 | |||||
March 2020 & April 2020
Coronavirus Portal was Launched on 3/14/2020 to May 8, 2020
- Your Tweets earned 53.7K impressions over this 56 day period
- Your Tweets earned 952 impressions per day over this 56 day period
Top Engagement Rate (%)

Top Impressions
-
Aviva Lev-Ari @AVIVA1950 Mar 16Task Force: COVID-19 Testing Site Expansion Set medpagetoday.com/infectiousdise… PharmaceuticalIntelligence.com #Coronavirus #Portal @StephenJWillia2 @kdnuggets @GilPress @pharma_BI @AVIVA1950 @google website CRITICAL information #community shared1,39770.5%View Tweet activity
-
1,245131.0%Aviva Lev-Ari @AVIVA1950 Mar 15#CoronavirusPortal #open #Guest #Authors @pharma_BI @AVIVA1950 @RickMandahl @GailThornt @irirobu @StephenJWillia2 @sudiptasaha1977 @bernstein_h @EricTopol @JoelSherlock @JasonZielonka @MarkmanOfer @JdPearlman @bernstein_h @kdnuggets @GilPress @pharmaceuticalIntelligence.com twitter.com/kdnuggets/stat…1,22380.7%
TWEET HIGHLIGHTS – April 2020
Top Tweet earned 357 impressions
Top Follower followed by 144K people
Top mention earned 12 engagements
TWEET HIGHLIGHTS – March 2020
Top Tweet earned 1,367 impressions
Top Follower followed by 113K people
![]()
Digital Transformation Consulting #AI #MachineLearning #DeepLearning #DataScience #AIEthics #CloudComputing #Fintech #DigitalMarketing
January to July 2019
Impressions, Engagement Rate, Link Clicks, Retweets, Likes, Replies
|
2019 Average Impressions per day by Month |
Monthly
Average Engagement Rate & Last day of the month |
Monthly
Average Link Clicks & Last day of the month & average link clicks per day |
Monthly
Average Retweets & Last day of the month & average Retweets per day |
Monthly
Average Likes & Last day of the month & average Likes per day |
Monthly Average Replies & Last day of the month & average Replies per day |
|
January 31 N = 809 |
2.4% / 2.2% | 33 / 3 / 1 | 80 / 4 / 3 | 129 / 5 / 4 |
2 /1 /0 |
|
February 28 N = 825 |
2.1% / 11.7% | 22 / 0 / 1 | 24 / 3 / 1 | 41 / 1 / 1 |
1 / 0 / 0 |
|
March 31 N = 759 |
2.5% / 0.5% | 18 / 1/ 1 | 37 / 1/ 1 | 63 / 1 / 2 | 1 / 0 / 0 |
|
April 30 N = 2.1K |
1.0% / 1.8% | 21 / 1/ 1 | 130 / 3 / 4 | 201 / 3 / 7 |
0 / 0/ 0 |
|
May 31 N = 2.3K |
1.3% / 1.2% | 51 / 3 / 2 | 117 / 2 / 4 | 142 / 2 / 5 |
3 / 0 / 0 |
|
June 30 N = 1.9K |
1.2% / 0.1% | 33 / 0 / 1 | 124 / 1 / 4 | 161 / 0 / 5 |
1 / 0 / 0 |
|
July 31 N = 824 |
0.9% / 1.1% | 54 / 4/ 2 | 42 / 6 / 1 | 40 / 3 / 1 |
3 / 0 / 0 |
|
August N = |
|||||
|
October N = |
|||||
|
November N = |
|||||
|
December N = |
Tweets, Impressions, Profile Visits, Mentions, New Followers
|
2019 |
Tweets | Impressions | Profile visits | Mentions | New Followers |
|
January |
|
25.1K | 21 | ||
|
February |
1 | 23.1K | 62 |
21 |
|
| March | 155 | 23.5K | 533 | 153 |
10 |
|
April |
257 | 64.2K | 690 | 235 | 14 |
|
May |
281 | 70.4K | 691 | 238 |
28 |
| June |
206 |
58.4K | 581 | 170 |
23 |
|
July |
83 | 25.5K | 321 | 62 |
15 |
|
August |
121 | 27.7K | 218 | 86 | 10 |
|
September |
59 | 28.4K | 97 | 36 | -6 |
|
October |
67 | 23.6K | 50 | 36 | 6 |
|
November |
175 | 53.3K | 165 | 157 | 8 |
|
December |
116 | 32K | 128 | 81 | 8 |
Jul 2019 • 31 days
TWEET HIGHLIGHTS
Top Tweet earned 1,681 impressions
Top Follower followed by 112K people
![]()
Leading provider of Internet, phone & tv services for #startup #smb & #enterprise Grow your #business – Visit https://t.co/gmfFBMeTIA & https://t.co/f64tLDZpwN
Top mention earned 36 engagements
JUL 2019 SUMMARY
Tweets
Tweet impressions
Profile visits
Mentions
New followers
Jun 2019 • 30 days
TWEET HIGHLIGHTS
Top Tweet earned 2,280 impressions
Top Follower followed by 289K people
![]()
Tweeting Climate Change news. Climate lecturer: science, policy, solutions. Director Klima 2020, former UN Director. For contact use svein@klima2020.no
Top mention earned 21 engagements
JUN 2019 SUMMARY
Tweets
Tweet impressions
Profile visits
Mentions
New followers
May 2019 • 31 days
TWEET HIGHLIGHTS
Top Tweet earned 3,800 impressions
Top Follower followed by 202K people
![]()
Public Speaker | Moderator | Diplomat | Photographer | Yale World Fellow | Climate Change | Wildlife | Environment | Art | Energy-Water-Food | Sustainability 🌱
Top mention earned 36 engagements
Top media Tweet earned 1,319 impressions

MAY 2019 SUMMARY
Tweets
Tweet impressions
Profile visits
Mentions
New followers
Apr 2019 • 30 days
TWEET HIGHLIGHTS
Top Tweet earned 2,758 impressions
Top Follower followed by 253K people
![]()
#B2B #Social #Digital #Influencer helping #Techclients w/ #SocialMediaMarketing in #Telecom #5G#Cloud #IoT #DigitalHealth @evirahealth#ATTinfluencer
Top mention earned 56 engagements

Top media Tweet earned 1,652 impressions
APR 2019 SUMMARY
Tweets
Tweet impressions
Profile visits
Mentions
New followers
Mar 2019 • 31 days
TWEET HIGHLIGHTS
Top Tweet earned 624 impressions
Top Follower followed by 450K people
![]()
Non-Profit Founder/Leader | ❤️ Doc | Artist | Scientist | Educator | Med News Anchor https://t.co/LDrNxgwhA4 | RT ≠ endorse | Disclaimer here: https://t.co/2jtJQZQU0H
Top mention earned 8 engagements

Top media Tweet earned 440 impressions

MAR 2019 SUMMARY
Tweets
Tweet impressions
Profile visits
Mentions
New followers
Feb 2019 • 28 days
TWEET HIGHLIGHTS
Top Tweet earned 795 impressions
Top Follower followed by 252K people
![]()
Music Lovers Network #Musicians. ♫♫ Connecting #Music talented #Artists with #Producers, A&Rs and Fans. #MusicIsLife #indiemusic #entertainment#musicbiz
Top mention earned 6 engagements
Top media Tweet earned 55 impressions
FEB 2019 SUMMARY
Tweets
Tweet impressions
Profile visits
New followers
Jan 2019 •31 days
TWEET HIGHLIGHTS
Top Follower followed by 450K people
![]()
Non-Profit Founder/Leader | ❤️ Doc | Artist | Scientist | Educator | Med News Anchor https://t.co/LDrNxgwhA4 | RT ≠ endorse | Disclaimer here: https://t.co/2jtJQZQU0H
JAN 2019 SUMMARY
Tweet impressions
New followers
Definitions
What is a Good Engagement Rate on Twitter? – Scrunch
https://www.scrunch.com/blog/what-is-a-good-engagement-rate-on-twitter
How to calculate engagement rate on Twitter?
Formulas Revealed: The Facebook and Twitter Engagement Rate …
6 engagement rate calculation methods
These are the most common formulas you’ll need to calculate engagement rates on social media.
Total engagements typically represents a tally of likes, favourites, reactions, comments, shares, views, retweets, and sometimes include clicks, depending on which platform you’re using.
1. Engagement rate by reach (ERR)
This formula is the most common way to calculate engagement with content.
ERR measures the percentage of people who chose to interact with your content after seeing it.
Use the first formula for a single post, and the second one to calculate the average rate across multiple posts.
- ERR = total engagements per post / reach per post * 100
To determine the average, add up the all the ERRs from the posts you want to average, and divide by number of posts:
- Average ERR = Total ERR / Total posts
In other words: Post 1 (3.4%) + Post 2 (3.5%) / 2 = 3.45%
Pros: Reach can be a more accurate measurement than follower count, since not all your followers will see all your content. And non-followers may have been exposed to your posts through shares, hashtags, and other means.
Cons: Reach can fluctuate for a variety of reasons, making it a different variable to control. A very low reach can lead to a disproportionately high engagement rate, and vice versa, so be sure to keep this in mind.
2. Engagement rate by posts (ER post)
Technically, this formula measures engagements by followers on a specific post. In other words, it’s similar to ERR, except instead of reach it tells you the rate at which followers engage with your content.
Most social media influencers calculate their average engagement rate this way.
- ER post = Total engagements on a post / Total followers *100
To calculate the average, add up all the ER posts you want to average, and divide by number of posts:
- Average ER by post = Total ER by post / Total posts
Example: Post 1 (4.0%) + Post 2 (3.0%) / 2 = 3.5%
Pros: While ERR is a better way to gauge interactions based on how many people have seen your post, this formula replaces reach with followers, which is generally a more stable metric.
In other words, if your reach fluctuates often, use this method for a more accurate measure of post-by-post engagement.
Cons: As mentioned, while this may be a more unwavering way to track engagements on posts, it doesn’t necessarily provide the full picture since it doesn’t account for viral reach. And, as your follower count goes up, your rate of engagement could drop off a little.
Make sure to view this stat alongside follower growth analytics.
Bonus: Get a free social media report template to easily and effectively present your social media performance to key stakeholders.
3. Engagement rate by impressions (ER impressions)
Another base audience metric you could choose to measure engagements by is impressions. While reach measures how many people see your content, impressions tracks how often that content appears on a screen.
- ER impressions = Total engagements on a post / Total impressions *100
- Average ER impressions = Total ER impressions / Total posts
Pros: This formula can be useful if you’re running paid content and need to evaluate effectiveness based on impressions.
Cons: An engagement rate calculated with impressions as the base is bound to be lower than ERR and ER post equations. Like reach, impression figures can also be inconsistent. It may be a good idea to use this method in conjunction with reach.
Read more about the difference between reach and impressions.
4. Daily engagement rate (Daily ER)
While engagement rate by reach measures engagement against maximum exposure, it’s still good to have a sense of how often your followers are engaging with your account on a daily basis.
- Daily ER = Total engagements in a day / Total followers *100
- Average Daily ER = Total engagements for X days / (X days *followers) *100
Pros: This formula is a good way to gauge how often your followers interact with your account on a daily basis, rather than how they interact with a specific post. As a result, it takes engagements on new and old posts into equation.
This formula can also be tailored for specific use cases. For instance, if your brand only wants to measure daily comments, you can adjust “total engagements” accordingly.
Cons: There’s a fair amount of room for error with this method. For instance, the formula doesn’t account for the fact that the same follower may engage 10 times in a day, versus 10 followers engaging once.
Daily engagements can also vary for a number of reasons, including how many posts you share. For that reason it may be worthwhile to plot daily engagement versus number of posts.
5. Engagement rate by views (ER views)
If video is a primary vertical for your brand, you’ll likely want to know how many people choose to engage with your videos after watching them.
- ER view = Total engagements on video post / Total video views *100
- Average ER view = Total ER view / Total posts
Pros: If one of your video’s objectives is to generate engagement, this can be a good way to track it.
Cons: View tallies often include repeat views from a single user (non-unique views). While that viewer may watch the video multiple times, they may not necessarily engage multiple times.
6. Factored Engagement Rate
In rare cases some marketers use a “factored engagement rate.” As the name suggests, factored engagement rates add more or less weight to certain factors in the equation.
For example, a marketer may wish to place a higher value on comments versus likes, weighting each comment as two versus one. The subsequent equation would look something like this:
- Comment-weighted ER = (Total comments x 2) + all other engagements / Reach per post *100
Obviously, this technique inflates the resulting engagement rate and can be misleading, especially since the use of factored engagement rates is not widespread. For this reason, Hootsuite does not recommend its use.
https://blog.hootsuite.com/calculate-engagement-rate/
Leave a Reply