Environment and Cancer [11.3.4]
Larry H. Bernstein, MD, FCAP, Writer and Curator
http://pharmaceuticalintelligence.com/2015/05/06/lhbern/Environment-and-Cancer
Environment and Cancer
This series is about the natural and acquired cancer risks from natural and human causes.
11.3.4.1 Lung and Smoking Hazards
11.3.4.2 Cancer and Air Quality
11.3.4.3 Cancer and Water Quality
11.3.4.4 Cancer and Radiation
11.3.4.4.1 Atomic Radiation
11.3.4.4.2 Cancer, Solar and Medical Radiation
11.4.5 Occupational Hazards
11.4.5.1 Mining
11.4.5.2 Petroleum Extraction
11.3.4.1 Lung and Smoking Hazards
Smoking and cancer
David Carbone
Amer J Med July 15, 1992; 93(1), Suppl 1: S13–S17
http://dx.doi.org/10.1016/0002-9343(92)90621-H
An extensive body of epidemiologic data has linked cigarette smoking to a wide variety of neoplastic diseases. Smokers have been found to incur an increased relative risk of mortality from cancer of the lung, head and neck, urinary tract, pancreas, and bladder. Recent work has also implicated smoking in the risk of leukemia and myeloma. The magnitude of these risks has prompted research aimed at identifying the carcinogens involved in specific smoking-related neoplasms, as well as potential genetic predispositions to the effects of these toxins. Mutations in tumor suppressor genes have been identified in both small-cell and non-small-cell lung cancer, and mutations in dominant oncogenes have been noted in the latter disease. A growing understanding of the molecular genetics of smoking-related cancers may translate into improved diagnosis and treatment. Detection of mutations in oncogenes or tumor suppressor genes in premalignant tissues might facilitate identification of individuals who have a hereditary predisposition to smoking-related carcinomas.
Harms of Cigarette Smoking and Health Benefits of Quitting
http://www.cancer.gov/cancertopics/causes-prevention/
risk/tobacco/cessation-fact-sheet
Key Points
- Tobacco smoke is harmful to smokers and nonsmokers.
- Smoking causes many types of cancer, including cancers of the lung, esophagus, larynx (voice box), mouth, throat, kidney, bladder, liver, pancreas, stomach, cervix, colon, and rectum, as well as acute myeloid leukemia.
- Quitting smoking reduces the health risks caused by exposure to tobacco smoke.
Among the 250 known harmful chemicals in tobacco smoke, at least 69 can cause cancer. These cancer-causing chemicals include the following (1, 2, 5):
- Acetaldehyde
- Aromatic amines
- Arsenic
- Benzene
- Benzo[α]pyrene
- Beryllium (a toxic metal)
- 1,3–Butadiene (a hazardous gas)
- Cadmium(a toxic metal)
- Chromium (a metallic element)
- Cumene
- Ethylene oxide
- Formaldehyde
- Nickel (a metallic element)
- Polonium-210 (a radioactive chemical element)
- Polycyclic aromatic hydrocarbons(PAHs)
- Tobacco-specific nitrosamines
- Vinyl chloride
Smoking is a leading cause of cancer and death from cancer. It causes cancers of the lung, esophagus, larynx, mouth, throat, kidney, bladder, liver, pancreas, stomach, cervix, colon, and rectum, as well as acute myeloid leukemia (1–3).
Smoking causes heart disease, stroke, aortic aneurysm (a balloon-like bulge in an artery in the chest), chronic obstructive pulmonary disease (COPD) (chronic bronchitis and emphysema),diabetes, osteoporosis, rheumatoid arthritis, age-related macular degeneration, and cataracts, and worsens asthma symptoms in adults. Smokers are at higher risk of developing pneumonia, tuberculosis, and other airway infections (1–3). In addition, smoking causes inflammation and impairs immune function (1).
Since the 1960s, a smoker’s risk of developing lung cancer or COPD has actually increased compared with nonsmokers, even though the number of cigarettes consumed per smoker has decreased (1). There have also been changes in the type of lung cancer smokers develop – a decline in squamous cell carcinomas but a dramatic increase in adenocarcinomas. Both of these effects may be due to changes in the formulation of cigarettes (1).
Approximately 7,300 lung cancer deaths occur each year among adult nonsmokers in the United States as a result of exposure to secondhand smoke (1). The U.S. Surgeon General estimates that living with a smoker increases a nonsmoker’s chances of developing lung cancer by 20 to 30 percent (4).
Nicotine is a drug that is naturally present in the tobacco plant and is primarily responsible for a person’s addiction to tobacco products, including cigarettes. The addiction to cigarettes and other tobacco products that nicotine causes is similar to the addiction produced by using drugs such as heroin and cocaine (11).
All forms of tobacco are harmful and addictive (4, 9). There is no safe tobacco product.
In addition to cigarettes and cigars, other forms of tobacco include smokeless tobacco (also called chewing tobacco, snuff, and snus), pipes, hookahs (waterpipes), bidis, and kreteks.
Smoking-Related ‘‘Interstitial’’ Lung Disease
Teri J. Franks, Jeffrey R. Galvin
Arch Pathol Lab Med. May 2015
http://dx.doi.org:/10.5858/arpa.2013-0384-RA
—Emphysema, respiratory bronchiolitis, desquamative interstitial pneumonia, pulmonary Langerhans’ cell histiocytosis, small-airway injury including submucosal and adventitial fibrosis, increased bronchus-associated lymphoid tissue, and small artery/arteriolar wall thickening are recognized histologic findings in cigarette smokers. It has only recently been acknowledged that the range of lung injury from cigarette smoke is wider than generally accepted, in particular, there is increasing recognition that fibrosis of alveolar walls occurs in smokers. Objectives.—To review the literature that describes the range of histologic findings in cigarette smokers and that links cigarette smoke exposure to the development of alveolar wall fibrosis. Data Sources.—Relevant peer-reviewed literature indexed in PubMed (National Library of Medicine) form the basis of this review. Conclusions.—Smokers demonstrate a wide range of lung injury at biopsy that defies simple placement within single categories, and the current categories do not adequately take into account the importance of alveolar wall and airway fibrosis.
Human lung tissue responds to injury with a combination of destruction, remodeling, and repair that is manifest by airspace enlargement and laying down of collagen and elastin.1,2 The process of remodeling and repair has been well documented as a response to the inflammation and destruction from cigarette smoke that involves all compartments of the respiratory system from the conducting airways to the alveolar walls.3 The inflammation, destruction, remodeling, and repair from inhaled cigarette smoke are reflected radiologically and histologically as a variety of airway and parenchymal alterations. These alterations have been described over decades as separate diseases, including emphysema,4 respiratory bronchiolitis,3 respiratory bronchiolitis–interstitial lung disease,5 desquamative interstitial pneumonia,6 and pulmonary Langerhans’ cell histiocytosis.7 Small-airway injury, including submucosal and adventitial fibrosis, remodeling evidenced by distortion, and increased bronchus-associated lymphoid tissue,8,9 along with thickening of walls of small arteries and arterioles,9–11 are well-recognized histologic findings in cigarette smokers.
It has only recently been acknowledged that the range of lung injury from cigarette smoke is wider than generally accepted,12 in particular, there is increasing recognition that fibrosis of alveolar walls occurs in smokers. As a result, lesions called combined pulmonary fibrosis and emphysema,13 respiratory bronchiolitis–interstitial lung disease with fibrosis,14 airspace enlargement with fibrosis,15 and clinically occult smoking-related interstitial fibrosis16 have been added to our lexicon of smoking-related lung injury, again as separate entities. That alveolar wall fibrosis occurs in smokers should not be a surprise. There is long-standing evidence that fibrosis of alveolar walls is related to cigarette smoke exposure. This has been documented in animal17–20 and human10,21–24 studies. Collectively, these studies demonstrate not only that cigarette smoke causes alveolar wall fibrosis as evidenced by increased elastic and collagen content, but also that fibrosis increases with time and intensity of exposure. From the study of Auerbach et al10 in 1963, to the article by Katzenstein et al16 in 2010, there are at least 5 decades of studies providing evidence that links cigarette smoke exposure to the development of alveolar wall fibrosis.
As described and referenced in the preceding paragraphs, the histologic appearance of lung injury secondary to cigarette smoke is a constellation of findings that includes smokers’ macrophages within airspaces, which may be airway centered (respiratory bronchiolitis) or diffuse (desquamative interstitial pneumonia) in distribution; emphysema; small-airway injury evidenced by submucosal and adventitial fibrosis, remodeling that results in distortion, and increased bronchus-associated lymphoid tissue; thickening of walls of small arteries and arterioles; stellate cellular and/ or fibrotic lesions of pulmonary Langerhans’ cell histiocytosis; and alveolar wall fibrosis (Figure, c through g). Currently, we attempt to package this array of findings into separate categories for diagnosis.30 However, Hansell and Nicholson12 emphasize the frequent coexistence of smoking-related lung diseases, and in practice, open lung biopsies from smokers more often than not display a combination of histologic findings that cross the boundaries of our established diagnostic categories. The terms smokingrelated interstitial lung disease and smoking-related interstitial pneumonia are used in an attempt to bring together coexisting histologic findings into a single diagnosis.30
Air pollution and lung cancer: what more do we need to know?
A J Cohen
Thorax 2003; 58:1010-1012
http://dx.doi.org:/10.1136/thorax.58.12.1010
Lung cancer accounts for 1.2 million deaths yearly worldwide, exceeding mortality from any other cancer in the developed countries.1 The vast majority are caused by tobacco smoking, but environmental causes of cancer, including air pollution, have long been a concern also.2Outdoor air pollution has received particular attention lately as research has proliferated linking exposure, even at low ambient levels, to a wide range of adverse health effects including increased mortality and morbidity from non-malignant cardiovascular and respiratory disease and lung cancer. In response, international agencies such as the World Health Organization and governments in Europe, the US and Canada have reviewed existing air quality standards and, in many cases, moved to strengthen them. In the developed countries, where air quality has generally improved in recent decades, the scientific basis and public health efficacy of these actions have been questioned by industries whose emissions are regulated and others. In this context, reports linking air pollution and lung cancer are likely to attract attention and generate controversy. The publication of the paper by Nafstad and colleagues in this issue of Thorax is an occasion to consider both the contribution of this study to the evidence linking air pollution and lung cancer and what additional research may be needed.3
Exposure to outdoor air pollution has been associated with small relative increases in lung cancer in studies conducted over the past four decades.4 The epidemic of lung cancer emerging in the 1950s in the US and Europe motivated early research on the role of air pollution, including studies of migrants and urban-rural comparisons but, as the role of cigarette smoking became increasingly clear, interest in air pollution waned. However, recent prospective cohort and case-control studies which have taken into account tobacco smoking, as well as occupational and other risk factors, have continued to report increases in lung cancer associated with air pollution.5–7 The American Cancer Society (ACS) study, which included 10 749 lung cancer deaths, reported that each 10 μg/m3 increment of fine particles (PM2.5) was associated with an 8–14% increase in lung cancer.7 A causal interpretation is buttressed by other evidence. Urban air contains known and suspected human carcinogens such as benzo[α]pyrene, benzene, and 1,3-butadiene, together with carbon based particles onto which carcinogens may be adsorbed, oxidants such as ozone and nitrogen dioxide, and oxides of sulphur and nitrogen in particle form. Increased lung cancer has also been reported among workers occupationally exposed to components of urban air pollution such as polycyclic aromatic hydrocarbons and diesel exhaust.8,9
In light of this evidence, the question is arguably not “Does air pollution cause some lung cancers?”, but rather “How many excess cases is it likely to cause?”. The answer to this question, and another—“Which pollutants, emitted by which sources, may be responsible?”—can potentially inform regulatory action to improve air quality and public health.
The current evidence suggests that lung cancer attributable to air pollution may occur among both smokers and non-smokers, and therefore both residual confounding and effect modification of the air pollution relative risk due to cigarette smoking must be considered. Nafstad et al3report the relative risks of air pollution adjusted for cigarette smoking, but adjustment may not have controlled completely for potential confounding. The authors acknowledge that their study, like most other cohort studies, has information on cigarette smoking only at the beginning of the follow up period. The possibility that changes in tobacco use are correlated with exposure is difficult to rule out, although the association of lung cancer with air pollution was largely unaffected in the Six Cities study5 when longitudinal information on cigarette smoking was used in a recent reanalysis,10 and several case-control studies have found an increased risk following adjustment using time varying information.6 Several studies, including the one reported here by Nafstad et al, show an increased risk of lung cancer among self-reported never smokers, but the numbers in any single study are very small and the estimates imprecise. This also complicates efforts to estimate the numbers of cases in which both air pollution and smoking play a role. A study that includes large numbers of well documented never smokers may be the only approach that could address these concerns, if feasible.
Past approaches to exposure measurement also contribute to uncertainty in risk estimates. The ACS and Six Cities studies estimated the exposure of each participant based solely on long term average concentrations in their metropolitan area of residence. This approach may accurately reflect exposure to pollutants distributed homogenously over large areas for several decades but, if exposure at finer spatial and temporal scales is important, the estimates of relative risk may be inaccurate. Newer European and North American studies have begun to use spatial statistical methods to estimate individual long term exposure histories, linking residential histories, measurements of traffic density on nearby streets, and long term records of specific air pollutants, and can estimate how the size of the relative risk varies in time and space.6,11,12 Hoek et al11 observed larger relative effects on mortality from cardiopulmonary diseases as a result of air pollution near to major roads than from larger scale urban and regional air pollution, and Nyberg et al6 estimated the highest relative risks of lung cancer for exposure 20 years or more before diagnosis. By providing exposure estimates at the individual level, these studies also reduce the possibility of aggregate level (ecological) bias.10,13
The effect of air pollution on lung cancer, fully manifest only decades after exposure, is a moving target. The emergence of cars and trucks as dominant modes of transportation and the decline in heavy industrial manufacturing in some developed countries since the mid 20th century, combined with effective air quality regulations, have changed both the nature of urban air pollution and patterns of human exposure. Over the time course of many recent lung cancer studies, decreases in larger respirable and fine particles as well as some gaseous pollutants and carcinogens have been documented,7 although concentrations of the fine, and arguably more toxic, particles may have declined to a lesser extent than other pollutants,5 increased in some locations,14 or changed their spatial distributions. Epidemiologists must rely on whatever components of the air pollution mix have been measured over extended periods, and consequently have reported associations of lung cancer with long term exposure to particles, ozone, sulphur dioxide, and nitrogen dioxide, but not known carcinogens. No mechanisms by which these pollutants per se cause cancer have been identified, and although some cancer biomarkers have been associated with air pollution exposure in non-smokers, they have not been used in large studies designed to estimate lung cancer risk. Nafstad et al3 and Nyberg et al6 used ambient concentrations of nitrogen dioxide and sulphur dioxide as surrogates for air pollution from mobile sources and residential heating, respectively. Each observed an increased risk of lung cancer associated with the nitrogen dioxide based indicator but not with the sulphur dioxide based indicator, but neither of these pollutants is specific to either source. As technological improvements and regulatory efforts continue to change the nature of air pollution, estimating current and future impacts on lung cancer will remain a challenge.
Exposure to air pollution is estimated to contribute to 62 000 lung cancer deaths per year worldwide—a large number of deaths, to be sure, but considerably less than the 712 000 deaths from non-malignant cardiac and respiratory disease attributable to air pollution.15 These impacts are largely borne by the populations of highly polluted cities in developing countries—roughly 60% of the world’s burden of air pollution attributed disease. In Chinese cities, where air pollution levels are many times greater than those in the cities of the developed West, outdoor air pollution may contribute to as much as 10% of lung cancer overall, and perhaps a larger proportion in non-smoking women. Unfortunately, because there is a lack of suitable studies in developing countries, these estimates are based on extrapolating the relative risk estimates from the ACS study to China, India, and other settings where differences in health status and the air pollution mixture introduce large uncertainties.
Opportunities to strengthen the scientific evidence on air pollution and lung cancer should be pursued, including in developing countries where the estimated health impact of air pollution and the need for accurate risk estimates are greatest. Studies should be designed to address, in addition to lung cancer, other arguably more important knowledge gaps such as the effect of long term exposure on the incidence of chronic non-malignant cardiorespiratory disease. Beginning large studies de novo would entail major financial and opportunity costs, so identifying existing cohorts, especially those with large numbers of non-smokers and for whom biological samples have been stored, may be the best option. Studies of outdoor air pollution and lung cancer in developing countries will need to account for past or concurrent exposures to indoor air pollution, particularly from use of coal for cooking and heating, a major cause of lung cancer in poor rural women in China and elsewhere,16 and changing patterns of tobacco smoking.
11.3.4.3 Cancer and Water Quality
Water Pollution and Digestive Cancers in China (2008)
Avraham Y. Ebenstein
https://www.researchgate.net/profile/Ann_Harrison/publication/228807097_Water_Pollution_and_Digestive_Cancers_in_China/links/00b7d5298fede97c5a000000.pdf
Following China’s economic reforms of the late 1970s, rapid industrialization has led to a deterioration of water quality in the country’s lakes and rivers. China’s cancer rate has also increased in recent years, and digestive cancers (i.e. stomach, liver, esophageal) now account for 11 percent of fatalities (WHO 2002) and nearly one million deaths annually. This paper examines a potential causal link between surface water quality and digestive cancers by exploiting variation in water quality across China’s river basins. Using a sample of 145
mortality registration points in China, and using OLS that a deterioration of the water quality by a single grade (on a six-grade scale) is associated with a 9.3 percent increase in the death rate due to digestive cancer, controlling for observable characteristics of the Disease Surveillance Points (DSP). The analysis rules out other potential explanations for the observed correlation, such as smoking rates, dietary patterns, and air pollution. This link is also robust to estimation using 2SLS with rainfall and upstream manufacturing as instruments. As a consequence of the large observed relationship between digestive cancer rates and water pollution, I examine the benefits and costs of increasing China’s levy rates for rm dumping of untreated wastewater. My estimates indicate that doubling China’s current levies would save roughly 29,000 lives per year, but require an additional 500 million dollars in annual spending on wastewater treatment by rms, implying a cost of roughly 18,000 dollars per averted death.
During the 1980s and 1990s, China’s rapid economic growth transformed the country and lifted millions of its citizens out of poverty. The economic boom, however, has been accompanied by environmental side effects, including a severe deterioration in the water quality of the country’s rivers and lakes. Extensive use of fertilizers by farmers and industrial wastewater dumping by manufacturing rms have rendered the water in many lakes and rivers unt for human consumption. China’s water monitoring system indicates that roughly 70% of the river water is unsafe for human consumption, although many farmers in rural areas still rely on these sources for drinking water (World Bank 2006).
Concurrent with the decline in water quality in China’s lakes and rivers, the country has witnessed an increase in rural cancer rates during the 1990s (see Figure 1). Stomach cancer and liver cancer now represent China’s 4th and 6th leading causes of death, and in combination with other digestive tract cancers (e.g. esophageal) account for 11% of all fatalities and nearly one million deaths annually (World Health Organization 2002). Several media outlets have reported incidents of contaminated river water from industrial activity leading to outbreaks of cancer in rural villages in China (New York Times 2007, British Broadcasting Corporation 2007), but systematic analysis of these trends is lacking. Researchers have found connections between water quality and acute water-borne diseases such as typhoid (Cutler and Miller 2005) and diarrhea (Jalan and Ravalion 2003), and access to cleaner water may lower infant mortality (Galiani et al. 2005). The connection between water quality and cancer, however, has not been fully explored. A limited literature has linked water pollution to particular cancer types such as liver cancer (Lin et al. 2000, Davis and Masten 2004) or gastric cancer (Morales-Suarez-Varela et al. 1995). However, as described by Cantor (1997), the literature is incomplete regarding the causal link between water contaminants and cancer: The epidemiologic data are not yet sufficient to draw a conclusion.
In light of the potentially large health consequences of China’s water pollution, I present an analysis of the benefits and costs of wastewater treatment in China. Industrial firms in China are subject to a system of levies for wastewater that fails to meet discharge standards, and I exploit regional variation in the policy’s effective levy rate (yuan collected per ton discharged) to estimate the potential impact of revisions to China’s current rates. Using provincial data from China’s environmental yearbooks (1992-2002), I estimate that industrial cleanup (in tons) rises by 0.82 percent and spending on wastewater treatment (in yuan) rises by 0.14 percent with respect to a 1 percent increase in the effective levy rate. These estimates imply that a doubling of China’s levy rates would avert roughly 29,000 deaths per year, but require firms to spend roughly $500 million6 more per year on treatment, yielding a cost per averted death of roughly $18,000. These estimates imply that a doubling of China’s levy rates would avert roughly 29,000 deaths per year, but require firms to spend roughly $500 million6 more per year on treatment, yielding a cost per averted death of roughly $18,000.
The pollution levels in China’s water bodies are almost without historical precedent, and in spite of recent efforts to reduce water dumping by manufacturing firms, roughly 70% of China’s surface water was found unfit for human use (World Bank 2006). In this section, I provide background information on environmental factors that affect water quality, geographic variation in these factors, and the variation in water quality that the analysis exploits to estimate its effect on digestive cancer rates. Water pollution is classified as either point source or non-point source pollution. Point source pollution is wastewater from domestic sewage and industrial wastes that is discharged from a single point. Nonpoint source pollution, such as urban and agricultural runoff, enters rivers and lakes at multiple points. China’s experience following industrialization has led to the increase in both: farmers have attempted to increase yields through widespread fertilizer use (non-point source), and manufacturing firms have dumped inorganic compounds into water as part of their production processes. When these chemicals drain into waterways, they stimulate a river’s algal growth beyond its natural speed in a process known as eutrophication. The water becomes populated by cyanobacteria (blue-green algae) which leads to the formation of microcystins (Davis and Masten 2004). These compounds in particular are thought to be carcinogenic, and have been linked directly to liver cancer (Codd 2000). 5
The deterioration of China’s rivers and lakes over the past decades has been regionally bound, with water quality in northern regions declining more severely due to lower levels of precipitation. The rainy season may last as long as six to seven months in some southern areas and be as short as two or three months in more arid northern regions (World Bank 2006). As such, northern river systems have a lower capacity to absorb contaminants. In a thorough review of monitoring data for 1991-2005, the World Bank (2006) reported that 40 to 60 percent of the northern region’s water is continuously in the non-functional water classification categories (grade V and VI), and therefore unfit even for agricultural use. The Huai river basin, located in northern China, is the most polluted basin in the country with 57% of monitored sections failing to meet Grade V, and therefore far below drinkable standards. The Yangtze river basin, however, has exhibited a far smaller deterioration in water quality, in spite of industrialization. Regional differences in water quality induced by rainfall patterns provide for observation of areas of China with similar levels of industrialization, but different levels of pollution. In China, the degradation of waterways has also led areas without industrial activity to experience a decline in water quality. Within a watershed, downstream river segments are contaminated by upstream sources of wastewater and this was the case in a famous episode in Anhui, which has very low industrial activity of its own but is downstream of a major industrial zone located in the Huai river basin. According to Elizabeth Economy in her book The River Runs Black (2004), Heavy rain flooded the [Huai] river’s tributaries, flushing more than 38 billion gallons of highly polluted water into the Huai. Downstream, in Anhui Province, the river water was thick with garbage, yellow foam, and dead fish. In this way, regions downstream of industrial firms suffer from the same, or more serious, water pollution as those directly engaged in wastewater discharge and in these rural areas the inhabitants have experienced the environmental costs of industrialization without realizing the economic benets.7
China’s environmental conditions have continued to worsen in spite of long-running regulatory efforts to punish firms for dumping untreated wastewater. In 1982, China established a nationwide system of fine levies assessed on the tonnage of untreated wastewater emitted by factories. By 1998, Chinese regulators had collected about 40 billion RMB yuan ($4.9 billion) in levies, with both private and state-owned enterprises being subject to the policy (Wang and Wheeler 2005). Though China’s environmental regulatory agencies have gained increasing clout in administrative decisions nationally, incentive conflicts with local administrators who rely primarily on local industries for tax revenue have limited the effectiveness of the program (Ma and Ortolano 2000).
I consider whether the OLS results could be explained by unobserved correlation between water quality and other potential risk factors for digestive cancer, such as smoking rates and dietary patterns. Using province-level information on smoking rates and dietary practices from household survey data (China Household Income Survey 1995, China Health and Nutrition Survey 1989-2006), I examine whether either smoking or diet patterns covary with water quality. The results indicate that smoking rates are similar across the water quality readings, suggesting that the estimated impact of water quality is not being confounded by smoking patterns.12 Likewise, no large difference in diet is observed across sites with better and worse quality, suggesting that regional differences in diet are not responsible for the correlation between water quality and digestive cancer. So, although diet is a known risk factor for digestive cancers, it is uncorrelated with water quality and is therefore unlikely to be biasing the estimated effect of water quality on cancer.
Although dietary patterns in China are known to vary by region, it is unlikely to explain the patterns in cancer mortality I observe in the data, which reflect high digestive cancer rates among northern areas with lower rainfall (and consequently worse surface water quality). First, while salty and pickled foods are thought to be associated with higher digestive cancer rates (Kono and Hirohata 1996), southern China is not very different than northern China in this dietary dimension. In fact, the principal difference between northern and southern China in terms of diet is the South’s ‘rice culture’ versus the northern ‘wheat culture’. Carbohydrates are thought to be a risk factor for Asian men with high rates of this disease (Ji et al. 1998) but inhabitants of both regions consume large amounts of carbohydrates. Since regional differences in diet are not thought to be risk factors for digestive cancer, it is unlikely that unobserved differences in diet are confounding the regression.
In order to assess the cost of improving China’s water, in this section I examine the relationship between China’s surface water quality and industrial dumping, and the relationship between industrial dumping and the levy rates for wastewater discharge.15 In combination with estimates of the cost of complying with higher levy rates, this provides the necessary parameters to estimate the cost of averting a death through an increase in the levy rates.16
I examine the relationship between industrial dumping and water grade, using provincial measures of dumping by chemical and the average monthly rainfall in the province. For each measure of water pollution reported by China’s National Monitoring Center (2004), I examine its relationship with provincial measures of industrial wastewater dumping that are available by chemical. The water quality measures are averaged by province across the monitoring points and merged with industrial wastewater dumping data from the China Environmental Yearbook (2005). Dumping by chemical is available for nearly 500,000 manufacturing firms, which covers the vast majority of industrial production in China.
The relationship between the overall water grade and the total dumping of untreated wastewater, which indicates that an increase in dumping by 10% would induce a .039 unit increase in water grade, and the result is statistically significant at the 1% level. Each additional millimeter of monthly rainfall is associated with a water grade that is -.021 lower, consistent with a prior that rainfall mitigates the impact of industrial dumping on surface water quality. Water quality responds to the amount of dumping of a particular chemical. Measures of water quality can be linked to particular forms of pollution. For example, the ammonia nitrogen content in the surface water is .015 units higher for each 10% increase in the reported tonnage of dumping. Similar results are presented linking the other chemical dumping measures with the most closely linked measure of observed toxins in the water (grade). Though these estimates are based on limited data, they provide a benchmark for examining the potential benefit of reducing the dumping of untreated wastewater, and the importance of increasing enforcement in China’s industrial zones in the northern arid parts of the country, which are also densely populated.
The preceding analysis to calculate the anticipated savings (in lives) of raising China’s levy rate, and the compliance costs required of firms in wastewater treatment spending. A full 100% increase in China’s levy rate is predicted to reduce untreated dumping by 82%, which in turn improves the water grade by 39% (from Table 8) of 82%, yielding a predicted improvement in water quality of .29 units (.82*.39). In the preferred OLS specification in Table 3, each unit decrease in water grade is associated with roughly 9.3% fewer deaths due to digestive cancer, or roughly 93,000 deaths due to digestive cancer. Since water quality is expected to improve by .29 units, the proposed levy increase would avert roughly 29,000 deaths. In terms of the anticipated compliance costs, I estimate that China’s firms would need to increase spending on wastewater treatment by 14% from the level reported in 2001 of 29 billion yuan, or roughly $3.7 billion on wastewater treatment, which implies an anticipated extra $500 million in compliance costs.18 This implies a cost per death averted of roughly $18,000 ($500 million/29,000 deaths averted). Since each digestive cancer death imposes a cost of slightly more than 20 years in life expectancy (20.12), this amounts to a cost of roughly $900 per year.19
Despite an increase in clean-up efforts in recent years, the overall degradation of China’s waterways continues. While the capacity of wastewater treatment facilities has grown, it has not kept pace with the growth of industrial output. The pollution intensity of China’s industrial firms has declined (discharge per yuan of output), but the tonnage of water dumping has continued to increase (World Bank 2007).
National Primary Drinking Water Regulations
http://water.epa.gov/drink/contaminants/
National Primary Drinking Water Regulations (NPDWRs or primary standards) are legally enforceable standards that apply to public water systems. Primary standards protect public health by limiting the levels of contaminants in drinking water. Visit the list of regulated contaminants with links for more details.
- List of Contaminants and their Maximum Contaminant Levels (MCLs)
- Regulation Development
- EPA’s Regulated Contaminant Timeline (PDF) (1 pp, 86 K ) (About PDF)
- National Primary Drinking Water Regulations– The complete regulations regarding these contaminants is available from the Code of Federal Regulations Website
List of Contaminants and their (MCLs)
An alphabetical listing with links to fact sheets on the primary drinking water regulations.
- Microorganisms
- Disinfectants
- Disinfection Byproducts
- Inorganic Chemicals
- Organic Chemicals
- Radionuclides
Drinking water and cancer.
R D Morris
Environ Health Perspect. 1995 Nov; 103(Suppl 8): 225–231.
http://www.ncbi.nlm.nih.gov/pmc/articles/PMC1518976/
Any and all chemicals generated by human activity can and will find their way into water supplies. The types and quantities of carcinogens present in drinking water at the point of consumption will differ depending on whether they result from contamination of the source water, arise as a consequence of treatment processes, or enter as the water is conveyed to the user. Source-water contaminants of concern include arsenic, asbestos, radon, agricultural chemicals, and hazardous waste. Of these, the strongest evidence for a cancer risk involves arsenic, which is linked to cancers of the liver, lung, bladder, and kidney. The use of chlorine for water treatment to reduce the risk of infectious disease may account for a substantial portion of the cancer risk associated with drinking water. The by-products of chlorination are associated with increased risk of bladder and rectal cancer, possibly accounting for 5000 cases of bladder cancer and 8000 cases of rectal cancer per year in the United States. Fluoridation of water has received great scrutiny but appears to pose little or no cancer risk. Further research is needed to identify and quantify risks posed by contaminants from drinking-water distribution pipes, linings, joints, and fixtures and by biologically active micropollutants, such as microbial agents. We need more cost-effective methods for monitoring drinking-water quality and further research on interventions to minimize cancer risks from drinking water.
Except for naturally occurring minerals such as calcium carbonate, contaminants that enter the water supply through the source water generally occur at low concentration levels. Source-water contaminants of concern either are sufficiently potent carcinogens to pose risks at extremely low concentrations or cause local contamination at high concentrations. The source-water contaminants that have been the focus of concern among those individuals investigating environmental cancer risks include arsenic, asbestos, radon, agricultural chemicals, and hazardous waste. Some of the strongest evidence for a cancer risk associated with source-water contamination involves arsenic. Epidemiologic studies from Taiwan have suggested that arsenic in drinking water poses substantial risks of liver, lung, bladder, and kidney cancer as listed in Table 1 (1,2). Although toxicologic studies do not provide unequivocal evidence of carcinogenicity (3), occupational studies, as well as other epidemiologic studies, support the findings of the Taiwanese studies(4). Estimates of attributable risk based on the data in Table 1 suggest that an average level of arsenic 2.5 pg/l in drinking water in the United States of causes approximately 3000 cases of cancer per year (4).
Farm runoff containing agricultural chemicals and manure may lead to local or regional contamination of source waters with insecticides, fungicide, rodenticides, herbicides, and fertilizers, which contain phosphorous and nitrogen. Although some pesticides are carcinogens, drinking-water contamination resulting from their agricultural application has not been directly associated with cancer in epidemiologic studies. Emerging evidence, however, indicates that fertilizers may pose cancer risks.
Studies in China among populations exposed to high levels of nitrates in drinking water have suggested links between nitrate contamination and stomach and liver cancer (10). In these studies, the histology of the gastric lesions has been linked to the level of nitrates in the water (11) and cancer rates increased with the in vitro mutagenicity of the drinking water (12). Nitrates may act as carcinogens through the formation of N-nitroso compounds (13). When human volunteers were given proline, which is a secondary amine, those participants in areas with higher levels of nitrate in their drinking water had higher levels of N-nitrosoproline in their urine than volunteers residing in places with low nitrate levels in their drinking water (14). Although an epidemiological study in France failed to demonstrate an association between nitrates in drinking water and cancer (15), current evidence is sufficient to warrant further study of this potential carcinogen.
Halogenated organic compounds, particularly chloroform, were identified in chlorinated drinking water (22). A subsequent survey of water supplies showed that these compounds were common in water supplies throughout the United States and that concentrations were far higher in treated surface water than in treated groundwater (23). With these revelations came a shift in the basis of our definition of cleanliness in drinking water. New concerns about cancer risks associated with chemical contamination from chlorination by-products have given rise to 25 epidemiologic studies. Table 2 summarizes the results of a metaanalysis of the cohort and case-control studies that have been conducted to evaluate the association between consumption of chlorinated drinking water and cancer at various sites (24). For each cancer site, the pooled results from available studies show elevations in risk, and the risk estimates achieved statistical significance for bladder and rectal cancer. Further analyses in this study suggested that risks increased with increasing exposure and that improvements in exposure assessment yielded higher estimates of risk. Confounding could conceivably explain the observed pattern of association, but stratification into studies that adjusted or did not adjust for confounders does not support such an assertion. Studies that adjusted for population density, smoking, or occupation, did not demonstrate a difference in relative risk estimates.
One focus of current concerns about the potential for micropollutants to cause cancer involves those compounds that mimic naturally occurring, biologically active compounds. Biologically active micropollutants or endocrine disrupters appear to have the ability to disturb normal intercellular communications. For example, evidence from wildlife biologists, toxicologists, endocrinologists, and epidemiologists demonstrate the potential for estrogenic effects of environmental contaminants among humans (39,40). Metabolites of DDT are estrogenic in vivo and have been associated with the development of breast cancer in epidemiologic studies (41,42). Nonyl-phenol, a common chemical surfactant, increases proliferation in breast tumor cell cultures (43). The potential risks from drinking-water contaminants acting through these mechanisms have not been evaluated. Because of the complex mixture of contaminants, examining cancer risks for each individual compound may not give a complete picture of cancer risks associated with drinking water. An alternative approach is to look at the geographic distribution of neoplasms that might be associated with drinking water. These include cancer of the gastrointestinal tract and bladder cancer (i.e., neoplasms of the mucosal epithelium). Figure 1 provides maps showing clustering of the incidence of site-specific neoplasms among the elderly. By ranking the incidence of the neoplasms of the mucosal epithelium and combining those ranks, we can see where this group of neoplasms might be elevated. A map of the clustering of elevated cancer rates is shown in Figure 2. This map indicates a significant elevation of these cancers in the northeastern United States. To draw conclusions about the link between the geographic distribution and drinking water would, of course, be premature, but any effort to explain this pattern should consider drinking-water contamination to be a possible contributing factor.
The cancer risks associated with the major contaminants of drinking water are listed in Table 3. The weight of the evidence suggests that chlorination by-products pose substantial cancer risks that should be reduced. A growing body of evidence supports the possibility that arsenic in drinking water may also carry unacceptable cancer risks. The cancer risks from radon and asbestos in drinking water are less substantial but may require remediation where local conditions dictate. The available evidence does not support assertions of cancer risks associated with fluoridation of drinking water. For most other compounds present in drinking water, the attributable cancer risks are not clear. Hazardous waste and pesticides may contaminate waters locally and regionally, but the attributable cancer risk is difficult to quantify. Nitrates are more widespread contaminants and more closely linked to human cancer, but evidence is incomplete. Contamination during drinking-water distribution may pose cancer risks, but the epidemiologic evidence is extremely limited. Less conventional cancer risk factors, such as biologically active micro pollutants and pathogens, only present the possibility of risk at present but may emerge as important carcinogens in the future.
The consequences of a lack of vigilance with respect to emerging threats in drinking water were felt with devastating impact in Milwaukee, Wisconsin, in 1993, when 400,000 people fell ill during a waterborne outbreak of cryptosporidiosis (47). We should view this as a warning and an opportunity for timely intervention to minimize health risks from drinking water.
11.3.4.4 Cancer and Radiation
11.3.4.4.1 Atomic Radiation
History’s Worst Nuclear Disasters
By Jennie Cohen Mar 18, 2011
http://www.history.com/news/historys-worst-nuclear-disasters
The earthquake that shook Japan on March 11, 2011, stirred up a devastating tsunami that blasted coastal cities with walls of water, shifted the Earth’s axis and has been blamed for thousands of deaths. It also triggered what many are calling the worst disaster of its kind since the incident at Chernobyl, a virtual byword for the risks that come with harnessing nuclear energy. As experts scramble to stem the mounting crisis in Japan, we take a look at four of the most devastating nuclear accidents to date.
Chernobyl (April 26, 1986)
Built in the late 1970s about 65 miles north of Kiev in the Ukraine, the Chernobyl plant was one of the largest and oldest nuclear power plants in the world. The explosion and subsequent meltdown that occurred there in April 1986 would claim thousands of lives, cause countless birth defects and unleash a thyroid cancer epidemic on the region. However, it would take years for the full story behind the catastrophe to emerge. A bungled experiment at one of the facility’s four reactors created a sudden power surge, which in turn led to a series of blasts that blew the 1,000-ton steel top off of the reactor. A lethal cloud of radioactive material gathered over the nearby town of Pripyat—which was not evacuated until 36 hours after the explosion—before wafting over large parts of Europe. Soviet officials tried to keep the disaster under wraps, but on April 28 Swedish radiation monitoring stations located more than 800 miles from Chernobyl reported radiation levels 40 percent higher than normal.
In the opening days of the crisis, 32 people died at Chernobyl and dozens more suffered radiation burns. The radiation that escaped into the atmosphere–equivalent to several times that produced by the atomic bombs dropped on Hiroshima and Nagasaki–contaminated millions of acres of forest and farmland. The full human toll from the calamity is still being tallied, but experts believe that thousands of people died and as many as 70,000 suffered severe poisoning. In addition, a large area of land may not be livable for as much as 150 years, including the 18-mile radius around Chernobyl–home to some 150,000 people who had to be permanently relocated. In 2000, the last working reactors at Chernobyl were shut down and the plant was officially closed.
Kyshtym (September 29, 1957)
In the years following World War II, the Soviet Union constructed dozens of covert facilities—many of them hastily and shoddily built—in an effort to strengthen their nuclear arsenal. One of these, the Mayak nuclear fuel processing plant in the Russian town of Ozyorsk, became the site of a major disaster when the cooling system in a waste storage tank failed, causing the dried radioactive material it contained to overheat and explode. A plume of deadly particles swelled above Ozyorsk and the surrounding region, eventually spanning some 300 square miles. A full week passed before the affected zone’s 10,000 residents were evacuated; because the plant was shrouded in secrecy, they received no explanation for their abrupt and permanent resettlement. By that time, reports had surfaced of mysterious ailments, including people’s skin sloughing off from exposed body parts.
Instead of acknowledging what had happened in the disaster’s aftermath, the Soviet government created the East-Ural Nature Reserve in the contaminated area and prohibited unauthorized access to it. In 1979, the Russian biologist and dissident Zhores Medvedev made waves by exposing the accident’s lasting effects, but it was not until 1990 that reports documenting the event were declassified. According to estimates, 200 people died of cancer because of exposure to radiation, and thousands more may have suffered from related illnesses. The Mayak incident has come to be associated with the nearby town of Kyshtym because Ozyorsk did not appear on any official maps at the time.
Three Mile Island (March 28, 1979)
The most serious nuclear accident in U.S. history took place at the Three Mile Island plant near Harrisburg, Pennsylvania, a brand-new facility lauded for its state-of-the-art design, efficiency and affordability during an era of energy crises. It began when a pressure valve in one of the reactors failed to close, allowing cooling water–contaminated with radiation–to drain into adjoining buildings. Control room operators made critical errors as they struggled to contain the crisis, and by early morning the core had heated to over 4,000 degrees–just 1,000 degrees short of meltdown. As radioactive steam began pouring out of the plant, word of the incident leaked to the outside world. The plant’s parent company downplayed the event, claiming that no radiation had been detected off plant grounds, but within days radiation levels were elevated over a four-county zone. Pennsylvania Governor Richard Thornburgh ordered the evacuation of pregnant women and small children from the area.
On March 31, plant workers were able to address the problems and ended the threat of a meltdown. Although no deaths or injuries were reported, there has been an ongoing controversy over whether the radiation released at Three Mile Island led to increased cancer and infant mortality rates in the region. The incident also eroded the American public’s faith in nuclear power, inspiring many demonstrations, and increased awareness of the need for emergency preparedness at the state and local levels.
Windscale (October 10, 1957)
Designed to produce plutonium and other materials for the country’s burgeoning nuclear weapons program, Britain’s first nuclear reactor, known as Windscale, was built in northwest England in the late 1940s. On October 10, 1957, workers conducting standard maintenance at the massive facility noticed rising temperatures. Upon further inspection, they discovered that the reactor’s uranium-filled graphite core had caught fire. Worse, it had likely been ablaze for two days, releasing dangerous contaminants into the atmosphere. With the reactor on the verge of collapse, plant operators risked their lives to fight the flames with cooling fans, carbon dioxide and water. The fire finally died out on October 12, but by that time a radioactive cloud was already spreading across the United Kingdom and Europe.
While no evacuations occurred, officials prohibited the sale of milk from the affected area for roughly a month. Scientists estimate that, over the long term, radioactive fallout from the Windscale fire may have caused some 240 cases of cancer. An inquiry that began within days of the accident concluded that the blaze had been both avoidable and mishandled. The complete report was suppressed for several decades, however, in part because it may have compromised Britain’s efforts to cooperate with the United States on nuclear weapons development.
There have been more than 20 nuclear and radiation accidents involving fatalities. These involved nuclear power plant accidents, nuclear submarine accidents, radiotherapy accidents and other mishaps.
http://en.wikipedia.org/wiki/List_of_nuclear_and_radiation_accidents_by_death_toll
4,000 fatalities[1][2] – Chernobyl disaster, Ukraine, April 26, 1986. 56 direct deaths (47 accident workers and nine children with thyroid cancer) and it is estimated that there were 4,000 extra cancer deaths among the approximately 600,000 most highly exposed people.[3]
The Fukushima Daiichi nuclear disaster has no confirmed casualties from radiation exposure.
The United Nations Scientific Committee on the Effects of Atomic Radiation (UNSCEAR), released a report on the Fukushima accident April 2, 2014. It stated that the scientists have found no evidence to support the idea that the nuclear meltdown in Japan in 2011 will lead to an increase in cancer rates or birth defects.[9]
None of the workers at the plant have died from acute radiation poisoning.[10]
The Kyshtym disaster, which occurred at Mayak in the Soviet Union, was rated as a level 6 on the International Nuclear Event Scale, the third most severe incident after Chernobyl and Fukushima. The most commonly quoted estimate is 200 deaths due to cancer, but the origin of this number is not clear. More recent epidemiological studies suggest that around 49 to 55 cancer deaths among riverside residents can be associated to radiation exposure.[12] This would include the effects of all radioactive releases into the river, 98% of which happened long before the 1957 accident, but it would not include the effects of the airborne plume that was carried north-east.[13] The area closest to the accident produced 66 diagnosed cases of chronic radiation syndrome, providing the bulk of the data about this condition.[14]
33+ cancer fatalities (estimated by UK government)[15][16] – Windscale, United Kingdom, October 8, 1957. The Windscale fire resulted when uranium metal fuel ignited inside plutonium production piles; surrounding dairy farms were contaminated.[15][16]
- 17 fatalities – Instituto Oncologico Nacional of Panama, August 2000 – March 2001. Patients receiving treatment for prostate cancer and cancer of the cervix receive lethal doses of radiation.[17][18]
- 13 fatalities – Radiotherapy accident in Costa Rica, 1996. 114 patients received an overdose of radiation from a Cobalt-60 source that was being used for radiotherapy.[19]
- 11 fatalities – Radiotherapy accident in Zaragoza, Spain, December 1990. Cancer patients receiving radiotherapy; 27 patients were injured.[20]
- 10 fatalities – Soviet submarine K-431 reactor accident, August 10, 1985. 49 people suffered radiation injuries.[21]
- 10 fatalities – Columbus radiotherapy accident, 1974–1976, 88 injuries from Cobalt-60 source.[18][22]
- 9 fatalities – Soviet submarine K-27 reactor accident, 24 May 1968. 83 people were injured.[18]
- 8 fatalities – Soviet submarine K-19 reactor accident, July 4, 1961. More than 30 people were over-exposed to radiation.[20]
- 8 fatalities – Radiation accident in Morocco, March 1984.[23]
- 7 fatalities – Houston radiotherapy accident, 1980.[18][22]
Atomic bombings of Hiroshima and Nagasaki
http://en.wikipedia.org/wiki/Atomic_bombings_of_Hiroshima_and_Nagasaki

Atomic_bombing_of_Japan
http://en.wikipedia.org/wiki/File:Atomic_bombing_of_Japan.jpg
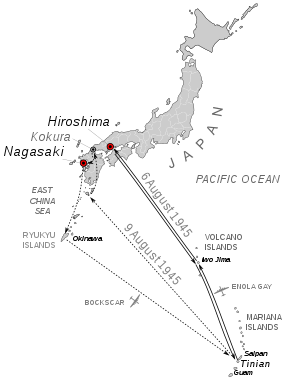
In August 1945, during the final stage of the Second World War, the United States dropped atomic bombs on the Japanese cities of Hiroshima and Nagasaki. The two bombings, which killed at least 129,000 people, remain the only use of nuclear weapons for warfare in history.
As the Second World War entered its sixth and final year, the Allies had begun to prepare for what was anticipated to be a very costly invasion of the Japanese mainland. This was preceded by an immensely destructive firebombing campaign that obliterated many Japanese cities. The war in Europe had concluded whenNazi Germany signed its instrument of surrender on May 8, 1945, but with the Japanese refusal to accept the Allies’ demands for unconditional surrender, thePacific War dragged on. Together with the United Kingdom and China, the United States called for the unconditional surrender of the Japanese armed forces in the Potsdam Declaration on July 26, 1945; this was buttressed with the threat of “prompt and utter destruction”.
By August 1945, the Allied Manhattan Project had successfully detonated an atomic device in the New Mexico desert and subsequently produced atomic weapons based on two alternate designs. The 509th Composite Group of the U.S. Army Air Forces was equipped with a Silverplate Boeing B-29 Superfortress that could deliver them from Tinian in the Mariana Islands.
General Douglas MacArthur and other top military commanders favored continuing the conventional bombing of Japan already in effect and following up with a massive invasion, codenamed “Operation Downfall.” They advised President Truman that such an invasion would result in U.S. casualties of up to 1 million. In order to avoid such a high casualty rate, Truman decided–over the moral reservations of Secretary of War Henry L. Stimson, General Dwight Eisenhower and a number of the Manhattan Project scientists–to use the atomic bomb in the hopes of bringing the war to a quick end. Proponents of the A-bomb–such as James F. Byrnes, Truman’s secretary of state–believed that its devastating power would not only end the war, but also put the U.S. in a dominant position to determine the course of the postwar world.[1]
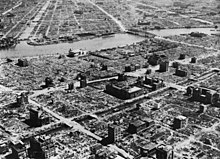
A uranium gun-type atomic bomb (Little Boy) was dropped on Hiroshima on August 6, 1945, followed by a plutonium implosion-type bomb (Fat Man) on the city ofNagasaki on August 9. Little Boy exploded 2,000 feet above Hiroshima in a blast equal to 12-15,000 tons of TNT, destroying five square miles of the city. Within the first two to four months of the bombings, the acute effects of the atomic bombings killed 90,000–166,000 people in Hiroshima and 39,000–80,000 in Nagasaki; roughly half of the deaths in each city occurred on the first day. During the following months, large numbers died from the effect of burns, radiation sickness, and other injuries, compounded by illness and malnutrition. In both cities, most of the dead were civilians, although Hiroshima had a sizable military garrison.

Operation Meetinghouse
The Operation Meetinghouse firebombing of Tokyo on the night of March 9–10, 1945, was the single deadliest air raid of World War II;[34] with a greater area of fire damage and loss of life than the nuclear bombings of Hiroshima or Nagasaki as single events.[35][36]
The firebombing of Tokyo, codenamed Operation Meetinghouse, on March 9–10 killed an estimated 100,000 people and destroyed 16 square miles (41 km2) of the city and 267,000 buildings in a single night. It was the deadliest bombing raid of the war, at a cost of 20 B-29s shot down by flak and fighters.[41] By May, 75% of bombs dropped were incendiaries designed to burn down Japan’s “paper cities”. By mid-June, Japan’s six largest cities had been devastated.[42] The end of the fighting on Okinawa that month provided airfields even closer to the Japanese mainland, allowing the bombing campaign to be further escalated. Aircraft flying from Allied aircraft carriers and the Ryukyu Islands also regularly struck targets in Japan during 1945 in preparation for Operation Downfall.[43] Firebombing switched to smaller cities, with populations ranging from 60,000 to 350,000. According to Yuki Tanaka, the U.S. fire-bombed over a hundred Japanese towns and cities.[44] These raids were also very devastating.[45]
The Japanese military was unable to stop the Allied attacks and the country’s civil defense preparations proved inadequate. Japanese fighters and antiaircraft guns had difficulty engaging bombers flying at high altitude.[46] From April 1945, the Japanese interceptors also had to face American fighter escorts based on Iwo Jima and Okinawa.[47] That month, the Imperial Japanese Army Air Service and Imperial Japanese Navy Air Service stopped attempting to intercept the air raids in order to preserve fighter aircraft to counter the expected invasion.[48] By mid-1945 the Japanese only occasionally scrambled aircraft to intercept individual B-29s conducting reconnaissance sorties over the country, in order to conserve supplies of fuel.[49] By July 1945, the Japanese had stockpiled 1,156,000 US barrels (137,800,000 l; 36,400,000 US gal; 30,300,000 imp gal) of avgas for the invasion of Japan.[50] While the Japanese military decided to resume attacks on Allied bombers from late June, by this time there were too few operational fighters available for this change of tactics to hinder the Allied air raids.[51]
For several months, the U.S. had dropped more than 63 million leaflets across Japan warning civilians of air raids. Many Japanese cities suffered terrible damage from aerial bombings, some were as much as 97% destroyed. LeMay thought that this would increase the psychological impact of bombing, and reduce the stigma of area bombing cities. Even with the warnings, Japanese opposition to the war remained ineffective. In general, the Japanese regarded the leaflet messages as truthful, but anyone who was caught in possession of one was arrested.[86][87] Leaflet texts were prepared by recent Japanese prisoners of war because they were thought to be the best choice “to appeal to their compatriots”.[88]
During the night of August 5–6, Japanese early warning radar detected the approach of numerous American aircraft headed for the southern part of Japan. The release at 08:15 (Hiroshima time) went as planned, and the Little Boy containing about 64 kg (141 lb) of uranium-235 took 44.4 seconds to fall from the aircraft flying at about 31,000 feet (9,400 m) to a detonation height of about 1,900 feet (580 m) above the city.[128][129][130] It created a blast equivalent to 16 kilotons of TNT (67 TJ), ± 2 kt.[129] The weapon was considered very inefficient, with only 1.7% of its material fissioning.[133] The radius of total destruction was about 1 mile (1.6 km), with resulting fires across 4.4 square miles (11 km2).[134]

Seizo Yamada’s ground level photo
http://upload.wikimedia.org/wikipedia/en/thumb/1/13/Hirgrnd1.jpg/170px-Hirgrnd1.jpg
At 11:01, a last-minute break in the clouds over Nagasaki allowed Bockscar’s bombardier, Captain Kermit Beahan, to visually sight the target as ordered. The Fat Man weapon, containing a core of about 6.4 kg (14 lb) of plutonium, was dropped over the city’s industrial valley at 32.77372°N 129.86325°E. It exploded 47 seconds later at 1,650 ± 33 ft (503 ± 10 m), above a tennis court[188] halfway between the Mitsubishi Steel and Arms Works in the south and the Mitsubishi-Urakami Ordnance Works (Torpedo Works) in the north. This was nearly 3 km (1.9 mi) northwest of the planned hypocenter; the blast was confined to the Urakami Valley and a major portion of the city was protected by the intervening hills.[189] The resulting explosion had a blast yield equivalent to 21 ± 2 kt (87.9 ± 8.4 TJ).[129] The explosion generated heat estimated at 3,900 °C (7,050 °F) and winds that were estimated at 1,005 km/h (624 mph).[190]

Nagasaki_1945
Around 1,900 cancer deaths can be attributed to the after-effects of the bombs. An epidemiology study by the RERF states that from 1950 to 2000, 46% of leukemia deaths and 11% of solid cancer deaths amongthe bomb survivors were due to radiation from the bombs, the statistical excess being estimated at 200 leukemia and 1,700 solid cancers.[247]
Risks of Nuclear Power
Bernard L. Cohen
http://www.physics.isu.edu/radinf/np-risk.htm
Since natural radiation is estimated to cause about 1% of all cancers, radiation due to nuclear technology should eventually increase our cancer risk by 0.002% (one part in 50,000), reducing our life expectancy by less than one hour. By comparison, our loss of life expectancy from competitive electricity generation technologies, burning coal, oil, or gas, is estimated to range from 3 to 40 days.
There has been much misunderstanding on genetic diseases due to radiation. The risks are somewhat less than the cancer risks; for example, among the Japanese A-bomb survivors from Hiroshima and Nagasaki, there have been about 400 extra cancer deaths among the 100,000 people in the follow-up group, but there have been no extra genetic diseases among their progeny. Since there is no possible way for the cells in our bodies to distinguish between natural radiation and radiation from the nuclear industry, the latter cannot cause new types of genetic diseases or deformities (e.g., bionic man), or threaten the “human race”.
The nuclear power plant design strategy for preventing accidents and mitigating their potential effects is “defense in depth”— if something fails, there is a back-up system to limit the harm done, if that system should also fail there is another back-up system for it, etc., etc. Of course it is possible that each system in this series of back-ups might fail one after the other, but the probability for that is exceedingly small.
Risks from reactor accidents are estimated by the rapidly developing science of “probabilistic risk analysis” (PRA). A PRA must be done separately for each power plant (at a cost of $5 million) but we give typical results here: A fuel melt-down might be expected once in 20,000 years of reactor operation. In 2 out of 3 melt-downs there would be no deaths, in 1 out of 5 there would be over 1000 deaths, and in 1 out of 100,000 there would be 50,000 deaths. The average for all meltdowns would be 400 deaths. Since air pollution from coal burning is estimated to be causing 10,000 deaths per year, there would have to be 25 melt-downs each year for nuclear power to be as dangerous as coal burning.
Of course deaths from coal burning air pollution are not noticeable, but the same is true for the cancer deaths from reactor accidents. In the worst accident considered, expected once in 100,000 melt-downs (once in 2 billion years of reactor operation), the cancer deaths would be among 10 million people, increasing their cancer risk typically from 20% (the current U.S. average) to 20.5%. This is much less than the geographical variation— 22% in New England to 17% in the Rocky Mountain states.
Very high radiation doses can destroy body functions and lead to death within 60 days, but such “noticeable” deaths would be expected in only 2% of reactor melt-down accidents; there would be over 100 in 0.2% of meltdowns, and 3500 in 1 out of 100,000 melt-downs.
The radioactive waste products from the nuclear industry must be isolated from contact with people for very long time periods. The bulk of the radioactivity is contained in the spent fuel, which is quite small in volume and therefore easily handled with great care. This “high level waste” will be converted to a rock-like form and emplaced in the natural habitat of rocks, deep underground. The average lifetime of a rock in that environment is one billion years. If the waste behaves like other rock, it is easily shown that the waste generated by one nuclear power plant will eventually, over millions of years (if there is no cure found for cancer), cause one death from 50 years of operation. By comparison, the wastes from coal burning plants that end up in the ground will eventually cause several thousand deaths from generating the same amount of electricity.
11.3.4.4.2 Cancer, Solar and Medical Radiation
Radiation Exposure and Cancer
http://www.cancer.org/cancer/cancercauses/radiationexposureandcancer/index
We are all exposed to some amount of radiation just from being on this planet. This is known as background radiation. In the United States this averages about 3 mSv per year. For most people, background radiation accounts for most of their exposure to ionizing radiation during the year. It comes from several different sources.
Cosmic rays
Radiation in the earth
Radon
Medical radiation
Certain types of imaging tests, such as x-rays, CT scans, and nuclear medicine tests (such as PET scans and bone scans) expose people to low levels of radiation in order to create internal pictures of the body. (Some imaging tests, such as MRI and ultrasound do not expose people to ionizing radiation.)
X-rays, gamma rays, and other forms of ionizing radiation offer an effective way to treat certain kinds of cancer. During radiation therapy, high doses of ionizing radiation (much higher than those used for imaging tests) are directed at the cancer, resulting in the death of the cancer cells. However, this can lead to DNA mutations in other cells that survive the radiation, which may eventually lead to the development of a second cancer.
Radiation therapy was recognized as a potential cause of cancer many years ago. In fact, much of what we know about the possible health effects of radiation therapy has come from studying survivors of atomic bomb blasts in Japan. We also have learned from workers in certain jobs that included radiation exposure, and patients treated with radiation therapy for cancer and other diseases
Most kinds of leukemia, including acute myelogenous leukemia (AML), chronic myelogenous leukemia (CML), and acute lymphoblastic leukemia (ALL) can be caused by past radiation exposure. Myelodysplastic syndrome (MDS), a bone marrow cancer that can turn into acute leukemia, has also been linked to past radiation exposure. The risk of these diseases after radiation treatment depends on a number of factors such as:
- How much of the bone marrow was exposed to radiation
- The amount of radiation that reached the bone marrow
- The radiation dose rate (how much was given in each dose, how long it took to give the dose, and how often it was given)
The person’s age when they were treated with radiation does not seem to be a risk factor. Most often, these cancers develop within several years of radiation treatment, peaking at 5 to 9 years after exposure. Then the number of new cancers slowly declines over the following years.
In contrast, other cancers, which are mostly solid tumors, have been shown to take much longer to develop. Most of these cancers are not seen for at least 10 years after radiation therapy, and some are diagnosed even more than 15 years later. The effect of radiation on the risk of developing a solid tumor cancer depends on such factors as:
- The dose of radiation
- The area treated
- The age of the patient when they were treated with radiation
Up to 10% of invasive cancers are related to radiation exposure, including both ionizing radiation and non-ionizing radiation.[1] Additionally, the vast majority of non-invasive cancers are non-melanoma skin cancers caused by non-ionizing ultraviolet radiation. Ultraviolet’s position on the electromagnetic spectrum is on the boundary between ionizing and non-ionizing radiation. Non-ionizing radio frequency radiation from mobile phones, electric power transmission, and other similar sources have been described as a possible carcinogen by the World Health Organization‘s International Agency for Research on Cancer, but the link remains unproven.[2]
Exposure to ionizing radiation is known to increase the future incidence of cancer, particularly leukemia. The mechanism by which this occurs is well understood, but quantitative models predicting the level of risk remain controversial. The most widely accepted model posits that the incidence of cancers due to ionizing radiation increases linearly with effective radiation dose at a rate of 5.5% per sievert.[3] If the linear model is correct, then natural background radiation is the most hazardous source of radiation to general public health, followed by medical imaging as a close second.
Radiation-induced cancer: a modern view.
Shah DJ1, Sachs RK, Wilson DJ.
Br J Radiol. 2012 Dec; 85(1020):e1166-73.
http://dx.doi.org:/10.1259/bjr/25026140.
Diagnostic medical radiation has been the most rapidly increasing component of population background radiation exposure in Western countries over the past decade. This trend is set to increase as CT scanning is readily available with burgeoning use in everyday clinical practice. Consequently, the issue of cancer induction from the doses received during diagnostic medical exposures is highly relevant. In this review we explain current understanding of potential cancer induction at low doses of sparsely ionizing radiation. For cancers that may be induced at low doses, a mechanistic description of radiation-induced cancer is discussed, which, in combination with extrapolation of data based on population cohort studies, provides the basis of the currently accepted linear no-threshold model. We explore the assumptions made in deriving risk estimates, the controversies surrounding the linear no-threshold model and the potential future challenges facing clinicians and policy-makers with regards to diagnostic medical radiation and cancer risk, most notably the uncertainties regarding deriving risk estimates from epidemiological data at low doses.
This review summarizes current thinking on how to estimate the cancer risk due to [low linear energy transfer (LET)] ionizing radiation doses in the range relevant to diagnostics, from <1 mGy to ∼50 mGy. Data derived from epidemiological studies at higher doses (up to ∼1.5 Gy) usually involve a number of complex additional effects not directly relevant to the low-dose estimates.
The fact that ionizing radiation causes cancer in humans has been known for over a century. In 1902, the first radiation-induced cancer had been reported in an area of ulcerated skin. By 1911, there were even reports of leukemia arising in radiation workers [1]. Our understanding of radiation carcinogenesis has vastly progressed since the Second World War because of animal models [2], and also because of the important epidemiological evidence arising from the Life Span Study of the Japanese Atomic Bomb survivor cohort [3]. This cohort is absolutely crucial to our understanding and estimation of cancer risk from ionizing radiation. Its usefulness is the result of: the large size of the studied population (approximately 100 000 survivors); the long length of follow-up (over 60 years); the breadth of the population exposed (including males and females of all age groups); the fact that population selection was not in any way based on cancer status; the variation of doses received, ranging from the low doses relevant to diagnostic medical radiation to much larger, even lethal, doses; and the fact that individuals received a whole-body exposure rather than targeted exposures to individual organs, so that risks for most solid cancers/leukemias can be estimated.
There is strong epidemiological evidence that the relationship between radiation exposure and solid cancer induction is approximately linear for “intermediate” doses from approximately 0.15 Gy to approximately 1.5 Gy (i.e. a range of approximately 1 log). However, the large numbers of exposed individuals at low doses required to induce a statistically significant number of cancers has precluded definitive epidemiological study of the shape of the dose–response curve at levels most relevant to medical diagnostics.
The best that can be done based on our current evidence is to extrapolate down the linear curve at intermediate doses to those levels encountered in diagnostic radiology, i.e. <0.1 Gy. Unfortunately, the lack of reliable evidence at low doses has led to considerable controversy about the shape of the dose–response curve at low doses (Figure 1).

radiation related cancer risks bjr-85-e1166-g001
http://www.ncbi.nlm.nih.gov/pmc/articles/PMC3611719/bin/bjr-85-e1166-g001.jpg
In this section we emphasise human cancer data, rather than surrogate end points. The linear no-threshold (LNT) model assumes a curvature at moderate doses, but linearity at low doses or low dose rates. However, for the low doses and dose rates relevant to diagnostic radiology, the curve can be assumed to be linear (Figure 1, curve c). It is consistent with the data for solid tumours at doses <1.5 Gy in the Life Span Study.
The central assumption made with the LNT model is that the rate-limiting event in low-dose radiation carcinogenesis is due to “one-track action”, e.g. one or more DNA double strand breaks (DSBs) caused by a single electron track. Dose is directly proportional to track number. Cancer risk owing to one-track action is therefore proportional to dose, with any dose, no matter how small, able to induce cancer (although extremely unlikely to do so). The main rationale for the one-track action assumption is as follows:
- Epidemiological evidence from the studies of in utero radiation exposure has shown that a dose of 6 mGy is associated with an increase in cancer risk [4].
- A subsequent comprehensive review in 1997 by Doll and Wakeford [5] concluded that fetal irradiation in utero with diagnostic X-rays giving an organ dose of 10 mGy produced a consequent increase in the risk of childhood cancer.
- It is known that, at the dose of 10 mGy, one cell nucleus is typically irradiated with ∼10 electron tracks or fewer, depending on the details of the cell and the low-LET radiation [6]. The tracks are then typically far apart in space (>1 μm) and in time (>1 ms). On biophysical grounds it is difficult (although, as discussed later, not impossible) to conceive how two independent electron tracks that are remote in space and time can cooperate (synergistically or agonistically) to increase or decrease the cancer risk. Thus it can be concluded that in all likelihood the key rate-limiting event at 10 mGy is due to one-track action.
- If one-track action can cause cancer, then it follows that reducing the radiation dose by a factor of 10 will simply reduce the number of electron tracks by a factor of 10, and therefore reduce the probability of cancer initiation by the same factor.
- A linear model, with no threshold dose below which radiation is safe, is therefore the most appropriate model in the absence of strong evidence to the contrary.
The LNT has been modified slightly in two respects: data from the Life Span Study for the incidence at intermediate doses of leukaemias (other than chronic lymphocytic leukaemia, which seems to be non-radiogenic [7]) correlate well with a linear-quadratic curve [8], similar to that shown in Figure 1, curve d; and the concept of dose fractionation has led to the introduction of a dose and dose rate effectiveness factor (DDREF) for risk decrease when these quantities are small, which has been suggested as 1.5 or 2 [9]. The value of 1.5 is from the Biological Effects of Ionizing Radiation (BEIR) VII report [9], which used a Bayesian approach with priors based on animal experiments to analyse the low-dose portion of the atomic bomb Life Span Study.
One basis of a DDREF is the relative protection from radiation damage observed for many end points if the same dose is delivered over an extended time, as opposed to the single acute doses seen in the Life Span Study. It is plausible that, by administering a given dose at a lower dose rate or by splitting it into many fractions, the biological system has more time to repair the damage, so that the total damage induced will be less than that expected for the single dose [8]. However, studies on radiogenic cancers in workers occupationally exposed to low dose-rate radiation have concluded that lower DDREFs, e.g. 1.2, seem reasonable, thus somewhat strengthening the epidemiological case for LNT estimates [10].
In summary, the LNT model still remains the most robust model for making decisions about medical radiation exposure vs cancer risk, and one of the safest. It should, however, be used judiciously in conjunction with general dose reduction strategies from newer technology and increased use of protocols and patient-specific information to balance the (probable, but uncertain) risk of low-dose radiation with regards to cancer induction against the tangible immediate benefits of CT within the population, e.g. in cases of head injury.
Before these individualized risks can be communicated with any degree of confidence to the radiation protection community and patients, the current default position of using the LNT model underpinned by the available epidemiological data (with their inherent limitations) would seem to be the safest and most prudent course of action.
11.4.5 Occupational Hazards
Occupational Cancer
http://www.cdc.gov/niosh/topics/cancer/
Cancer is a group of different diseases that have the same feature, the uncontrolled growth and spread of abnormal cells. Each different type of cancer may have its own set of causes. Many factors play a role in the development of cancer. The importance of these factors varies depending on the type of cancer. A person’s risk of developing a particular cancer is influenced by a combination of factors that interact in ways that are not fully understood. Some of the factors include:
- Personal characteristics such as age, sex, and race
- Family history of cancer
- Diet and personal habits such as cigarette smoking and alcohol consumption
- The presence of certain medical conditions
- Exposure to cancer-causing agents in the environment
- Exposure to cancer-causing agents in the workplace
In many cases, these factors may act together or in sequence to cause cancer.
Millions of U.S. workers are exposed to substances that have tested as carcinogens in animal studies. However, less than 2% of chemicals manufactured or processed in the U.S. have been tested for carcinogenicity(1). Based on well-documented associations between occupational exposures and cancer, it has been estimated that 4% to 10% of U.S. cancers (48,000 incident cases annually) are caused by occupational exposures(2). Key to all occupational exposures is that virtually all such exposures can be prevented
(3-5).
World Cancer Report 2008 pp. 510 pp.
Boyle, P.; Levin, B.
http://www.cabdirect.org/abstracts/20103010665.html
This publication provides a unique global view of cancer and documents many important features of the global situation in the context of the disease. Broadly, its chapters are about global control, etiology, and prevention of cancer, and mechanisms of carcinogenesis. Various aspects of the disease including risk factors, treatments, epidemiology, pathogenesis, clinical aspects, diagnosis and screening, and management, are addressed for each of the different sites of the body considered. On etiology, tobacco smoking, chronic infections, alcohol drinking, hormones, radiation, diet, obesity, and physical activity, occupational exposures, genetic susceptibility, and medical and iatrogenic causes were discussed. Topics on emerging technologies such as biomarkers and stem cells, and biobanks and resource centers were also presented.
Occupation and Cancer http://www.cancer.org/acs/groups/content/@nho/documents/document/occupationandcancerpdf.pdf
| Type Cancer | Substances – exposure |
| Lung | Arsenic, asbestos, beryllium, coke oven fumes, … |
| Bladder | Paint/dying, printing, benzidine, β-naphthylamine, arsenic,.. |
| Nasopharyngeal | Formaldehyde, textiles, mustard gas, nickel … |
| Larynx | Asbestos, wood dust, paint fumes, petroleum.. |
| Mesothelioma | Asbestos |
| Lymphatic/hemopoietic | Benzene, herbicides, insecticides, radiation |
| Skin | Arsenic, coal tars, paraffin, sunlight |
| Soft tissue sarcoma | Radiation |
| Liver | Arsenic, vinyl chloride |
| Lip | Sunlight |
11.4.5.1 Mining
Proximity to mining industry and cancer mortality
P Fernández-Navarro, J García-Pérez, R Ramis, E Boldo, G López-Abente
Science of The Total Environment 2012 Oct 1; 435–436:66–73
http://dx.doi.org/10.1016/j.scitotenv.2012.07.019
Mining installations are releasing toxic substances into the environment which could pose a health problem to populations in their vicinity. We sought to investigate whether there might be excess cancer-related mortality in populations residing in towns lying in the vicinity of Spanish mining industries governed by the Integrated Pollution Prevention and Control Directive, and the European Pollutant Release and Transfer Register Regulation, according to the type of extraction method used. An ecologic study was designed to examine municipal mortality due to 32 types of cancer, across the period 1997 through 2006. Population exposure to pollution was estimated on the basis of distance from town of residence to pollution source. Poisson regression models, using the Bayesian conditional autoregressive model proposed by Besag, York and Molliè and Integrated Nested Laplace Approximations for Bayesian inference, were used: to analyze risk of dying from cancer in a 5-kilometer zone around mining installations; effect of type of industrial activity; and to conduct individual analyses within a 50-kilometer radius of each installation. Excess mortality (relative risk, 95% credible interval) of colorectal cancer (1.097, 1.041–1.157), lung cancer (1.066, 1.009–1.126) specifically related with proximity to opencast coal mining, bladder cancer (1.106, 1.016–1.203) and leukemia (1.093, 1.003–1.191) related with other opencast mining installations, was detected among the overall population in the vicinity of mining installations. Other tumors also associated in the stratified analysis by type of mine, were: thyroid, gallbladder and liver cancers (underground coal installations); brain cancer (opencast coal mining); stomach cancer (coal and other opencast mining installations); and myeloma (underground mining installations). The results suggested an association between risk of dying due to digestive, respiratory, hematologic and thyroid cancers and proximity to Spanish mining industries. These associations were dependent on the type of mine.
Highlights
► Increased risk of cancer mortality among populations in the vicinity of mines. ► We found that underground coal mining was related to digestive cancers and thyroid cancer. ► We found that lung cancer was associated with open-air coal mining. ► We used information from the European Pollutant Release and Transfer Register. ► Integrated nested Laplace approximations (INLA) was used as Bayesian inference tool.
http://ars.els-cdn.com/content/image/1-s2.0-S0048969712009643-gr1.sml
11.4.5.2 Petroleum Extraction
Petroleum mineral oil refining and evaluation of cancer hazard.
Mackerer CR1, Griffis LC, Grabowski Jr JS, Reitman FA
Appl Occup Environ Hyg. 2003 Nov; 18(11):890-901.
Petroleum base oils (petroleum mineral oils) are manufactured from crude oils by vacuum distillation to produce several distillates and a residual oil that are then further refined. Aromatics including alkylated polycyclic aromatic compounds (PAC) are undesirable constituents of base oils because they are deleterious to product performance and are potentially carcinogenic. In modern base oil refining, aromatics are reduced by solvent extraction, catalytic hydrotreating, or hydrocracking. Chronic exposure to poorly refined base oils has the potential to cause skin cancer. A chronic mouse dermal bioassay has been the standard test for estimating carcinogenic potential of mineral oils. The level of alkylated 3-7-ring PAC in raw streams from the vacuum tower must be greatly reduced to render the base oil noncarcinogenic. The processes that can reduce PAC levels are known, but the operating conditions for the processing units (e.g., temperature, pressure, catalyst type, residence time in the unit, unit engineering design, etc.) needed to achieve adequate PAC reduction are refinery specific. Chronic dermal bioassays provide information about whether conditions applied can make a noncarcinogenic oil, but cannot be used to monitor current production for quality control or for conducting research or developing new processes since this test takes at least 78 weeks to conduct. Three short-term, non-animal assays all involving extraction of oil with dimethylsulfoxide (DMSO) have been validated for predicting potential carcinogenic activity of petroleum base oils: a modified Ames assay of a DMSO extract, a gravimetric assay (IP 346) for wt. percent of oil extracted into DMSO, and a GC-FID assay measuring 3-7-ring PAC content in a DMSO extract of oil, expressed as percent of the oil. Extraction with DMSO concentrates PAC in a manner that mimics the extraction method used in the solvent refining of noncarcinogenic oils. The three assays are described, data demonstrating the validation of the assays are shown, and test results of currently manufactured base oils are summarized to illustrate the general lack of cancer hazard for the base oils now being manufactured.
Oils and cancer.
Tolbert PE.
Cancer Causes Control. 1997 May;8(3):386-405.
http://www.ncbi.nlm.nih.gov/pubmed/9498901#
Epidemiologic evidence on the relationship between mineral oil exposure and cancer is reviewed. The review is restricted to occupations involving substantial dermal and inhalational exposure and for which an epidemiologic literature exists: metal machining, print press operating, and cotton and jute spinning. Mineral oils are complex mixtures of aliphatic hydrocarbons, naphthenics, and aromatics, the relative distribution of which depends on the source of the oil and the method of refinement. End-use products contain a variety of additives, and contamination by other agents generally occurs during use. Suspect agents include polycyclic aromatic hydrocarbons (PAH) (particularly benz[a]pyrene), nitrosamines, chlorinated paraffins, long-chain aliphatics, sulfur, N-phenyl-2-naphthylamine, and formaldehyde. The heterogeneity of this exposure makes epidemiologic study difficult and meta-analysis inappropriate. Nonetheless, several associations emerge from the literature with varying degrees of support. There is clear evidence that early formulations of mineral oils used in cotton and jute spinning and in metal machining were carcinogenic to the skin. Associations of mineral oil exposure with laryngeal and rectal cancer have received some support in the literature, particularly with respect to straight oils. Evidence is suggestive that grinding operations (which can entail either mineral oil-based or ethanolamine-based fluids) are associated with excess risk of cancer of the esophagus, stomach, and pancreas. A number of bladder cancer case-control studies have noted an association with work as a machinist. There is limited evidence of an association with cancer of the colon, prostate, and sinonasal region. Several studies of printers have yielded positive findings for lung cancer, whereas studies in metal machinists have been generally negative. The PAH and nitrosamine content of current formulations is lower than in the past and the implications of these changes in composition to the carcinogenicity of the formulations are not yet known.
Oil Sands Development: A Health Risk Worth Taking?
David J. Tenenbaum
Environ Health Perspect. 2009 Apr; 117(4): A150–A156.
http://www.ncbi.nlm.nih.gov/pmc/articles/PMC2679626/pdf/ehp-117-a150.pdf
As traditional petroleum supplies dwindled and prices soared over the past few years, oil companies have shifted their attention to oil sands, a mix of sand, water, and a heavy, viscous hydrocarbon called bitumen that can be converted to oil. With the plunge in oil prices in fall 2008, many producers began canceling or postponing plans to expand oil sands development projects, but this turn of events could yet reverse, as Canada’s vast oil sands deposits are lauded as a secure source of imported oil for the United States. At the same time, however, oil sands present troubling questions in terms of the environmental health effects associated with their development.
Oil sands are found in about 70 countries. Alberta, Canada, is home to the largest known oil sands deposits, underlying about 140,000 square kilometers of boreal forest. In the 2006 report Alberta’s Energy Reserves 2005 and Supply Outlook 2006–2015, the entity then known as the Alberta Energy and Utilities Board estimated the amount of recoverable oil in Canada’s oil sands at 175 billion barrels, second only to Saudi Arabia’s reserves (which consist largely of conventional oil).
A good deal of the controversy about oil sands development centers around those tailings ponds, which cover more than 130 square kilometers in northern Alberta, according to the 2008 report 11 Million Litres a Day: The Tar Sands’ Leaking Legacy from Canada’s Environmental Defence. Some large tailings ponds are separated by earthen dikes from the Athabasca River, which joins the Mackenzie River to form the major watershed of Northwest Canada. The water in these ponds often contains arsenic, mercury, PAHs, and other toxics found in the bitumen. Oil sands operators maintain interceptor ditches and wells to catch leakage from the tailings ponds, but the Environmental Defence report calculated that 11 million A good deal of the controversy about oil sands development centers around those tailings ponds, which cover more than 130 square kilometers in northern Alberta, according to the 2008 report 11 Million Litres a Day: The Tar Sands’ Leaking Legacy from Canada’s Environmental Defence. Some large tailings ponds are separated by earthen dikes from the Athabasca River, which joins the Mackenzie River to form the major watershed of Northwest Canada. The water in these ponds often contains arsenic, mercury, PAHs, and other toxics found in the bitumen. Oil sands operators maintain interceptor ditches and wells to catch leakage from the tailings ponds, but the Environmental Defence report calculated that 11 million.
At surface mining facilities (above), trucks carrying hundreds of tons each transport ore to processing facilities. However, most of Alberta’s oil sand deposits lie deep underground, and the bitumen must be pumped to the surface using techniques such as steam-assisted gravity drainage.
Ecologist Kevin P. Timoney of Treeline Ecological Research believes the 11 million liters/day estimate is conservative; the actual rate, he says, is probably much greater. In A Study of Water and Sediment Quality as Related to Public Health Issues, Fort Chipewyan, Alberta, published in November 2007, Timoney described his analysis of published data on water and sediment quality indicators at the titular community, which is located at the northernmost edge of the Athabasca oil sands. He noted that Fort Chipewyan lies within a depositional basin in which metals and other contaminants tend to accumulate in fine-textured sediments. Concentrations of arsenic, mercury, and PAHs are especially high in water and sediment, and many other metals (including cadmium, chromium, cobalt, and lead) and agricultural chemicals also are present. Timoney’s analysis further noted that studies of local fish have shown that all the walleye and female whitefish and almost all the male whitefish tested exceeded U.S. guidelines for mercury consumption. Although treated local water appeared safe, untreated water in Lake Athabasca had levels of arsenic, total mercury, and PAHs sufficient to pose a threat to wildlife or humans.
Glen Van Der Kraak, a professor in the Department of Integrative Biology at the University of Guelph, Ontario, says studies of fish exposed to oil sands wastewater consistently find endocrine disruption and impairments of reproductive physiology. For example, in research published in the 1 May 2008 issue of Aquatic Toxicology, Van Der Kraak and colleagues found that goldfish
exposed to wastewater from tailings ponds had dramatically lower plasma levels of testosterone and 17β-estradiol than control fish. The prime suspect behind these effects, says Van Der Kraak, is naphthenic acids, compounds that are often present in tailings pond water.
John O’Connor, a doctor who practiced in Fort Chipewyan between 2002 and 2007, first raised the alarm about human cases of cholangiocarcinoma, reporting six possible cases in this community of about 900. This rare cancer of the bile duct typically strikes about 2 in 100,000 people. In Alberta, the incidence of cholangiocarcinoma has increased progressively over the past 30 years, and rates are 2–3 times higher in First Nations communities compared with non–First Nations populations.
Incidence in Fort Chipewyan, Alberta, 1995–2006, the group reported that only two of the cases in Fort Chipewyan were confirmed as cholangiocarcinoma. A third case was not a cancer, and the remainder were confirmed to be other cancers. Given these numbers, the incidence of cholangiocarcinoma fell within the expected range. However, the study found higher-thanexpected numbers of cancers of the blood and lymphatic system, biliary tract, and soft tissue (all statistically significant findings), as well as all cancers combined (51 observed versus 39 expected cases—a finding deemed to be of borderline statistical significance).
The authors also noted that a 2006 analysis of the health status of Fort Chipewyan residents showed that residents have elevated prevalence rates of diabetes, hypertension, renal failure, and lupus. All these diseases have been linked with one or more of the toxics commonly found in tailings pond water. The working group suggested that, in order to examine risks for cancer and other chronic diseases, assessment of the overall health status and risk factor profile of Fort Chipewyan residents would be needed. Future studies should also evaluate the occupational history and employment-related migration pattern of the cancer patients in the community, because many of the Fort Chipewyan residents work or had worked in the oil sands or uranium industries. As the authors pointed out, “Previous studies of cancer risk and occupational exposure have suggested increased risk of leukemia and lung cancer in oil field workers, and increased risk of leukemia, lung cancer, and cancers in gallbladder and extrahepatic bile ducts in uranium miners.”
Long-Term Restoration Challenges Although the authors of Cancer Incidence in Fort Chipewyan avoided assigning a cause for the cancers they observed, many critics of oil sands development believe it is only a matter of time before a link is established with tailings pond leakage. Moreover, in his 2007 report, Timoney asserted that abandoned tailings ponds could pose a major health threat to surrounding communities for years to come. “While a mine is in operation, monitoring and pumping of tailing pond leaks is continuous,” he wrote. “No one knows what will happen when a mine has exhausted a site, shuts down its operation, and leaves. Tailings pond abandonment is an unproven technology whose success is predicated on modeling rather than real world experience. . . . The [Alberta oil sands formation] is known to be porous with active subsurface water movements. Billions of cubic meters of contaminated water soon will be sitting untended, with no active pumping, in abandoned ponds adjacent to the Athabasca River.” The challenges of restoring the tailings ponds and other elements of development sites have been underestimated, says E.A. Johnson, a professor of biological sciences at the University of Calgary and co-author of a report on the science behind reclamation in the oil sands published in The Year in Ecology and Conservation Biology 2008. “Restorations are usually small projects, a few hectares in size, but now we are confronted with whole landscapes in which the reconstruction must start with the central template, the groundwater, and then the soil. . . . We are going to have to reconstruct the drainage, the groundwater f low, and these are things about which we have little knowledge. It is not clear to me that everybody understands how complicated this is.” M a ny y e a r s a r e needed to evaluate a restoration, Johnson adds. “Traditionally, even in small restoration projects, it takes much longer than anyone imagines, especially for the monitoring. This calls for a 40-year attention span or more, and it will be hard to keep that going.
“The ultimate goal is dry tailings,” agrees Stringham, who notes that the industry is, in fact, working on near-term solutions, such as injecting carbon dioxide (CO2 ) into tailings so the clay can settle more quickly, allowing the water to be drawn off and reused. A Carbon-Intense Industry The carbon intensity of oil sands development poses other environmental health questions. The extraction and refining of oil sands produces 30–70% more greenhouse gas emissions than conventional oil production, according to estimates by Alex Farrell and Adam Brandt published in the October 2007 issue of Climatic Change. If the greenhouse gas impact of oil sands is calculated to include the CO2 released when the fuel is burned, the discrepancy drops to 10–30%, says Aimee Curtright, an analyst at the RAND Corporation and coauthor of the 2008 report Unconventional Fossil-Based Fuels: Economic and Environmental Trade-Offs. “For both [conventional and unconventional] oil, most CO2 release occurs in burning; the smaller portion of greenhouse gases is related to the production process,” she says. The primary global impact of oil sands comes through the release of greenhouse gases created when about 800 million cubic feet of natural gas (approximately 10% of Canada’s total natural gas consumption) is burned daily to create heat for extraction and upgrading, says Stringham. In the 2006 report The Canadian Oil Sands in the Context of the Global Energy Demand, Eddy Isaacs, director of the Alberta Energy Research Institute, wrote that 176 cubic meters of natural gas are required to liquefy, extract, and purify each cubic meter of bitumen produced.
Carbon capture and storage (CCS), in which CO2 would be transferred to deep underground storage, is touted by oil sands advocates as the ultimate solution to greenhouse gases releases. In April 2008 the government of Alberta launched a council, led by former Syncrude president Jim Carter, to develop a roadmap for broad-scale implemention of CCS. In July 2008 the government committed Can$2 billion to support construction of “high-impact” CCS facilities starting this spring in the expectation that overall greenhouse gas emissions will be reduced by 5 million metric tons per year by 2015. However, although many experts believe CCS is viable in theory, it is largely untested on the scale proposed by the oil sands industry. [For more information on CCS, see “Carbon Capture and Storage: Blue-Sky Technology or Just Blowing Smoke?” EHP 115:A538–A545 (2007).]
Leave a Reply