Is Malnutrition the Cost of Civilization?
Curation: Larry H. Bernstein, MD, FCAP
This topic is an extension of more than 30 years interest in nutrition, mainly, but not only protein-energy malnutrition. The field of biochemistry and enzymology that concerns intermediary metabolism has a relationship to the processes of the living cell and organisms, and precedes the evolution of molecular biology and genomics. However, the global importance of nutrition, food sources and water supplies has not retreated despite extensive knowledge about nutrition, improvements in agriculture, and the evolution of food science. The insurmountable problem is the long global history of centuries of european colonialization and more recent post WWII hegemeny, repeated wars, the decay of states, rural and/or urban poverty, and mass migrations. These have much to do about environment and of economic disparities that make continuation of the current situation unsustainable as exists. The solutions are both economic and political.
I shall divide this presentation into the following parts:
- What is malnutrition?
- How is malnutrition distributed among countries around the globe?
- The significant burden of childhood malnutrition and stunting.
- The good, the bad and the ugly of sulfur and volcanic activity.
- The relationship of S amino acids to marasmic and kwashiorkor PEM.
- The biochemistry of S amino acids.
- The relationship of stress hypermetabolism to essential protein needs.
- The relationship of PEM to stature and to brain development.
- Nutrition and aging.
The Malady and its Distribution
What is Malnutrition?
Simply put malnutrition is the long term deficiency of necessary nutrients for life or for long term growth and maintenance. There are two major types of malnutrition. We have a long history of the discovery of the elements of the periodic table, a number of which are essential for anionic and cationic activity, and metal ligands (iron), and of the vitamins, essential for cofactors and involved in enzymatic reactions. These are called micronutrients. They are not the subject of these discussions. We concern ourselves here with macronutrient deficiency, such as carbohydrate, protein and fat. Carbohydrate is fuel for short term energy and for structure, and fat is used for long term energy and structure. In this case I call attention to essential proteins, which may also bind to carbohydrate or to lipid in membrane structure. This major nutritional class is called protein-energy malnutrition, which exists as marasmus or as kwashiorkor, the latter of which exhibits edema and wasting. Edema may occur at a serum albumin concentration less than 2.8 mg/dl, at which water accumulates in the interstitial tissues, and in severely malnourished children accumulates in the peritoneal cavity. Serious protein-energy malnutrition (PEM) can result in death, either from sufficient loss of lean body mass, or from comorbidity of infection, septicemia, or organ failure, and may have anemia, congestive heart failure, pulmonary edema, or viral or parasitic infection as comorbidity. On a global scale, PEM is most common in children under age 5-6 years age, and it is accompanied by stunting (growth failure) and mental retardation. PEM in urban or rural areas is associated with high poverty rates and in some regions with waste water contamination, and in other circumstances a lack of dietary animal protein from milk at birth, and later from lack of milk, eggs, chicken, fish, or meat intake by a vegan diet.
Water-related diseases
Malnutrition
Malnutrition is a major health problem, especially in developing countries. Water supply, sanitation and hygiene, given their direct impact on infectious disease, especially diarrhoea, are important for preventing malnutrition. Both malnutrition and inadequate water supply and sanitation are linked to poverty. The impact of repeated or persistent diarrhoea on nutrition-related poverty and the effect of malnutrition on susceptibility to infectious diarrhoea are reinforcing elements of the same vicious circle, especially amongst children in developing countries.
The disease and how it affects people
Malnutrition essentially means “bad nourishment”. It concerns not enough as well as too much food, the wrong types of food, and the body’s response to a wide range of infections that result in malabsorption of nutrients or the inability to use nutrients properly to maintain health. Clinically, malnutrition is characterized by inadequate or excess intake of protein, energy, and micronutrients such as vitamins, and the frequent infections and disorders that result.
People are malnourished if they are unable to utilize fully the food they eat, for example due to diarrhoea or other illnesses (secondary malnutrition), if they consume too many calories (overnutrition), or if their diet does not provide adequate calories and protein for growth and maintenance (undernutrition or protein-energy malnutrition).
Malnutrition in all its forms increases the risk of disease and early death. Protein-energy malnutrition, for example, plays a major role in half of all under-five deaths each year in developing countries (WHO 2000). Severe forms of malnutrition include marasmus (chronic wasting of fat, muscle and other tissues); cretinism and irreversible brain damage due to iodine deficiency; and blindness and increased risk of infection and death from vitamin A deficiency.
Nutritional status is compromised where people are exposed to high levels of infection due to unsafe and insufficient water supply and inadequate sanitation. In secondary malnutrition, people suffering from diarrhoea will not benefit fully from food because frequent stools prevents adequate absorption of nutrients. Moreover, those who are already experiencing protein-energy malnutrition are more susceptible to, and less able to recover from, infectious diseases.
The cause
Individual nutritional status depends on the interaction between food that is eaten, the overall state of health and the physical environment. Malnutrition is both a medical and a social disorder, often rooted in poverty. Combined with poverty, malnutrition contributes to a downward spiral that is fuelled by an increased burden of disease, stunted development and reduced ability to work.
Poor water and sanitation are important determinants in this connection, but sometimes improvements do not benefit the entire population, for example where only the wealthy can afford better drinking-water supplies or where irrigation is used to produce export crops. Civil conflicts and wars, by damaging water infrastructure and contaminating supplies, contribute to increased malnutrition.
Scope of the Problem
Chronic food deficits affect about 792 million people in the world (FAO 2000), including 20% of the population in developing countries. Worldwide, malnutrition affects one in three people and each of its major forms dwarfs most other diseases globally (WHO, 2000). Malnutrition affects all age groups, but it is especially common among the poor and those with inadequate access to health education and to clean water and good sanitation. More than 70% of children with protein-energy malnutrition live in Asia, 26% live in Africa, and 4% in Latin America and the Caribbean (WHO 2000).
Interventions
Interventions that contribute to preventing malnutrition include :
- Improved water supply, sanitation and hygiene.
- Health education for a healthy diet.
- Improved access, by the poor, to adequate amounts of healthy food.
- Ensuring that industrial and agricultural development do not result in increased malnutrition.
References
WHO. Turning the tide of malnutrition: responding to the challenge of the 21st century. Geneva: WHO, 2000 (WHO/NHD/00.7)
FAO. The state of food insecurity in the world 2000 (FAO, Rome)
See also WHO web site on nutrition
Prepared for World Water Day 2001. Reviewed by staff and experts from the Department of Nutrition for Health and Development and the Water, Sanitation and Health Unit, World Health Organization (WHO).
2015 World Hunger and Poverty Facts and Statistics
http://www.worldhunger.org/articles/Learn/world%20hunger%20facts%202002.htm
Protein is necessary for key body functions including provision of essential amino acids and development and maintenance of muscles. Protein-energy malnutriton is the more lethal form of malnutrition/hunger and is the type of malnutrition that is referred to when world hunger is discussed. This leads to growth failure. Principal types of growth failure are:
- The two types of acute malnutrition are wasting (also called marasmus) or nutritional edema, (also called kwashiorkor). Wasting is characterised by rapid weight loss and in its severe form can lead to death. Nutritional edema is caused by insufficient protein in the diet. See visual illustrations here.
. - Stunting is a slow, cumulative process and is caused by insufficient intake of some nutrients. It is estimated by the United Nations Children’s Fund (UNICEF) to affect 161 million children world wide (UNICEF Nutrition). Stunted children may have normal body proportions but look younger than their actual age. Stunting develops over a long period as a result of inadequate nutrition or repeated infections, or both.
The second type of malnutrition, also very important, is micronutrient (vitamin and mineral) deficiency. This is not the type of malnutrition that is referred to when world hunger is discussed, though it is certainly very important.
Number of hungry people in the world
The United Nations Food and Agriculture Organization estimates that about 805 million people of the 7.3 billion people in the world, or one in nine, were suffering from chronic undernourishment in 2012-2014. Almost all the hungry people, 791 million, live in developing countries, representing 13.5 percent, or one in eight, of the population of developing counties. There are 11 million people undernourished in developed countries (FAO 2014; for individual country estimates, see Annex 1. For other valuable sources, especially if interested in particular countries or regions, see IFPRI 2014 and Rosen 2014,).
A global distribution of PEM has been extensively studied by the World Health Organization for decades. Here are some examples with maps of the global distribution of the disease.
Undernourishment around the world, 1990-2 to 2012-4
Number of undernourished and prevalence (%) of undernourishment
| 1990-2 No. | 1990-2 % | 2012-4 No. | 2012-4 % | |
| World | 1,014.5 | 18.7 | 805.3 | 11.3 |
| Developed regions | 20.4 | <5 | 14.6 | <5 |
| Developing regions | 994.1 | 23.4 | 790.7 | 14.5 |
| Africa | 182.1 | 27.7 | 226.7 | 20.5 |
| Sub-Saharan Africa | 176.0 | 33.3 | 214.1 | 23.8 |
| Asia | 742.6 | 23.7 | 525.6 | 12.7 |
| Eastern Asia | 295.2 | 23.2 | 161.2 | 10.8 |
| South-Eastern Asia | 138.0 | 30.7 | 63.5 | 10.3 |
| Southern Asia | 291.7 | 24.0 | 276.4 | 15.8 |
| Latin America & Carib. | 68.5 | 15.3 | 37.0 | 6.1 |
| Oceana | 1.0 | 15.7 | 1.4 | 14.0 |
Source: FAO The State of Food Insecurity in the World 2014 p. 8
Does the world produce enough food to feed everyone?
The world produces enough food to feed everyone. For the world as a whole, per capita food availability has risen from about 2220 kcal/person/day in the early 1960s to 2790 kcal/person/day in 2006-08, while developing countries even recorded a leap from 1850 kcal/person/day to over 2640 kcal/person/day. This growth in food availability in conjunction with improved access to food helped reduce the percentage of chronically undernourished people in developing countries from 34 percent in the mid 1970s to just 15 percent three decades later. (FAO 2012, p. 4) The principal problem is that many people in the world still do not have sufficient income to purchase (or land to grow) enough food.
What are the causes of hunger?
What are the causes of hunger is a fundamental question, with varied answers.
Poverty is the principal cause of hunger. The causes of poverty include poor people’s lack of resources, an extremely unequal income distribution in the world and within specific countries, conflict, and hunger itself. As of 2015 (2011 statistics), the World Bank has estimated that there were just over 1 billion poor people in developing countries who live on $1.25 a day or less. This compares with compared with 1.91 billion in 1990, and 1.93 billion in 1981. This means that 17 percent of people in the developing world lived at or below $1.25 a day in 2011, down from 43 percent in 1990 and 52 percent in 1981. (This compares with the FAO estimate above of 791 million people living in chronic undernourishment in developing countries.) Progress has been slower at higher poverty lines. In all, 2.2 billion people lived on less than US $2 a day in 2011, the average poverty line in developing countries and another common measurement of deep deprivation. That is only a slight decline from 2.59 billion in 1981. (World Bank Poverty Overview, World Bank2013). Progress in poverty reduction has been concentrated in Asia, and especially, East Asia, with the major improvement occurring in China. In Sub-Saharan Africa, the number of people in extreme poverty has increased. The statement that ‘poverty is the principal cause of hunger’ is, though correct, unsatisfying. Why then are (so many) people poor? The next sections summarize Hunger Notes’ answer.
Progress in reducing the number of hungry people
The vast majority of hungry people live in developing regions, which saw a 42 percent reduction in the prevalence of undernourished people between 1990–92 and 2012–14. Despite this progress, about one in eight people, or 13.5 percent of the overall population, remain chronically undernourished in these regions, down from 23.4 percent in 1990–92. As the most populous region in the world, Asia is home to two out of three of the world’s undernourished people.
- There has been the least progress in the sub- Saharan region, where more than one in four people remain undernourished – the highest prevalence of any region in the world. Nevertheless, the prevalence of undernourishment in sub-Saharan Africa has declined from 33.3 percent in 1990– 92 to 23.8 percent in 2012–14, although the number of undernourished people has actually increased.
- Hunger continues to take its largest toll in Southern Asia, which includes the countries of India, Pakistan and Bangladesh. The estimate of 276 million chronically undernourished people in 2012–14 is only marginally lower than the number in 1990– 92. Eastern Asia (where China is by far the largest country) and South-eastern Asia (including Indonesia, Philippines, Mynamar, Vietnam and others) have reduced undernutriton substantially.
- Latin America has the most successful developing region record in increasing food security.
The target set by the Millenium goals was to halve the proportion of hungry people by 2015. For developing countries as a whole, the goal was to halve the proportion of hungry people from the base year(s) of 1990-2, or from 23.4% to ll.7%. As the proportion in 2014–one year before the year the goals are supposed to be achieved–is 14.5%, the goal is unlikely to be met, although there has been significant reduction. As can be seen from the table, East Asia, South East Asia, and Latin America and the Carribbean regions have met the goal.
Does the world produce enough food to feed everyone?
The world produces enough food to feed everyone. For the world as a whole, per capita food availability has risen from about 2220 kcal/person/day in the early 1960s to 2790 kcal/person/day in 2006-08, while developing countries even recorded a leap from 1850 kcal/person/day to over 2640 kcal/person/day. This growth in food availability in conjunction with improved access to food helped reduce the percentage of chronically undernourished people in developing countries from 34 percent in the mid 1970s to just 15 percent three decades later. (FAO 2012, p. 4) The principal problem is that many people in the world still do not have sufficient income to purchase (or land to grow) enough food.
What are the causes of hunger?
What are the causes of hunger is a fundamental question, with varied answers.
Poverty is the principal cause of hunger. The causes of poverty include poor people’s lack of resources, an extremely unequal income distribution in the world and within specific countries, conflict, and hunger itself. As of 2015 (2011 statistics), the World Bank has estimated that there were just over 1 billion poor people in developing countries who live on $1.25 a day or less. This compares with compared with 1.91 billion in 1990, and 1.93 billion in 1981. This means that 17 percent of people in the developing world lived at or below $1.25 a day in 2011, down from 43 percent in 1990 and 52 percent in 1981. (This compares with the FAO estimate above of 791 million people living in chronic undernourishment in developing countries.) Progress has been slower at higher poverty lines. In all, 2.2 billion people lived on less than US $2 a day in 2011, the average poverty line in developing countries and another common measurement of deep deprivation. That is only a slight decline from 2.59 billion in 1981. (World Bank Poverty Overview, World Bank2013). Progress in poverty reduction has been concentrated in Asia, and especially, East Asia, with the major improvement occurring in China. In Sub-Saharan Africa, the number of people in extreme poverty has increased. The statement that ‘poverty is the principal cause of hunger’ is, though correct, unsatisfying. Why then are (so many) people poor? The next sections summarize Hunger Notes’ answer.
Harmful economic systems. Hunger Notes believes that a principal underlying cause of poverty and hunger is the ordinary operation of the economic and political systems in the world. Essentially control over resources and income is based on military, political, and economic power that typically ends up in the hands of a minority, who live well, while those at the bottom barely survive, if they do. We have described the operation of this system in more detail in our special section on Harmful economic systems.
Conflict. For 2012, the first and latest year for which its estimates are available, the Center for Research on the Epidemiology of Disasters (CRED) estimates that more than 172 million people were affected by conflict worldwide. Of this total 149 million or 87 percent were conflict-affected residents (CARs). Internally displaced persons (IDPs) accounted for another 18 million and refugees for five million. CRED says that the global total is higher because its figures only include 24 countries for which comparable and validated data are available. CRED observes
- Pakistan with 28 million and Nigeria with nearly 19 million had the largest numbers of people affected by conflict.
- Libya and Somalia had the highest proportion of their populations affected by violence and insecurity at about 90 percent each.
- IDPs suffer the worst health impacts of conflict. They and their children are almost twice as likely as refugees to die from conflict-related causes, particularly disease and starvation.
- Conflict-affected residents also suffer significantly higher death rates than refugees (CRED 2013).
The estimated number of conflict-affected residents (172 million) represents 21 percent of the estimated number of undernourished people (805 million), which gives an approximate idea of the importance of conflict as a cause of hunger.
Hunger is also a cause of poverty, and thus of hunger. By causing poor health, small body size, low levels of energy, and reductions in mental functioning, hunger can lead to even greater poverty by reducing people’s ability to work and learn, thus leading to even greater hunger. See Victoria et al. 2008.
World population A large world population does make it more difficult to provide a decent standard of living for all. Population growth rates have dropped substantially over the last 50 years. See Population Reference Bureau 2014 for analysis of population trends.
Food and agricultural policy. There certainly have been questions raised about the adequacy of food and agricultural policy throughout the world, especially their (lack of) benefit to poor farmers. For two souces that discuss these issues, see IFPRI 2014a and Institute for Development Studies HANCI.
Climate change. Climate change is increasingly viewed as a current and future cause of hunger and poverty. Increasing drought, flooding, and changing climatic patterns requiring a shift in crops and farming practices that may not be easily accomplished are three key issues. Another key issue is the future of industrialization and higher standards of living, as the principal cause of climate change appears carbon dioxide produced by high energy use with industrialization and higher standards of living. See the Hunger Notes special report: Hunger, the environment, and climate change for further information, especially articles in the section: Climate change, global warming and the effect on poor people such as Global warming causes 300,000 deaths a year, study says and Could food shortages bring down civilization?
(Updated March 24, 2015)
India’s Worsening Water Crisis
114 million Indians will soon face desperate domestic, agricultural and industrial shortages borne of a water crisis.
http://thediplomat.com/2014/04/indias-worsening-water-crisis/
By Ram Mashru
In northern India, groundwater supplies are being depleted faster than natural processes can replenish them. According to The World Bank, India is the largest user of ground water in the world, after China. If something is not done soon, an estimated 114 million Indians will soon face desperate domestic, agricultural and industrial shortages.
What is causing this? “Human activities”: primarily wasteful water use (mainly agricultural over-exploitation), a lack of sustainable water-management policies and insufficient public investment. These failings have each been exacerbated by rapid population growth, increasing population density and climate change.
South Asia is a desperately water-insecure region, and India’s shortages are part of a wider continental crisis. According to a recent report authored by UN climate scientists, coastal areas in Asia will be among the worst affected by climate change. Hundreds of millions of people across East, Southeast and South Asia, the report concluded, will be affected by flooding, droughts, famine, increases in the costs of food and energy, and rising sea levels.
Groundwater serves as a vital buffer against the volatility of monsoon rains, and India’s falling water table therefore threatens catastrophe. 60 percent of north India’s irrigated agriculture is dependent on ground water, as is 85 percent of the region’s drinking water. The World Bank predicts that India only has 20 years before its aquifers will reach “critical condition” – when demand for water will outstrip supply – an eventuality that will devastate the region’s food security, economic growth and livelihoods.

delhi_districts

ganges-river-map
How India’s subsidized farms have created a water crisis
http://www.pri.org/stories/2014-07-02/how-indias-subsidized-farms-have-created-water-crisis
http://cdn1.pri.org/sites/default/files/styles/story_main/public/story/images/IMG_5937.jpeg

tubewell

Seedlings fed by a micro-irrigation system

planting rice
tubewell

paddy fields
Farm worker heading for the paddy fields at Gubinder Singh’s farm
South Asia is a desperately water-insecure region, and India’s shortages are part of a wider continental crisis. According to a recent report authored by UN climate scientists, coastal areas in Asia will be among the worst affected by climate change. Hundreds of millions of people across East, Southeast and South Asia, the report concluded, will be affected by flooding, droughts, famine, increases in the costs of food and energy, and rising sea levels.
The Indo-Gangetic Basin, which lies at the foothills of the Himalayas, is one of the areas in the world facing a huge water crisis. The Basin spans from Pakistan, across Northern India into Bangladesh. Apart from runoff from mountainous streams and glaciers, it also holds one of the largest underground bodies of water in the world. But it’s also in one of the most populous regions of the world, with more than a billion people living on the subcontinent. Still, parts of the region are well-resourced when it comes to water supplies – like the Indian state of Punjab, which has three rivers running through it and a network of canals in some parts.
But Punjab faces serious water shortages and a groundwater table that is falling dramatically. As in California, farmers have been tapping into groundwater supplies via tubewells. There are 1.3 million tubewells in the state, and officials say almost all farms have at least one. There are permits for 90,000 more wells awaiting approval. As a result, the water table is dropping by as much as a metre a year, particularly in the worst-affected regions in central and northern Punjab. It is an alarming figure, and one that has water experts around the world sitting up and taking notice.
Groundwater serves as a vital buffer against the volatility of monsoon rains, and India’s falling water table therefore threatens catastrophe. 60 percent of north India’s irrigated agriculture is dependent on ground water, as is 85 percent of the region’s drinking water. The World Bank predicts that India only has 20 years before its aquifers will reach “critical condition” – when demand for water will outstrip supply – an eventuality that will devastate the region’s food security, economic growth and livelihoods.
Analysts fear that growing competition for rapidly dwindling natural resources will trigger inter-state or intra-state conflict. China and India continue to draw on water sources that supply the wider region, and a particularly concerning flashpoint is the Indus River Valley basin that spans India and Pakistan. The river’s waters are vital to the economies of areas on both sides of the border and a long-standing treaty, agreed by Pakistan and India in 1960, governs rights of access. But during the “dry season,” between October and March, water levels fall to less than half of those seen during the remainder of the year. The fear is that cooperation over access to the Indus River will fray as shortages become more desperate.
Public health is also seriously at risk. The demand for safe drinking water in India is already high, and the situation will only grow more acute as levels drop further. The World Health Organization reports that 97 million Indians lack access to safe drinking water, while 21 percent of the country’s communicable diseases are transferred by the use of unclean water.
In their 2013 Outlook Report, the Asian Development Bank calculated India’s water security based on household, economic, urban and environmental needs, and concluded that India’s water prospects are “hazardous.” According to the report, a comprehensive and immediate program of investment, regulation, and law enforcement is necessary. Private-sector groups agree.
The 2030 Water Resources Group, made up of private companies, argues that the “water gap” (between insufficient supply and excess demand) in Asia will only close once countries limit the water-intensity of their economies. In Indian industry, dam construction for hydropower plants and large agribusiness landholdings account for the majority of the country’s water demands.
Parts of India have pioneered successful solutions. The southwestern state of Andhra Pradesh has introduced a highly effective program of self-regulatory water use. Community water-management schemes and awareness campaigns among farmers have seen levels of water consumption fall significantly.
Punjab’s groundwater problem has its origins in India’s Green Revolution, which was launched in the 1970s as a wide-scale bid to bring home-grown food security to the world’s second most populous country. Government subsidies, mechanisation and technology were introduced to encourage Punjabis to turn their lands over to commercial farming. As a result, 97% of Punjab is irrigated, and the state is described as the breadbasket of India.
These days rice is the crop of choice – but rice is the cause of the problem. Farming rice paddy fields requires a lot of water – more than three times the amount of water that Punjab usuallly gets in rainfall each year. And while surface water from canals fills in part of the shortfall, it’s not enough, so groundwater is needed. In addition, farmers receive free electricity from the state to run their submersible motors.
The government has done little to regulate groundwater use as it’s political: as farmers and their families make up around 60 percent of Punjab’s population, they represent valuable votes. At the same time, many Punjabi politicians and officials come from the farmer class. It all adds up to enormous political clout. At the same time, farmers are also tacitly encouraged to grow wheat and rice, as the government buys whatever excess stocks they cannot sell at market.
http://www.nasa.gov/images/content/378067main_water_table%20illus_226.jpg
The averaging function (spatial weighting) used to estimate terrestrial water storage changes from GRACE data is mapped. Warmer colors indicate greater sensitivity to terrestrial water storage changes. Credit: NASA/Matt Rodell

Warmer colors indicate greater sensitivity to terrestrial water storage changes.
Beneath northern India’s irrigated fields of wheat, rice, and barley … beneath its densely populated cities of Jaiphur and New Delhi, the groundwater has been disappearing. Halfway around the world, hydrologists, including Matt Rodell of NASA, have been hunting for it.
Where is northern India’s underground water supply going? According to Rodell and colleagues, it is being pumped and consumed by human activities — principally to irrigate cropland — faster than the aquifers can be replenished by natural processes. They based their conclusions — published in the August 20 issue of Nature — on observations from NASA’s Gravity Recovery and Climate Experiment (GRACE).
“If measures are not taken to ensure sustainable groundwater usage, consequences for the 114 million residents of the region may include a collapse of agricultural output and severe shortages of potable water,” said Rodell, who is based at NASA’s Goddard Space Flight Center in Greenbelt, Md.
Groundwater comes from the natural percolation of precipitation and other surface waters down through Earth’s soil and rock, accumulating in aquifers — cavities and layers of porous rock, gravel, sand, or clay. In some of these subterranean reservoirs, the water may be thousands to millions of years old; in others, water levels decline and rise again naturally each year.
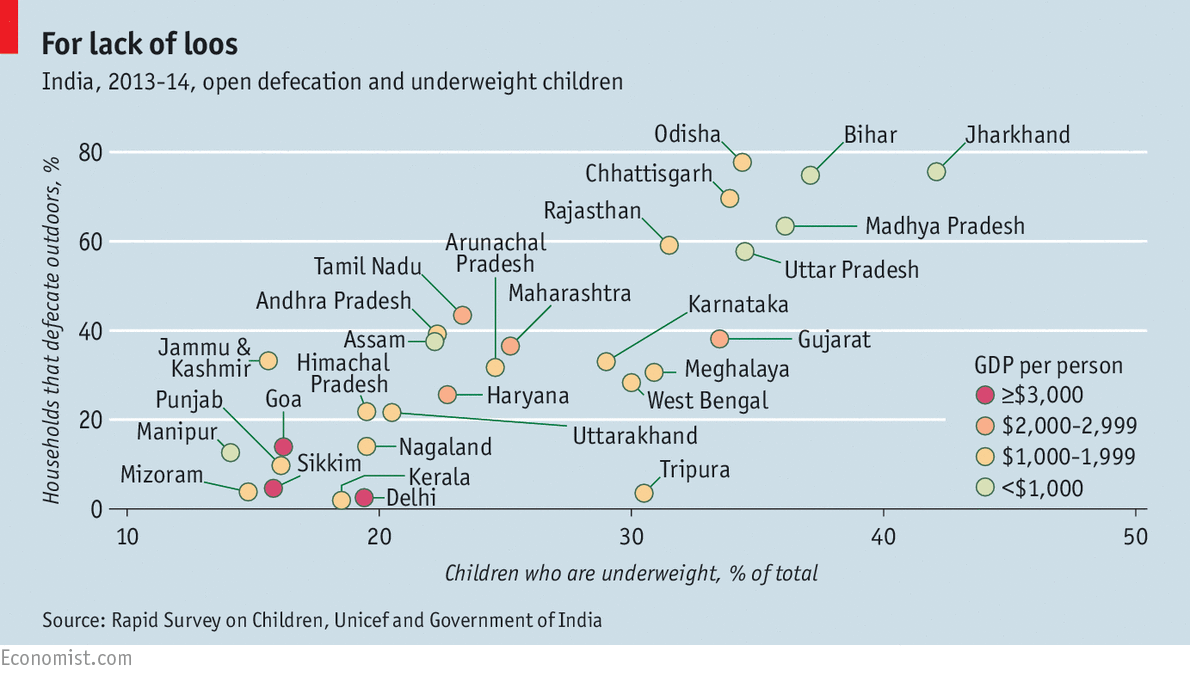
India has more malnourished people than any other country.
Around 30% of children under five are underweight, according to the Rapid Survey on Children (RSOC), which was carried out in 2013 and 2014 by the UN and the Indian government. That is a welcome improvement from an estimated 43% a decade ago. But it still leaves children worse-fed in India than Africa and much less healthy than in China, where only 3% of them are underweight.
Favouring curry
Malnutrition leaves Indians weaker and more vulnerable to disease, but that is not the worst of it. When children are underfed it is not only their bodies that are stunted; it is also their minds. The country will never fulfil its gigantic potential if the brains of its young people never develop properly for lack of nutrients. Fighting hunger harder should therefore be a national priority. Unfortunately, progress is slower than it should be, thanks to taboos, corruption and political pride.
Consider India’s school-lunch scheme. Since the late 1990s pupils at public schools have been entitled to a free midday meal. The program has reduced malnutrition and boosted attendance. Yet it could work much better if it were honestly and competently administered. The food served is sometimes rotten, and studies in some states find that a quarter of the subsidies are stolen. Now religious strictures are making things worse. The chief minister of Madhya Pradesh, a state with lots of poor and ill-fed children, recently banned eggs in school lunches because many people consider them non-vegetarian.
By and large social and health indicators across India follow predictable patterns. In states with higher incomes, those nearer the coast and farther south, most health indicators are better. Typical high achievers are Kerala and Tamil Nadu. In landlocked states, poorer ones and in the north, social and health results are usually worse. Notorious backward states include Bihar and Uttar Pradesh. North-eastern states are often outliers, both poor and landlocked but often with high rates of literacy and better health.
Results from the RSOC mostly bear out these trends. Everywhere has seen a reduction in the share of underweight children and in stunting. But it is striking that on occasion higher incomes do not correlate with the biggest health gains. Maharashtra and Gujarat are both states with relatively prosperous people, but Maharashtra’s nutrition levels are better than Gujarat’s. This is also true for rates of immunisation and of open defecation. It appears that Maharashtra’s government has put more emphasis on tackling nutrition problems, for example among its adivasi, or tribal, population.
Two crucial factors are worth looking at. Lower rates of open defecation correlate well with reduced malnutrition. When children live and play in clean environments they are less likely to be infected with parasites that make it hard to absorb nutrients. And states that focus on helping girls and young mothers probably do better at breaking long-term cycles of malnutrition. Where teenage girls have a low body-mass index there seems a greater likelihood mothers will give birth to undernourished children. Proper nutrition for girls and women should be a priority.
Download data for 15 indicators here.
The original RSOC files—for each separate state and India as a whole—are available to download here (note: large file).
Malnutrition in India
Ravenous for reform
India cannot tackle hunger if it suppresses embarrassing data
SOME of India’s rulers have strong views on food. The home minister, Rajnath Singh, has called for a nationwide ban on slaughtering cows, which as a Hindu he considers holy. At least 20 Indian states and territories (out of 36) ban cow-killing. Since March it has been illegal to possess beef in Maharashtra, and lawmakers in Haryana say those who slaughter cows should be punished as severely as murderers. The education ministry suggests that vegetarian and non-vegetarian students should be segregated in some college canteens; another minister says beef-eaters should move to Pakistan.
Since India is roughly 80% Hindu, it is not surprising that Indian politicians pay respect to Hindu beliefs (many of which they passionately share). But if they care about people as well as sacred animals, they should worry about adding to the national menu, as well as cutting it back.
Political pride is stopping the publication of data that would help India’s states learn from each other. The RSOC survey we cite is big, based on weighing 90,000 children and conducting 210,000 interviews. It was finished eight months ago. Yet apart from a few figures on immunisation rates released in October, the Indian government has failed to make its results public. The UN says the study is sound and blames the government for the delay. The most probable reason for that is because the report casts a shadow over Gujarat, the state once governed by Narendra Modi, the prime minister. The Economist has obtained the full RSOC report and is publishing much of the data this week (see article). Most states show gains, but Gujarat, though prosperous, has worse-than-average rates of child malnutrition. Plausible reasons for that include poor public hygiene and low rates of immunisation.
One reason Indians are less well-nourished than Africans is that more Indians defecate outdoors, so more contract diarrhoea and other diseases that make it harder for children, especially, to absorb the nutrients they consume. The failure to inoculate allows some of these diseases to spread. To deal with these problems, India would have to spend more than a risible 1% of GDP on public health. Alas, Mr Modi as prime minister has overseen cuts in health spending.
Rather than suppress embarrassing information, Mr Modi’s government should publish any data that might help inform better policies. These should focus on girls and women, who are typically worse-fed than their brothers and husbands. Malnourished pregnant mothers give birth to malnourished babies. Even in the wealthiest 20% of Indian households, 26.5% of children are stunted and 17.5% are underweight. It is a fair guess that most of these are female. States, such as Kerala, that try harder to identify the vulnerable and provide them with education and health care achieve better results. Better food policies would make India happier—and cleverer, too
Nutrition in India
Of secrecy and stunting
The government withholds a report on nutrition that contains valuable lessons
A REMARKABLE story has been unfolding in the past decade in India. A new study—conducted by the government and the UN agency for children, Unicef—offers evidence of a steady and widespread fall in malnutrition. But the picture is still grim. Judged by measures such as the prevalence of “stunting” (when children are unusually short for their age) and “wasting” (when they weigh too little for their height), India is still vastly hungrier than Africa.
India’s government has been sitting on the report for months, though it has been ready since at least October. One rumour suggests official concern about the quality of the data, but Unicef has voiced no such worry. Another possible reason is the pride of India’s prime minister, Narendra Modi, who ruled Gujarat for a dozen years. The new data indicate his relatively prosperous state performed worse than many poorer ones. The Economist has obtained the report, known as the Rapid Survey on Children (RSOC). It shows gains at both national and state levels.
Much of what hitherto was known about nutrition in India came from the National Family Health Survey (NFHS) conducted by the government in 2005 and 2006. Work on a follow-up is under way. Unicef and the government agreed in the meantime to conduct the RSOC. It involved 210,000 interviews across 29 states and territories in 2013 and 2014; more than 90,000 children were measured and weighed, as well as 28,000 teenage girls.
Unicef’s nutrition adviser for South Asia, Victor Aguayo, says India’s overall gains have been “unprecedented”. A decade ago 42.5% of all children under five were underweight. Now the reported rate is just below 30%. That improvement coincided with a period of rapid economic growth, rising household incomes and more spending on welfare such as free cooked midday-meals in schools. Madhya Pradesh in central India cut the proportion of its children who go hungry from 60% to 36%; Bihar in the north, from 56% to 37%.
The case of Maharashtra, a wealthy state on the western coast, is revealing. The proportion of children there who are underweight fell from 37% to 25%. Mr Aguayo cites Maharashtra as a “good example” of how to deal with malnutrition, identifying four crucial changes there: better and more frequent feeding of infants, more care for pregnant women, higher household incomes and a rise in the age at which women begin having babies. Officials and politicians in Maharashtra played a crucial role by helping to target worst-afflicted groups such as tribal people known as adivasis.
Other national trends follow similar patterns. The RSOC suggests that the proportion of children who are wasted fell from nearly 20% to 15%, and the stunting rate fell from 48% to nearly 39%. Yet still, more than half of children in Uttar Pradesh, a massive northern state, are below normal height. And amazingly, even among the wealthiest fifth of Indian households, more than a quarter of children are stunted. This may be because of sexism: mothers and girls get less food, health care and education than males. Over half of all girls aged 15-18 had a low body-mass index, meaning they were likelier to produce undernourished babies.
The RSOC highlights several failures. A deworming campaign has achieved little: not even 28% of under-fives had been given a recent dose. And though many women gave birth in institutions, fewer than half of babies were, as the WHO recommends, breastfed within an hour of birth.
India’s age-old habit of defecating in the open—which distinguishes it from many other developing countries—makes matters worse. The proportion of Indians who do this has fallen from 55% a decade ago to 45%, but that is more than enough to help spread diseases, worms and other parasites that make it more difficult to absorb nutrients even when food is abundant. Poor public hygiene may account for much of India’s failure to make faster improvements in nutrition. There is a clear correlation between open defecation and hunger (see chart).

defecation outdoors
Coincidentally or otherwise, states run in the past decade by Mr Modi’s Bharatiya Janata Party (BJP) appear to be laggards compared with several states that are (or were) under the control of rivals. The most sensitive example is Gujarat, which Mr Modi has touted as a model because incomes there are high. The RSOC shows that the proportion of hungry children in the state fell from 44.6% to 33.5%, but that remains worse than the national average. Maharashtra next door has similar incomes and has fared much better. Gujarat is also worse than average for stunting (42%), severe stunting (18.5%) and wasting (18.7%). Nearly two-fifths of its population defecate out of doors.
Malnutrition
The hungry and forgotten
Growth has helped millions to avoid malnutrition but it still threatens to hold back a generation of rural Chinese
Jun 14th 2014 | SONGJIA VILLAGE, HUNAN PROVINCE

pre-school centre in Songjia
THE propaganda message, scrawled in white paint on the side of a wood-frame house, could hardly be more blunt: “Cure stupidity, cure poverty”. The cure for both, in one of China’s poorest counties, seems to be a daily nutritional supplement for children. At a pre-school centre in Songjia, as in more than 600 other poor villages across China, children aged three to six gather to get the stuff with their lunch. If China is to narrow its urban-rural divide, thousands more villages will need to do this much, or more. Widespread malnutrition still threatens to hold back a generation of rural Chinese.
China used to have more undernourished people than anywhere in the world except India: about 300m, or 30% of the population in 1980. Economic growth has pulled half of them out of poverty and hunger. But that still leaves about 150m, mainly in the countryside. Out of 88m children aged six to 15 in the poorest rural areas, around a third suffer from anaemia because of a lack of iron, according to survey data. Iron deficiency can stunt brain development, meaning many of these children will grow up ill-equipped to better their lot. “They are far behind compared with urban kids,” says Lu Mai, secretary-general of China Development Research Foundation (CDRF), a government-run charity. Mr Lu and other experts have been prodding the government to do more. The state subsidises school lunches for 23m children in the 680 poorest counties, as well as nutritional supplements for hundreds of thousands of babies. It is not enough.
Syrian refugee crisis strains Jordan’s water supply
Shortages continue to make regional conflicts worse and force many states to stop growing their own food, NGO says.
The Middle East is facing a water crisis, according to a new report by the World Resources Institute.
The Washington DC-based non-governmental organisation says that, by 2040, the region will experience eight of the 10 worst droughts in the world. Saudi Arabia, Qatar, and Israel will be among the worst affected.
Many countries will have to stop growing their own food. Saudi Arabia, for example, will entirely depend on grain imports by 2016, the report says.
And the lack of water will continue to make conflicts worse in Syria, Palestine, Iraq and elsewhere.
Al Jazeera’s Nisreen El Shamayleh reports from Jordan where, due to the influx of refugees from Syria, the situation is already critical
Is a Lack of Water to Blame for the Conflict in Syria?
A 2006 drought pushed Syrian farmers to migrate to urban centers, setting the stage for massive uprisings
SMITHSONIAN MAGAZINE
An Iraqi girl stands on former marshland, drained in the 1990s because of politically motivated water policies. (Essam Al-Sudani / AFP / Getty Images)
http://thumbs.media.smithsonianmag.com//filer/Scare-Tactics-Iraqi-girl-631.jpg__800x600_q85_crop.jpg
The world’s earliest documented water war happened 4,500 years ago, when the armies of Lagash and Umma, city-states near the junction of the Tigris and Euphrates rivers, battled with spears and chariots after Umma’s king drained an irrigation canal leading from the Tigris. “Enannatum, ruler of Lagash, went into battle,” reads an account carved into an ancient stone cylinder, and “left behind 60 soldiers [dead] on the bank of the canal.”
RELATED CONTENT
Water loss documented by the Gravity Recovery and Climate Experiment (GRACE), a pair of satellites operated by NASA and Germany’s aerospace center, suggests water-related conflict could be brewing on the riverbank again. GRACE measured groundwater usage between 2003 and 2009 and found that the Tigris-Euphrates Basin—comprising Turkey, Syria, Iraq and western Iran—is losing water faster than any other place in the world except northern India . During those six years, 117 million acre-feet of stored freshwater vanished from the region as a result of dwindling rainfall and poor water management policies. That’s equal to all the water in the Dead Sea. GRACE’s director, Jay Famiglietti, a hydrologist at the University of California, Irvine, calls the data “alarming.”
While the scientists captured dropping water levels, political experts have observed rising tensions. In Iraq, the absence of a strong government since 2003, drought and shrinking aquifers have led to a recent spate of assassinations of irrigation department officials and clashes between rural clans. Some experts say that these local feuds could escalate into full-scale armed conflicts .
In Syria, a devastating drought beginning in 2006 forced many farmers to abandon their fields and migrate to urban centers. There’s some evidence that the migration fueled the civil war there, in which 80,000 people have died. “You had a lot of angry, unemployed men helping to trigger a revolution,” says Aaron Wolf, a water management expert at Oregon State University, who frequently visits the Middle East.
Tensions between nations are also high. Since 1975, Turkey’s dam and hydropower construction has cut water flow to Iraq by 80 percent and to Syria by 40 percent. Syria and Iraq have accused Turkey of hoarding water.
Hydrologists say that the countries need to find alternatives to sucking the aquifers dry—perhaps recycling wastewater or introducing desalination—and develop equitable ways of sharing their rivers. “Water doesn’t know political boundaries. People have to get together and work,” Famiglietti says. One example lies nearby, in an area not known for cross-border cooperation. Israeli and Jordanian officials met last year for the first time in two decades to discuss rehabilitating the nearly dry Jordan River, and Israel has agreed to release freshwater down the river.
“It could be a model” for the Tigris-Euphrates region, says Gidon Bromberg, a co-director of Friends of the Earth Middle East, who helped get the countries together. Wolf, too, remains optimistic, noting that stress can encourage compromise.
History might suggest a way: The world’s first international water treaty, a cuneiform tablet now hanging in the Louvre, ended the war between Lagash and Umma.

iraq_water-bassin

iraq_regions_water

SYRIA_WATER_CHLORINE_SUPPLY
Water supply key to outcome of conflicts in Iraq and Syria, experts warn
Security analysts in London and Baghdad say control of rivers and dams has become a major tactical weapon for Isis
http://www.theguardian.com/environment/2014/jul/02/water-key-conflict-iraq-syria-isis
The outcome of the Iraq and Syrian conflicts may rest on who controls the region’s dwindling water supplies, say security analysts in London and Baghdad.
Rivers, canals, dams, sewage and desalination plants are now all military targets in the semi-arid region that regularly experiences extreme water shortages, says Michael Stephen, deputy director of the Royal United Services Institute think tank in Qatar, speaking from Baghdad.
“Control of water supplies gives strategic control over both cities and countryside. We are seeing a battle for control of water. Water is now the major strategic objective of all groups in Iraq. It’s life or death. If you control water in Iraq you have a grip on Baghdad, and you can cause major problems. Water is essential in this conflict,” he said.
Isis Islamic rebels now control most of the key upper reaches of the Tigris and Euphrates, the two great rivers that flow from Turkey in the north to the Gulf in the south and on which all Iraq and much of Syria depends for food, water and industry.
http://static.guim.co.uk/ni/1404220722088/Iraq_water_dams.svg
“Rebel forces are targeting water installations to cut off supplies to the largely Shia south of Iraq,” says Matthew Machowski, a Middle East security researcher at the UK houses of parliament and Queen Mary University of London.
“It is already being used as an instrument of war by all sides. One could claim that controlling water resources in Iraq is even more important than controlling the oil refineries, especially in summer. Control of the water supply is fundamentally important. Cut it off and you create great sanitation and health crises,” he said
Isis now controls the Samarra barrage west of Baghdad on the River Tigris and areas around the giant Mosul Dam, higher up on the same river. Because much of Kurdistan depends on the dam, it is strongly defended by Kurdish peshmerga forces and is unlikely to fall without a fierce fight, says Machowski.
Last week Iraqi troops were rushed to defend the massive 8km-long Haditha Dam and its hydroelectrical works on the Euphrates to stop it falling into the hands of Isis forces. Were the dam to fall, say analysts, Isis would control much of Iraq’s electricity and the rebels might fatally tighten their grip on Baghdad.
Securing the Haditha Dam was one of the first objectives of the American special forces invading Iraq in 2003. The fear was that Saddam Hussein’s forces could turn the structure that supplies 30% of all Iraq’s electricity into a weapon of mass destruction by opening the lock gates that control the flow of the river. Billions of gallons of water could have been released, power to Baghdad would have been cut off, towns and villages over hundreds of square miles flooded and the country would have been paralysed.
https://i.guim.co.uk/img/static/sys-images/Guardian/Pix/pictures/2014/7/2/1404300383396/
Iraqi men move a boat that was stuck on the banks of the Euphrates River after supplies were blocked by anti-government fighters who control a dam further upstream.
In April, Isis fighters in Fallujah captured the smaller Nuaimiyah Dam on the Euphrates and deliberately diverted its water to “drown” government forces in the surrounding area. Millions of people in the cities of Karbala, Najaf, Babylon and Nasiriyah had their water cut off but the town of Abu Ghraib was catastrophically flooded along with farms and villages over 200 square miles. According to the UN, around 12,000 families lost their homes.
Earlier this year Kurdish forces reportedly diverted water supplies from the Mosul Dam. Equally, Turkey has been accused of reducing flows to the giant Lake Assad, Syria’s largest body of fresh water, to cut off supplies to Aleppo, and Isis forces have reportedly targeted water supplies in the refugee camps set up for internally displaced people.
Iraqis fled from Mosul after Isis cut off power and water and only returned when they were restored, says Machowski. “When they restored water supplies to Mosul, the Sunnis saw it as liberation. Control of water resources in the Mosul area is one reason why people returned,” said Machowski.
Increasing temperatures, one of the longest and most severe droughts in 50 years and the steady drying up of farmland as rainfall diminishes have been identified as factors in the political destabilisation of Syria.
Both Isis forces and President Assad’s army are said to have used water tactics to control the city of Aleppo. The Tishrin Dam on the Euphrates, 60 miles east of the city, was captured by Isis in November 2012.
The use of water as a tactical weapon has been used widely by both Isis and the Syrian government, says Nouar Shamout, a researcher with Chatham House. “Syria’s essential services are on the brink of collapse under the burden of continuous assault on critical water infrastructure. The stranglehold of Isis, neglect by the regime, and an eighth summer of drought may combine to create a water and food crisis which would escalate fatalities and migration rates in the country’s ongoing three-year conflict,” he said.
“The deliberate targeting of water supply networks … is now a daily occurrence in the conflict. The water pumping station in Al-Khafsah, Aleppo, stopped working on 10 May, cutting off water supply to half of the city. It is unclear who was responsible; both the regime and opposition forces blame each other, but unsurprisingly in a city home to almost three million people the incident caused panic and chaos. Some people even resorted to drinking from puddles in the streets,” he said .
Water will now be the key to who controls Iraq in future, said former US intelligence officer Jennifer Dyer on US television last week. “If Isis has any hope of establishing itself on territory, it has to control some water. In arid Iraq, water and lines of strategic approach are the same thing”.
https://i.guim.co.uk/img/static/sys-images/Guardian/Pix/pictures/2014/7/2/1404300629581/
A satellite view showing the two main rivers running from Turkey through Syria and Iraq. Credits: MODIS/NASA
The Euphrates River, the Middle East’s second longest river, and the Tigris, have historically been at the centre of conflict. In the 1980s, Saddam Hussein drained 90% of the vast Mesopotamian marshes that were fed by the two rivers to punish the Shias who rose up against his regime. Since 1975, Turkey’s dam and hydropower constructions on the two rivers have cut water flow to Iraq by 80% and to Syria by 40%. Both Syria and Iraq have accused Turkey of hoarding water and threatening their water supply.
“There has never been an outright war over water but water has played extremely important role in many Middle East conflicts. Control of water supply is crucial”, said Stephen.
It could also be an insurmountable problem should the country split into three, he said. “Water is one of the most dangerous problems in Iraq. If the country was split there would definitely be a war over water. Nobody wants to talk about that,” he said.
Some academics have suggested that Tigris and Euphrates will not reach the sea by 2040 if rainfall continues to decrease at its present rate.
SYRIA: Why the water shortages?
http://www.irinnews.org/report/88554/syria-why-the-water-shortages

rivers running from Turkey through Syria and Iraq
http://www.irinnews.org/photo/
The Barada River, shown here in Damascus, is the only notable river flowing entirely within Syrian territory. The city’s water supplies are under huge strain
DAMASCUS, 25 March 2010 (IRIN) – Poor planning and management, wasteful irrigation systems, intensive wheat and cotton farming and a rapidly growing population are straining water resources in Syria in a year which has seen unprecedented internal displacement as a result of drought in eastern and northeastern parts of the country.
“Population [estimated at 24 million in 2009] growth, urbanization and increased economic activity have contributed to the water crisis, as have climate change and mismanagement of the water sector,” said a local expert, who preferred anonymity.
Compared to other Middle Eastern countries, Syria is not naturally water poor. According to the UN Development Programme (UNDP) Arab Human Development Report 2009, Syria was ranked 13th out of 20 Arab countries for precipitation per capita.
Annual per capita water consumption was 300 cubic metres, making it ninth out of 18 Arab countries but significantly below the global water scarcity mark of 1,000 cubic metres per capita. The global average is 6,750 cubic metres.
“Syria is relatively rich in terms of natural water resources, but there has been a huge deterioration in availability per capita,” said Francesca de Châtel, a Damascus-based water expert and author of Water Sheikhs and Dam Builders: Stories of Water and People in the Middle East.
In 2007 Syria consumed 19.2 billion cubic metres of water – 3.5 billion more than the amount of water replenished naturally, with the deficit coming from groundwater and reservoirs, according to the Ministry of Irrigation.
Wasteful agriculture
Agriculture accounts for almost 90 percent of the country’s water consumption, according to government and private sector.
Agricultural policies encourage water-hungry wheat and cotton cultivation, and inefficient irrigation methods mean much water is wasted.
“Irrigation by flooding uses 30-40 percent more water than modern drip irrigation,” said de Châtel.
Something that bodes ill for the future is that despite a 2005 law against drilling wells, illegal wells have proliferated and are being drilled ever deeper to reach shrinking groundwater reserves. “Farmers have depleted groundwater by extracting water for their crops,” said de Châtel.
City limits
The recent influx of hundreds of thousands of people from drought-affected regions into towns and cities is placing a huge strain on urban water supplies.
The Damascus water basin is a closed water system and its resources are being depleted. The city water network leaks up to 60 percent of the water it carries, according to the local authorities. Migrants living on the outskirts are having to pay for water from tankers at an inflated price.
“The root issue is the lack of strategy or proper management,” said the above-mentioned local water expert. “The Damascus basin could have been helped by creating industrial areas in the relatively water-rich coastal zones rather than encouraging businesses to Damascus, for example. But there is no forward thinking and now the urban population will suffer.”
“There urgently needs to be a stronger legal framework and enforcement of the laws,” said de Châtel.
Palestinian malnutrition at African levels under Israeli curbs, say MPs
http://www.ifamericansknew.org/stat/malnutrition.html
By Ben Russell
Political Correspondent From the UK Independent
February 5, 2004
Malnutrition rates in the Gaza Strip and parts of the West Bank are as bad as those in sub-Saharan Africa, MPs said yesterday. They warned that the Israeli security fence around the occupied territories was “destroying the Palestinian economy and creating widespread poverty”.
The all-party Commons International Development Committee called for European Union trade sanctions to be imposed on Israel until it allowed the free export of goods from the West Bank and Gaza.
The committee’s report also condemned suicide bombings as “morally abhorrent” and “a catastrophic tactic that has done great harm to the Palestinian cause”.
MPs called on the Palestinian Authority to be more vocal in its condemnation of attacks. “Israel’s security measures are preventing Palestinians from accessing services as well as inhibiting humanitarian and development work,” the MPs said. “They are destroying the Palestinian economy and creating widespread poverty.”
The MPs, who carried out a fact-finding trip to Israel as part of their six-month inquiry, criticised corruption and mismanagement by the Palestinian Authority, but also condemned the actions of the Israeli government.
They said they understood why the Israeli government had decided to build its 425-mile security fence, but added that it had displaced Palestinian homes, destroyed farms and severely disrupted trade.
Tony Baldry, the Conservative chairman of the committee, said: “Our report is a balanced assessment of the humanitarian situation in the occupied Palestinian territories. It shows that Israel’s security policy is having a marked impact on everyday life.
“Key measures, such as the construction of a security barrier, may bring the mirage of immediate security to Israelis, but the level of despair felt by ordinary Palestinians at being denied an ordinary life can only increase the supply of suicide bombers. Nor is it likely to elicit any concessions from the Palestinian leaders.”
MPs said that the Israeli government and many ordinary Israelis regarded all Palestinians as potential suicide bombers, but said that “it is tragically the case that for a number of Palestinians, the harder the Israeli Defence Force bears down on them the more they feel obliged to resist by force of arms”.
The MPs said that the barrier “destroyed the viability of a Palestinian state” and risked having an irreversible effect on the Palestinian people.
They said: “Rates of malnutrition in Gaza and parts of the West Bank are as bad as anything one would find in sub-Saharan Africa. The Palestinian economy has all but collapsed. Unemployment rates are in the region of 60 to 70 per cent. “The EU should not shy away from using economic pressure to gain political leverage with Israel.”
The report said that Palestinian farmers had land confiscated, crops damaged and were “plagued” by problems in getting goods to market.
MPs condemned the Israeli government for preventing the free export of goods from the West Bank and Gaza, and urged the EU to suspend Israel’s preferential tariff rates until they allow Palestinians free access to European markets. They said: “It is hard to avoid the conclusion that there is a deliberate Israeli strategy of putting the lives of ordinary Palestinians under stress as part of a strategy to bring the population under heel.
The report said movement restrictions on the Palestinians were justified by Israel as security measures, but warned that “in reality they have been a mechanism to put pressure on the Palestinians by crippling the economy”.
State Comptroller’s poverty report reveals bleak image of rampant hunger among Israel’s poor
Goel Beno 04.08.14 / Israel News
http://www.ynetnews.com/articles/0,7340,L-4508210,00.html
The State Comptroller’s poverty report revealed that 894,000 Israelis, of them 306,000 children, go for as long as an entire day without food, or are forced cut down the size of their meals because they can’t afford basic food products.
The grim report was released Monday and placed the blame on one main culprit – the Israeli government.
“A society that caters to the poorest and neediest not only improves its sense of dignity and rights – but also its image,” said Comptroller Yosef Shapira.
Hospital Malnutrition: Prevalence, Identification and Impact on Patients and the Healthcare System
Lisa A. Barker,1,* Belinda S. Gout,1 and Timothy C. Crowe2
Author information ► Article notes ► Copyright and License information ►
Int J Environ Res Public Health. 2011 Feb; 8(2): 514–527.
Published online 2011 Feb 16. doi: 10.3390/ijerph8020514
This article has been cited by other articles in PMC.
http://www.ncbi.nlm.nih.gov/pmc/articles/PMC3084475/
Recently, the definition of malnutrition has been clarified by the European Society of Parenteral and Enteral Nutrition (ESPEN) to highlight the differences between cachexia, sarcopenia (loss of muscle mass and function) and malnutrition [18]. Cachexia can be defined as a “multifactorial syndrome characterized by severe body weight, fat and muscle loss and increased protein catabolism due to underlying disease(s)” [18]. Therefore, malnutrition seen in hospitalised patients is often a combination of cachexia (disease-related) and malnutrition (inadequate consumption of nutrients) as opposed to malnutrition alone. Within the context of this review, the definition of malnutrition adopted refers to the complex interplay between underlying disease, disease-related metabolic alterations and the reduced availability of nutrients (because of reduced intake, impaired absorption and/or increased losses or a combination of these) which is a combination of cachexia and malnutrition [18].
In 1859, Florence Nightingale wrote about hospitalised soldiers during the Crimea war, starving amongst plenty of food [19]. Over 100 years later, beginning from the 1970s, numerous authors have reported malnutrition rates in hospital patients to be approximately 35%, with 30 to 55% of patients entering acute hospitals being at risk of malnutrition [20–24]. Studies have also reported on factors which contribute to malnutrition (see Table 1), consequences of malnutrition and the benefit nutrition support can offer malnourished patients [15,25–27].
Factors contributing to malnutrition in acute care patients (reproduced with permission from [15]; published by Elsevier, 2007).
Over the last 30 years, advances in medical, surgical, nursing and nutrition support have been made; however, numerous publications continue to report the high prevalence and lack of awareness of malnutrition [11,17,28]. To improve detection rate, many studies have investigated various methods for screening and assessing malnutrition, and shown many of these tools to be simple, fast, accurate and of utility in the clinical setting [29–33]. Despite the availability of such tools, malnutrition prevalence remains high and appropriate treatment is not always being delivered. This review aims to briefly summarise nutrition screening and assessment tools available for use in hospitalised patients and provides a short discussion on malnutrition prevalence, consequences and treatment to provide clinicians with a starting point for achieving successful malnutrition identification.
Leave a Reply