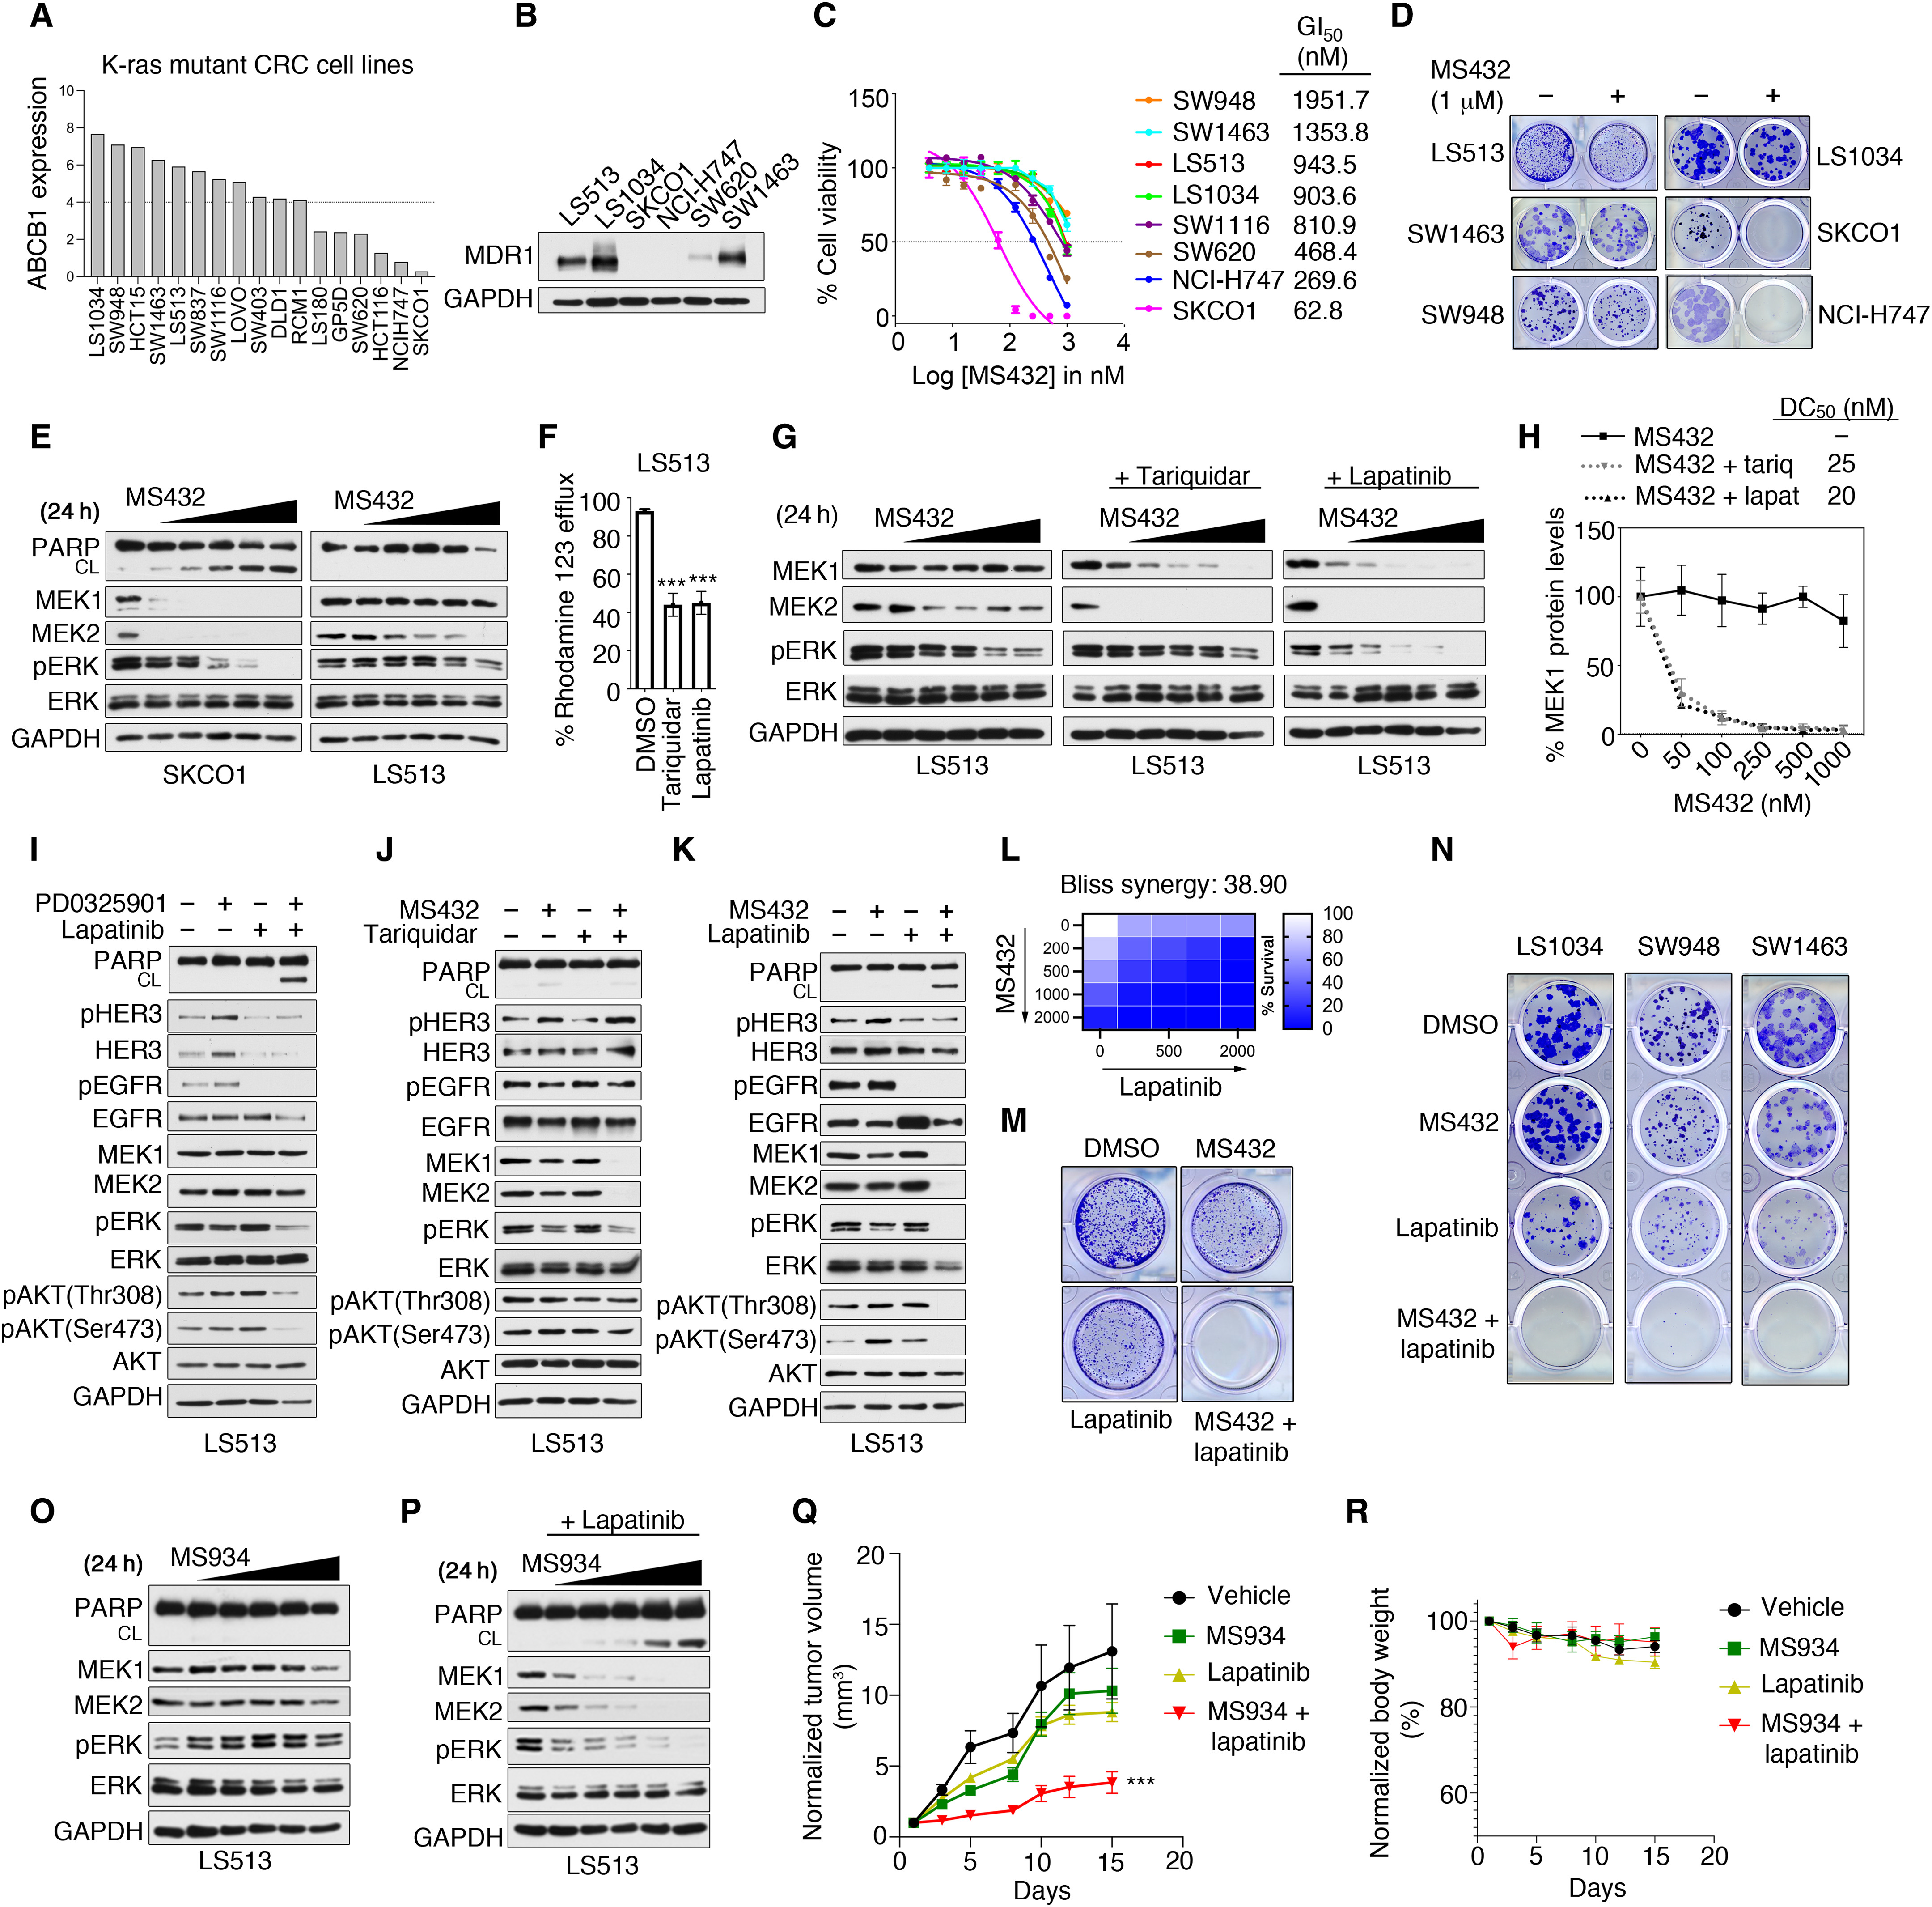
Fig. 6. Combining MEK1/2 degraders with lapatinib synergistically kills MDR1-overexpressing KRAS-mutant CRC cells and tumors.
(A and B) ABCB1 expression in KRAS-mutant CRC cell lines from cBioPortal (30) (A) and MDR1 abundance in select KRAS-mutant CRC cell lines (B). (C) Cell viability assessed by CellTiter-Glo in CRC cells treated with increasing doses of MS432 for 5 days, analyzed as % of DMSO control. GI50 value determined with Prism software. (D) Colony formation by CRC cells 14 days after treatment with 1 μM MS432. (E) MEK1/2 protein levels assessed by immunoblot in CRC lines SKCO1 (low MDR1) or LS513 (high MDR1) treated with increasing doses of MS432 for 4 hours. (F) Rhodamine 123 efflux in LS513 cells treated with DMSO, 2 μM tariquidar, or 2 μM lapatinib. (G and H) Immunoblotting analysis in LS513 cells treated with increasing doses of MS432 alone or in combination with tariquidar (0.1 μM) or lapatinib (5 μM) for 24 hours. DC50 value for MEK1 levels determined with Prism. (I) Immunoblotting in LS513 cells treated with DMSO, PD0325901 (0.01 μM), lapatinib (5 μM), or the combination for 48 hours. (J and K) Immunoblotting in LS513 cells treated either with DMSO, MS432 (1 μM), tariquidar (0.1 μM) (J), or lapatinib (5 μM) (K), alone or in combination. (L) Bliss synergy scores determined from cell viability assays (CellTiter-Glo) in LS513 cells treated with increasing concentrations of MS432, lapatinib, or the combination. (M and N) Colony formation by LS513 cells (M) and others (N) treated with DMSO, lapatinib (2 μM), MS432 (1 μM), or the combination for 14 days. (O and P) Immunoblotting in LS513 cells treated with increasing doses of MS934 alone (O) or combined with lapatinib (5 μM) (P) for 24 hours. (Q and R) Tumor volume of LS513 xenografts (Q) and the body weights of the tumor-bearing nude mice (R) treated with vehicle, MS934 (50 mg/kg), lapatinib (100 mg/kg), or the combination. n = 5 mice per treatment group. In (A) to (R), blots and images are representative of three independent experiments, and quantified data are means ± SD [SEM in (Q) and (R)] of three independent experiments; ***P ≤ 0.001 by Student’s t test.


 2012pharmaceutical
 sjwilliamspa
Leave a Reply