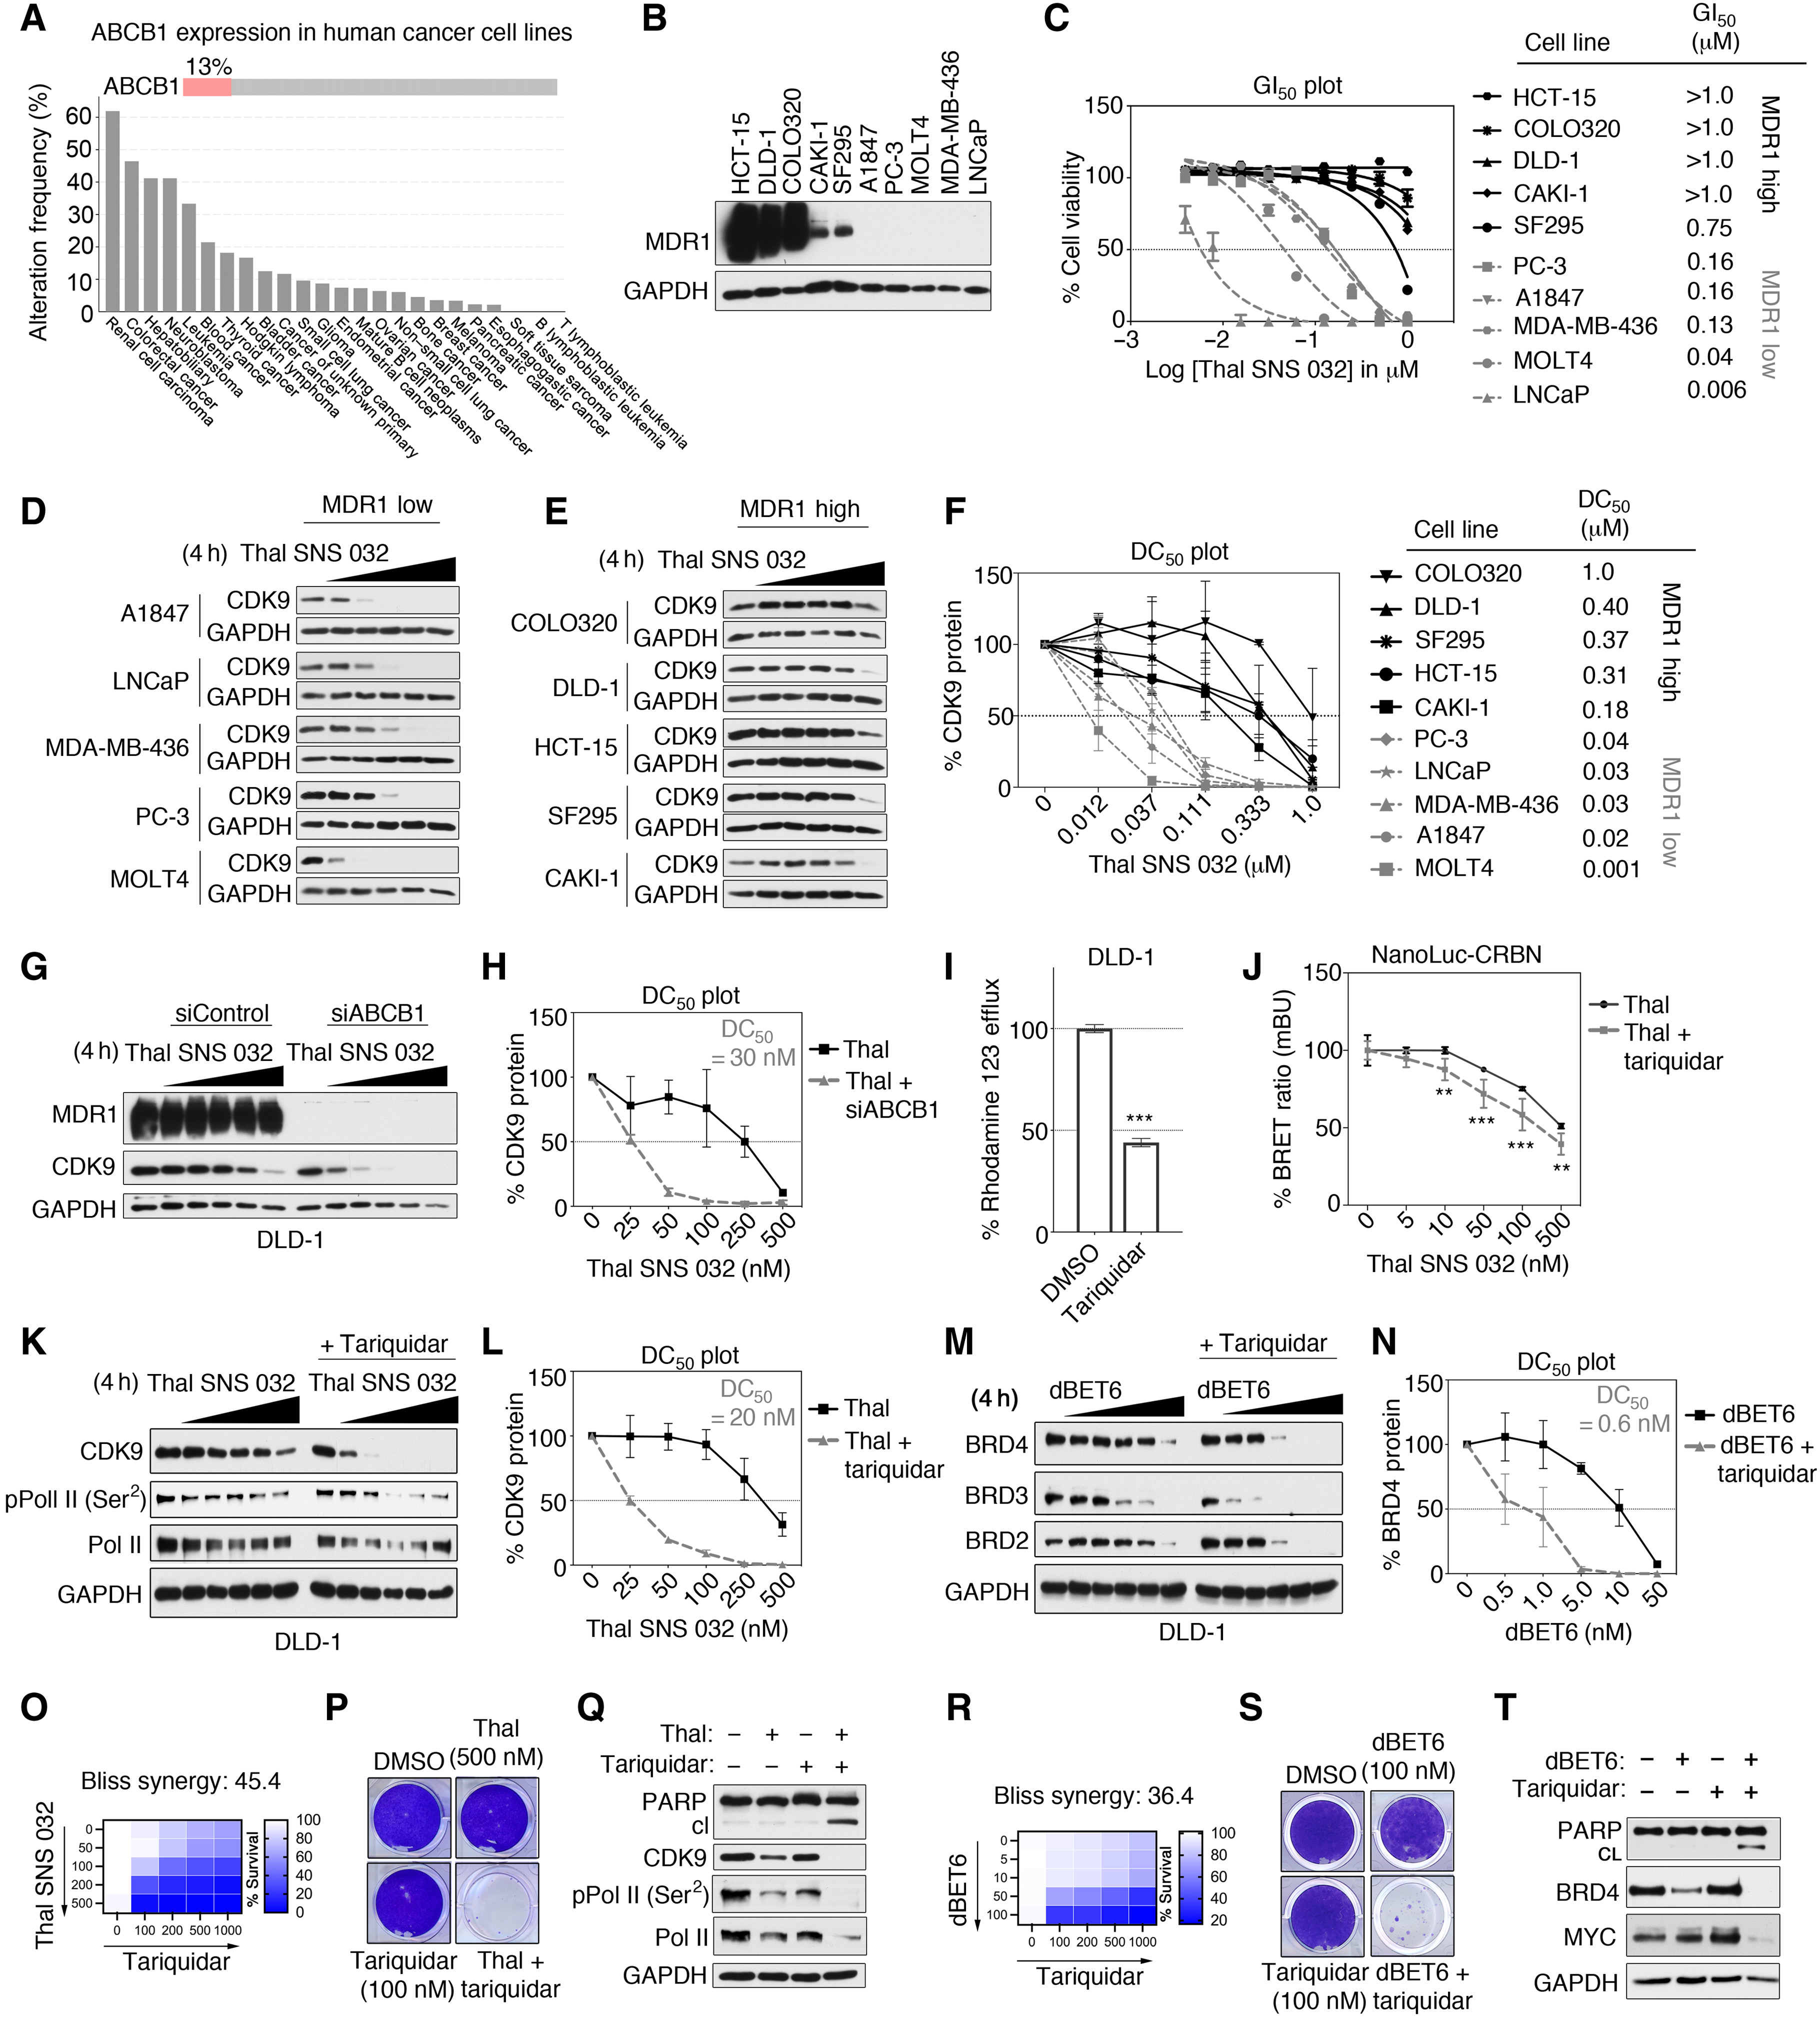
Fig. 4. Overexpression of MDR1 conveys intrinsic resistance to degrader therapies in cancer cells.
(A) Frequency of ABCB1 mRNA overexpression in a panel of cancer cell lines, obtained from cBioPortal for Cancer Genomics using Z-score values of >1.2 for ABCB1 mRNA levels (30). (B) Immunoblot for MDR1 protein levels in a panel of 10 cancer cell lines. Blots are representative of three independent experiments. (C) Cell viability by CellTiter-Glo assay in cancer cell lines expressing high or low MDR1 protein levels and treated with Thal SNS 032 for 5 days. Data were analyzed as % of DMSO control, presented as means ± SD of three independent assays. GI50 values were determined with Prism software. (D to F) Immunoblot analysis of CDK9 in MDR1-low (D) or MDR1-high (E) cell lines after Thal SNS 032 treatment for 4 hours. Blots are representative, and densitometric analyses using ImageJ are means ± SD from three blots, each normalized to the loading control, GAPDH. DC50 value determined with Prism. (G and H) Immunoblotting of control and MDR1-knockdown DLD-1 cells treated for 4 hours with increasing concentrations of Thal SNS 032 [indicated in (H)]. Blots are representative, and densitometric analysis data are means ± SD from three blots, each normalized to the loading control, GAPDH. DC50 value determined with Prism. (I) Drug efflux activity using rhodamine 123 efflux assays in DLD-1 cells treated with DMSO or 0.1 μM tariquidar. Data are means ± SD of three independent experiments. ***P ≤ 0.001 by Student’s t test. (J) Intracellular Thal SNS 032 levels, using the CRBN NanoBRET target engagement assay, in MDR1-overexpressing DLD-1 cells treated with DMSO or 0.1 μM tariquidar and increasing doses of Thal SNS 032. Data are % of DMSO control, presented as means ± SD of three independent assays. **P ≤ 0.01 and ***P ≤ 0.001 by Student’s t test. (K to N) Immunoblotting in DLD-1 cells treated with increasing doses of Thal SNS 032 (K and L) or dBET6 (M and N) alone or with tariquidar (0.1 μM) for 4 hours. Blots are representative, and densitometric analyses are means ± SD from three blots, each normalized to the loading control, GAPDH. DC50 value of Thal SNS 032 for CDK9 reduction (L) or of dBET6 for BRD4 reduction (N) determined with Prism. (O to T) Bliss synergy scores based on cell viability by CellTiter-Glo assay, colony formation, and immunoblotting in DLD-1 cells treated with the indicated doses of Thal SNS 032 (O to Q) or dBET6 (R to T) alone or with tariquidar. Cells were treated for 14 days for colony formation assays and 24 hours for immunoblotting.


 2012pharmaceutical
 sjwilliamspa
Leave a Reply