Topics in Pathology
Larry H Bernstein, MD, FCAP, Curator
LPBI
Special Issues from Medscape Pathology
Hospital Autopsy: Endangered or Extinct?
Angus Turnbull; Michael Osborn; Nick Nicholas
Disclosures
J Clin Pathol. 2015;68(8):601-604.
Abstract
Aim To determine the hospital autopsy rate for the UK in 2013.
Methods A study of data from a ‘Freedom of Information’ request to all (n=186) acute NHS Trusts within England (n=160), NHS Boards in Scotland (n=14) and Wales (n=7) and Social Care Trusts in Northern Ireland (n=5). Hospital autopsy rates were calculated from the number of hospital autopsies performed in 2013 as a percentage of total inpatient deaths in the Trust that year.
Results The UK response rate was 99% (n=184), yielding a mean autopsy rate of 0.69%. The mean rates were 0.51% (England), 2.13% (Scotland), 0.65% (Wales) and 0.46% (Northern Ireland). 23% (n=38) of all included respondents had a rate of 0% and 86% (n=143) a rate less than 1%.
Conclusions The decline in hospital autopsy has continued relentlessly and, for better or for worse, the practice is on the verge of extinction in the UK. The study highlights to health professionals and policy makers the magnitude of this decline. Further research should investigate the impact of this on patient safety, clinical audit, public health and medical education.
Introduction
Autopsy from the Greek ‘autos’ and ‘opsomeri’ means ‘to see for oneself’.[1,2] Its history stems from mummification and human dissection in 3000 BC, through ancient Greece where Hirophilus discovered the duodenum by live human dissection to Rokitansky (1804–1878), regarded as the father of the modern autopsy and who performed or supervised over 100 000 examinations.[1]
Autopsies in the UK comprise medicolegal (those required by HM coroner or in Scotland the procurator fiscal) and hospital consent (clinical) autopsies. Many doctors believe that autopsy is outdated while some argue that autopsies should remain an integral part of medicine, education, clinical audit and research.[1]
In 2013, 45% of registered deaths in England and Wales were reported to the coroner. Of these, 41% underwent coronial autopsy, accounting for approximately 20% of all deaths and over 94 000 autopsies.[3]
Hospital autopsy rates have been falling in the UK and worldwide for over half a century[4–15] (figure 1A, B) and account for a small minority of all autopsies in the UK.[1,3] Recent studies suggest autopsy rates of less than 10% for teaching hospitals and less than 5% elsewhere.[1,16]

Decline in hospital autopsy rates
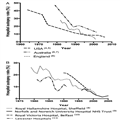
Figure 1.
Decline in hospital autopsy rates over recent decades. (A) Autopsy rates from three first world countries, data collated from multiple studies. (B) Autopsy rates from four different hospitals/NHS Trusts, data collated from multiple studies.
http://img.medscape.com/article/849/356/849356-thumb1.png
The decline in hospital autopsy rates is well known, yet poorly researched and quantified. The majority of medical professionals and politicians in the UK are likely to be unaware of this conspicuous decline. Consequently, little has been done to address the falling rates and the implications of this are not yet fully understood, nor are the consequences.
A PubMed literature search yielded no research detailing a UK-wide autopsy rate within the past 20 years (search terms “hospital autopsy [title]”, “clinical autopsy [title]”, “autopsy rate [title]”). Given this and documented inter-hospital variation (figure 1B), we aimed to determine the current UK autopsy rate.
The structure of healthcare delivery varies throughout the UK. In England, the provision of acute services (emergency, inpatient and outpatient care) is provided by 186 organisations known as Acute National Health Service (NHS) Trusts—each of which may provide care from multiple hospital sites. In Scotland and Wales, the countries are divided into a number of defined geographical areas (Boards), each of which may contain several sites of healthcare delivery. In Northern Ireland, these geographical areas are known as Health and Social Care Trusts.
Method
Acute NHS Trusts within England (n=160), Boards within Wales (n=7) and Scotland (n=14) and Social Care Trusts within Northern Ireland (n=5) were contacted via ‘Freedom of Information’ requests. The level of response therefore is for the Trust/Board, not individual hospitals. If no reply was received within 4 months, reminders were sent.
The hospital autopsy rate was calculated as the number of autopsies performed on patients who died in the year 2013 as a percentage of total deaths which occurred in the hospital in that calendar year.
Studies indicate significantly higher autopsy rates in stillbirths, neonates and young children.[17,18]Therefore, data were excluded if they fell within the following categories:
- Children’s Hospital NHS Trusts
- Stillbirth, neonatal, perinatal and paediatric death
- Trusts with no recorded deaths
- Incomplete responses
Statistical analysis was performed using two-tailed χ2 tests (Prism 6 Software) between each country. The categories used were number of deaths that underwent autopsy and number of deaths not followed by autopsy. Bonferroni correction was used to compensate for the six pairwise comparisons, resulting in 99.25 CIs (p<0.008). Statistical outliers were determined with a ROUT test using a false-positive rate (Q) of 1%.
Results
A 99% (n=184) response rate was achieved for the UK; constituent country response rates were 99% (England), 100% (Scotland), 100% (Wales) and 100% (Northern Ireland). A total of 17 Trusts were removed, according to the exclusion criteria. Eight Trusts were concerned about patient identification because the number of autopsies was small and so provided a ‘fewer than’ figure. In these cases, a maximum possible rate was calculated.
Mean hospital autopsy rates were calculated as the total number of autopsies expressed as a percentage of the total number of deaths. The UK mean autopsy rate was 0.69% and varied considerably between countries. The highest mean autopsy rates were in Scotland (2.1%), followed by Wales (0.65%), England (0.51%) and Northern Ireland (0.46%). The study confirms that hospital autopsy rates are significantly lower than the most recent literature suggests and that there is evident inter-country variation (figure 2A, Table 1) and intra-country variation (figure 2A).
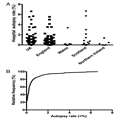
Figure 2.
The results from Freedom of Information request for UK and constituent countries. (A) Individual points representing each sample Trust/Board, non-parametric data, no statistical difference between countries. (B) Cumulative frequency histogram of autopsy rates for NHS Trusts/Boards in the UK.

http://img.medscape.com/article/849/356/849356-thumb2.png
Inter-country pairwise comparisons using χ2 tests of significance (p<0.008) found Scotland to have a significantly higher hospital autopsy rate than each of the other countries (p<0.0001). Other pairwise comparisons failed to achieve significance (Table 2).
Twenty eight samples were statistical high outliers, 20 from England, 6 from Scotland, 1 from Wales and 1 from Northern Ireland. The mean hospital autopsy rate is skewed by these outliers, which typically were large teaching hospitals or small specialist centres. The top 5% (n=7) of Trusts within England performed 47% of the country’s autopsies and 75% of autopsies in Wales were performed in one health board.
Ninety-eight per cent of samples (n=164) had an autopsy rate of <5%, 86% (n=143) an autopsy rate <1% and 23% (n=38) of all samples did not perform a single autopsy in 2013 (figure 2B). This demonstrates that for a quarter of NHS Trusts/Boards in the UK, hospital autopsy is extinct and in only a fraction (1.8%) of specialist trusts do autopsy rates exceed 5%, the rate previously published for non-teaching hospitals.[1,18]
Hospital autopsy rates in children’s hospital NHS Trusts ranged from 0% to 21%. This higher figure is in agreement with other literature.[17,18]
Discussion
This study has demonstrated that the evident decline in hospital autopsy has continued, if not accelerated, over recent years and already the hospital autopsy is extinct in many NHS Trusts. With 23% of NHS Trusts/Boards having an autopsy rate of 0%, a large part of UK hospital autopsy is now performed in a small number of centres. These few demonstrate that if the provisions and attitudes allow, then hospital autopsy rates of the recent past are still achievable, despite recent legislative changes such as the Human Tissue Act 2004/2006. Trusts with higher autopsy rates tended to be small specialised centres or large teaching hospital Trusts; this influence was not measured in this study due to difficulties in defining a ‘teaching’ or ‘specialised’ Trust/Board. Given that 86% of Trusts/Boards in the UK now have a hospital autopsy rate of <1%, we must pose the question whether a revival in hospital autopsy is possible? In the near future, many of these organisations may join the 23% in which hospital autopsy is extinct, unless they implement those changes in policy and attitude present in the 1.8% of Trusts/Boards where hospital autopsy exceeds 5% of inpatient deaths?
The hospital autopsy rate in Scotland was significantly higher than the other countries (Table 2). The causes of this are uncertain but may include variations in the Human Tissue Act and Authority in Scotland or a lower procurator fiscal (coronial) autopsy rate.
A number of Trusts/Boards gave some explanations as to why their autopsy rate was low, these commonly surrounded provision of facilities. For example, one Trust does not employ an onsite histopathologist or have its own autopsy facilities. However, some Trusts/Boards which themselves do not have onsite hospital autopsy facilities have an agreement with neighbouring Trusts/Boards to carry out their autopsies. From the results, there is evidence of remote island providers that continue to implement autopsy despite no local facilities but which transport cadavers via boat or aeroplane to a separate hospital for autopsy. Thus, a lack of facilities does not preclude hospital autopsy although may add significantly to the cost.
Future research should investigate the differences in Trust/Board policies, clinician attitudes, facilities, funding and local demographics to determine how significantly higher autopsy rates can be achieved.
The strength of this study lies in the nationwide approach to calculating contemporary hospital autopsy rates. Previous studies have focused on single hospitals or Trusts; given the demonstrated wide inter-Trust variation this approach may lead to significant errors. A weakness of this study was that some hospital trusts were unable to separate the data for deaths and autopsies for children and adults. Therefore, mean adult autopsy rates may be slightly over-reported, rates being generally higher among paediatric deaths.
In England and Wales, 94 455 coronial autopsies were performed in 2013[3] yet only 1132 hospital autopsies were performed within the English and Welsh Trusts included in this study. Hospital autopsy now accounts for approximately 1.2% of total autopsies. With such low numbers, questions must be raised regarding the effect such decline has on quality assurance, public health, misdiagnosis (a key contributor to avoidable harm[19,20]), audit and the teaching of both medical students and trainee pathologists. Hospital autopsy presents classic cases used to train junior pathologists, given that many coronial postmortems are not used for training. Training in hospital autopsy will become ever more important given the impending lack of pathologists to cover coronial autopsy. The aim of this paper is to raise awareness of the extent of the decline and to prompt discussion on its consequences. While debate continues over the value of hospital autopsy in medical practice, if action is not taken imminently, the practice may disappear.
COMMENTARY
Prostate Cancer: Is It Time to Retire the Gleason Score?
Hello. I am Dr George Lundberg and this is At Large at Medscape.
If you are an American adult male, you either now have prostate cancer—whether or not you know it—or will likely develop it if you live long enough.
In an average recent year, some 220,000 American men are diagnosed with prostate cancer and some 27,000 die from it. That means, obviously, that it kills 12% of those it is found to afflict and does not kill 88%. Of those patients freshly diagnosed, 98.9% are alive at 5 years.
Does interventional therapy account for the good results of some of that nearly 90% of men who are diagnosed and don’t die? Well, yes, but probably not very many. Really bad prostate cancer tends to do its lethal thing, regardless of interventions.
Back when we collectively had a lot of autopsies, it was possible—even easy—- to follow and learn the natural history of many diseases.
Modern autopsy-less American physicians, including pathologists, are whizz-bang at computers, imaging, lab test panels, genes, microbiomes, electronic medical records, and coding. They are maybe not so great at physical exams, taking a useful personal and family history, or gross and microscopic pathology. This latter list is where physicians once got really good at understanding the natural history of diseases.
Now, epidemiologic facts, outcomes, and common sense have begun to prevail over the national hysteria of prostate-specific antigen (PSA) tests for all men. The hysteria tends to take this form: “Find that prostate cancer and root it out…no matter how small or indolent. That way, ‘Megalopolis U’ can keep those operating rooms, hospital beds, and—get this—unproven (but very elegant) proton beameconomic monstrosities really humming in order to satisfy the overpaid MBAs that determined that such were a good investment idea.”
But some prostate cancers really can kill. How about those? A pathologist named Donald Gleason came up with a numbering system intended to guide therapy based upon anaplasia and prognostic threat of prostate cancer. It was 1, 2, 3, 4, and 5. It makes sense. But then, another number dealing with the relative amount of each level of differentiation and pattern (also 1, 2, 3, 4, 5) got added, and combining the two scores became the Gleason score range of 2-10.
A reasonable human could interpret a 6 on a scale of 10 as middling, pretty bad, or a “better-whack-it-out”-type score. So, a team from Johns Hopkins Medical Institutions[1] has worked out the actual prognosis as falling back into 5 Prognostic Grade Groups (PGGs):
- Gleason 1, 2, 3, 4, 5, and 6 become Prognostic Grade Group (PGG I);
- Gleason 3 + 4 = 7 (PGG II);
- Gleason 4 + 3 = 7 (PGG III);
- Gleason 4 + 4 = 8 (PGG IV); and
- Gleason 9-10 (PGG V).
This is so much simpler and less likely to confuse the treating clinician and the patient who is increasingly sharing in this treatment decision.
A European group has just published outcomes based on this PGG system,[2] and it fits nicely. Those many patients with low grades who may not need radical therapy will stand a better chance of notreceiving radical therapy with new low-sounding numbers.
And, by the way, how did “watchful waiting” as a good way to handle those prostate “cancers”—which, from histology, seem like they would behave as indolentomas—morph so quickly into “active surveillance”? My guess is that it is very hard to bill a patient, Medicare, or an insurance company for just letting the patient watch and wait.
Chicago Mayor Rahm—not his physician brother Zeke—Emanuel was right: Never let a crisis go to waste. When the word “cancer” was uttered or written, hair lit on fire and something had to be done, right or wrong.
That is my opinion. I’m Dr George Lundberg.
Medscape Medical News > Conference News
New Clue as to Why Only Some Breast Cancers Relapse
Zosia Chustecka
UPDATED September 26, 2015 // VIENNA — A new clue as to why only some breast cancers recur comes from the largest study of genetic sequencing of breast cancer tissue to date.
While most breast cancer is cured after treatment, about 20% of cases recur. The new study shows that the cases that recur have a different genetic profile, and suggests that some of the genetic drivers of relapse are targetable with drugs.
“We demonstrate that there are clear differences within the driver landscapes of relapsed cancers. This probably reflects a combination of predisposition to relapse and of differences in the mutations acquired during the relapse and metastasis phase,” say the researchers, led by Lucy Yates, MD, a clinical research oncologist from the Wellcome Trust Sanger Institute in Cambridge, United Kingdom.
The finding raises the hope that breast cancer patients who are most at risk for relapse can be identified when they are first diagnosed, they suggest.
In addition, as the newly identified genetic drivers of relapse are targetable with drugs, there is also hope that eventually women who are identified as being at high risk for relapse could be treated with such drugs to prevent recurrence, they suggest.
The study is due to be presented European Cancer Congress (ECC) 2015, but details were released early by the ECC press office.
The finding comes from a study that compared the genetic make-up of breast cancer from 836 tissue samples taken from women on primary diagnosis with 161 samples of tissue taken from recurrences or metastases.
The study is the largest and most comprehensive carried out to date, say the researchers, both in terms of the number of samples from relapsed breast cancers and in terms of the wide-ranging genetic sequencing carried out, which looked at 365 genes involved in cancer-related pathways.
The researchers performed de novo driver mutation discovery, and individual mutations were annotated with likely driver status based upon recurrence and known driver status in previously published, well-curated datasets and databases. The incidence of each driver mutation in the primary and relapse datasets was compared using Fisher’s exact test and using the Benjamini–Hochberg correction for multiple testing.
The team found 11 genes that were significantly enriched in the relapsed cohort compared with the primary tumor cohort. The most heavily enriched were TP53 and ARID1B. Multiple samples were available for 66 patients, including local or distant relapse samples in all cases and a sample from the primary tumor in 21 cases. This multisample analysis allowed the team to trace the evolution of mutations.
“We have found that some of the genetic mutations that drive breast cancers that relapse are relatively uncommon amongst cancers that do not relapse at the point of primary diagnosis,” Dr Yates said in a statement.
“We believe that the differences we have seen reflect genetic differences that can predispose a cancer to return, combined with mutations acquired throughout the period from first diagnosis to the subsequent relapse,” she added.
However, in a discussion of this paper, Fabrice André, MD, PhD, from the Gustave Roussy Institute, in Villejuif, France, questioned whether all the genes that were found to be enriched in the relapsed samples were driving the relapse and whether any could be identified as recurrent markers. He noted that although Dr Yates and colleagues found 11 genes that were highly enriched in the relapsed tissue samples, another study (which analyzed 183 samples) found only one of these genes to be highly enriched.
Dr Andre also wondered whether the late mutations that were identified are clinically relevant ― could they explain the development of resistance to therapy? This has been seen in other cancers, he noted.
Extreme Heterogeneity ― Need for Multiple Biopsies
“Our data reveal extreme heterogeneity and indicate that genomic analysis of primary, relapsed, and matched normal tissue are needed,” Dr Yates concluded.
“We need to do biopsies again and again and again,” said Anne-Lise Borresen-Dale, MD, from the Institute for Cancer Research, Oslo University Hospital, Norway, who chaired the session. But Dr Andre wondered whether circulating tumor cells, the so-called “liquid biopsy,” could be used.
Multiple samples were available for 66 subjects, including local or distant relapse samples in all cases and a sample from the primary tumor in 21 cases. This multisample analysis permitted relative temporal ordering of driver mutation accumulation to be determined, the researchers explain.
“We have found that some of the genetic mutations that drive breast cancers that relapse are relatively uncommon amongst cancers that do not relapse at the point of primary diagnosis,” Dr Yates said in a statement.
“This study highlights the differences between genetic alterations that drive relapsed and metastatic disease as opposed to primary breast cancers, and underlines the importance of analyzing the genetic features of metastases when making treatment decisions,” said Jorge Reis-Filho, MD, from the Memorial Sloan Kettering Cancer Center in New York City, who was acting as a spokesperson for the European Society of Medical Oncology, which is cohosting the meeting. He was not involved with this work.
However, Dr Reis-Filho also cautioned that “the extent of the differences in the repertoire of mutations among different metastatic sites within individual patients remains to be determined, however, as does the best way to obtain tumor-derived genetic material in patients with metastatic disease. We also need to know more about whether single or multiple metastatic sites should be analyzed in this context.”
Also commenting on the study, Peter Naredi, MD, PhD, professor of surgery at Sahlgrenska University Hospital in Gothenburg, Sweden, who is the European CanCer Organization scientific cochair of the congress, said: “Information such as that which Dr Yates will present is very important in the era of precision medicine.”
“This study also underlines the fact that we should consider a recurrence of a cancer as a new event, and carefully select the right treatment for the recurrent tumor as opposed to just relying on information from the first occurrence,” Dr Naredi said in a statement.
JAK Inhibitors in Breast Cancer
Some of the genetic changes that were found in the relapsed/metastatic breast cancer samples appeared at a late stage when the cancer recurred, and were not seen in samples taken at primary diagnosis. Among these later-stage mutations, the researchers say they found “compelling evidence” for the tumor suppression activity of two related genes, called JAK2 and STAT3, that operate within the same signaling pathway.
“Within some breast cancers, a disruption in this signaling pathway seems to be advantageous for survival of the cancer,” Dr Yates said in a statement.
“Interestingly, this is in contrast to the role of JAK2 in some other cancers, where overactivity of the gene drives malignancy rather than suppresses it,” she added.
The JAK (Janus-associated kinase) enzymes JAK1 and JAK2 are involved in regulating blood and immunologic functioning, and a dysregulation of these enzymes is thought to be a driver in the development of myelofibrosis. The first JAK inhibitor, ruxolitinib (Jakafi, Incyte Corp), was approved for the treatment of myelofibrosis in 2011.
Dr Yates and colleagues note that enhanced JAK-STAT signaling is known to play an important role in breast cancer stem cell development and cancerous cell line survival, and preclinical evidence seems to suggest that inhibiting the gene would be therapeutically advantageous. These findings have led to the development of clinical trials for breast cancer using JAK inhibitors in the hope that they will slow cancer progression.
“However, our findings suggest that, in a subset of cancers, inhibiting this pathway may have the opposite effect, and this requires further investigation. In general, the observation highlights the importance of understanding the diverse nature of breast cancers in the era of precision medicine,” Dr Yates said.
The work was funded by the Wellcome Trust. Dr Yates has disclosed no relevant financial relationships.
European Cancer Congress (ECC) 2015: Abstract 1804.
Leave a Reply